British International Investment and Calvert Impact commit $40 million to Vivriti India Retail Assets Fund to enhance financing for Small Businesses and Women Entrepreneurs

  • New commitments bring total fund size close to $150m
  • The fund has deployed $140m, reaching over 272k entrepreneurs in India

Mumbai, February 27, 2025: Vivriti Asset Management (VAM) has raised additional commitments of $40 million for its Vivriti India Retail Assets Fund (VIRAF) from British International Investment (BII), the UK’s development finance institution and impact investor, and Calvert Impact, a global nonprofit investment firm based in the United States, to support financial inclusion for India’s micro, small and medium enterprises (MSMEs).

India’s 63 million MSMEs contribute up to 30 percent of the country’s GDP, generate over 40 percent of exports, and create employment for over 100 million people. However, the MSME finance gap in India remains enormous at an estimated $342 billion, with MSEs accounting for 95 percent of that gap.

Launched in March 2023, at GIFT City, India’s first international financial services centre, VIRAF is a first-of-a-kind asset-backed securitization (ABS) fund in India. VIRAF seeks to scale investments in small ticket loans to MSEs, as well as individuals with a focus on women entrepreneurs.

BII committed $30 million alongside $10 million from Calvert Impact to the senior debt tranche of the fund. They joined existing investors including M&G Catalyst and IFC to bring the total fund size close to $150 million.

As of December 2024, VIRAF has cumulatively invested $140 million in 40+ ABS and bond transactions. These loans have reached over 194,000 individuals and over 78,000 MSME borrowers. Of those, approximately 76 per cent are women. Over a ten-year period, VAM aims to cumulatively invest over $1 billion in retail ABS.

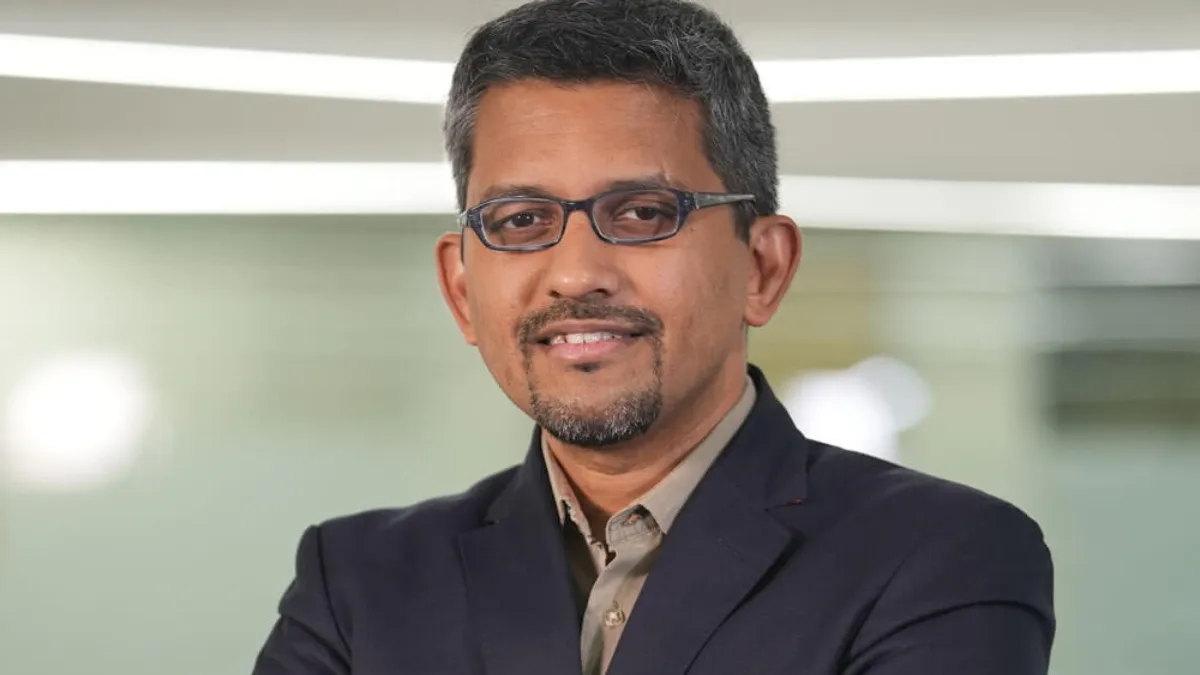
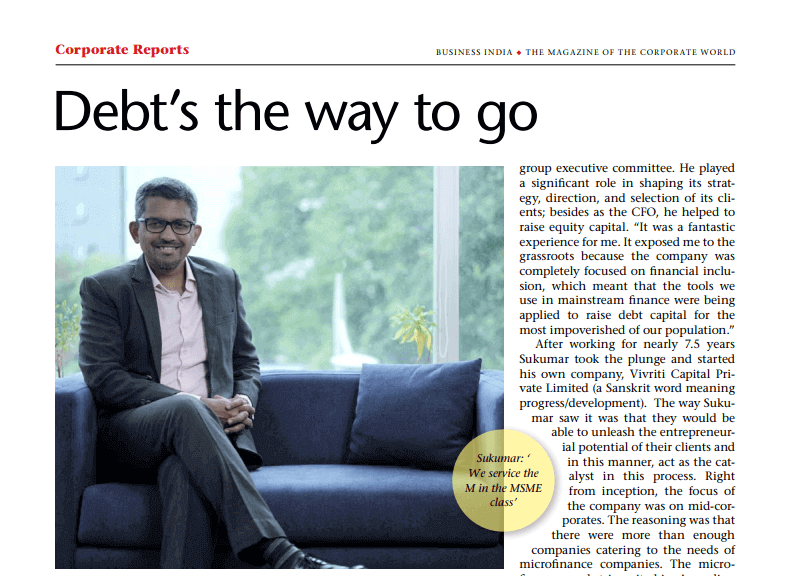
“We are pleased to partner with BII and Calvert Impact in this unique product. Their commitments serve as further validation of VIRAF’s investment thesis and success of innovative structuring which seeks to blend public capital with private capital to finance Sustainable Development Goals. The additional capital will allow us to scale VIRAF further and help demonstrate the scalability, stability and resilience of India’s ABS markets,” said Vineet Sukumar, Founder and MD, VAM.

“Supporting financial inclusion for MSMEs and women-led businesses is a key priority for us in India. To enable more accessible finance for them, we are delighted to collaborate with like-minded partners such as Vivriti Asset Management and support new financial instruments. This innovative securitisation structure will not only provide essential access to finance for local businesses but also demonstrate its commercial viability to mobilise more commercial investors,” said Srini Nagarajan, Managing Director and Head of Asia, British International Investment.

This investment supports UN SDG 5 on Gender Equality, SDG 8 on Decent Work and Economic Growth, SDG9 on Industry, Innovation and Infrastructure as well as SDG10 on Reduced Inequalities.


About VAM

Vivriti Asset Management (VAM) is a performing-credit focused asset manager, investing in debt issued by mid-sized enterprises. With commitments of c.US$625 million across 11 funds, VAM manages sector-agnostic funds that have invested across infrastructure, energy, logistics, financials, Saas and services businesses.

Vivriti Asset Management Private Limited (IFSC branch) is registered with International Financial Services Centres Authority (IFSCA) as a Registered FME (Non-Retail) and the Investment Manager for Vivriti Fixed Income Fund – Series 3 IFSC LLP (trade name of Vivriti India Retail Assets Fund). VIRAF is a restricted scheme (non-retail) under the IFSCA (Fund Management) Regulations, 2022, with a 10-year fund tenure.


About British International Investment

British International Investment is the UK’s development finance institution and impact investor. As a trusted investment partner to businesses in Africa, Asia, and the Caribbean, BII invests to create productive, sustainable, and inclusive economies in our markets. Between 2022-2026, at least 30 per cent of BII’s total new commitments by value will be in climate finance. BII is also a founding member of the 2X Challenge which has raised over $33.6 billion to empower women’s economic development. The company has investments in over 1,580 businesses across 65 countries and total net assets of £8.5 billion. For more information, visit: www.bii.co.uk | watch here. Follow British International Investment on LinkedIn and X.


For more information, visit www.vivritiamc.com

Media contacts:

VAM: Resham Chhabra, resham.chhabra@vivritiamc.com

Vivriti Asset Management Announces Successful Exit of Vivriti Short Term Bond Fund

  • Launched in early 2021, Vivriti Short Term Bond Fund (VSTBF) invested in A-rated corporate bonds, to deliver yield pickup of 400-500 bps over prevailing 3-yr G-Sec
  • Fund size of INR 350 crore, surpassing initial fundraising targets
  • Units of the fund were rated AA+ (SO) by Crisil, for capital protection

Mumbai, January 22, 2025: Vivriti Asset Management (VAM), a pioneer in Performing Credit investment strategies, announced the maturity and successful exit of its second fund – Vivriti Short Term Bond Fund (VSTBF). Launched in early 2021, this Cat-II AIF (alternative investment fund) was VAM’s second Category II AIFin debt issued by mid-sized corporates to deliver 400-500 bps of spread over prevailing 3-yr G-Sec. This was a roll-down strategy with duration of less than 2 years.

VSTBF attracted investments from a mix of marquee family offices, institutional investors, insurance companies, and ultra-high-net-worth individuals (UHNIs). The fund delivered on anticipated return hurdles, through quarterly income payouts, with low volatility over the 4 years of operation.


Fund Highlights

  • Raised INR 350 crore, exercising green shoe option, and invested in 11 portfolio companies
  • Consistent quarterly income distributions and capital return, as envisaged


Soumendra Ghosh, Chief Investment Officer, Vivriti Asset Management, said: “VSTBF was conceptualised in 2020 amidst general ‘risk-off’ and low prevailing market rates, which resulted in significant spreads between AAA / AA / A and BBB rated notes. The fund was structured to capitalise on this and helping clients beat the prevailing 2–3-year AA-rated yields by 250-350 bps, by creating loss protection tranche on a portfolio of A-rated notes, thereby reaching a rating of AA+ (SO) by Crisil on the units of VSTBF. Portfolio construction considered need for safety, short duration, and adequate diversification, in view of challenges in modelling risk back in 2020 (pre-wave II of covid), and imminent advent of inflation and consequent pickup in policy rates through the life of the fund. As we mark its complete exit and capital giveback, I thank our investors for their confidence in us in less certain times.”


About Vivriti Asset Management:

Vivriti Asset Management (VAM), established in 2019, is a SEBI and IFSCA registered asset manager, investing in debt issued by mid-sized enterprises. The firm has invested over INR 7,500 crore across its strategies in 90+ firms, counts over 1,000 unique LPs, and returned ~INR 1,800 crore of capital to investors, since inception.

It is part of Vivriti Group, which manages a portfolio of more than INR 11,000 crore across its lending and asset management businesses.


For more information, visit www.vivritiamc.com

The Pulse – A monthly digest of key macroeconomic events (August 2024)

Executive Summary

The month started quite volatile with weaker global financial sentiments spooking markets as yields plunged, and stocks tanked. However, fears of a hard landing in the US have so far proven to be unfounded, and the asset markets regained stability through the month with a stronger set of data points (GDP, retail sales, etc). Markets perceived Fed Chair Powell’s comments at Jackson Hole as dovish and were quick to price in imminent rate cuts beginning September. While markets are pricing aggressive rate cuts, the Fed might choose to go slow and steady with rate cuts, ensuring data points throughout the year support sustained rate cuts.

Back at home, global volatility spilled onto domestic markets, however, it was short-lived. On the policy front, RBI kept rates on hold and indicated continued progress on inflation without hurting growth, as evident from their forecasts. On the data front, CPI came in softer, while PMIs continued to hold up. Headline GDP though softer, GVA growth surprised to the upside vs consensus expectations, led by the services sector. Private consumption showed signs of recovery after a lacklustre FY24.

Many factors that could have kept risk aversion elevated have failed to do so. Tensions in the Middle East escalated but their impact on energy prices was limited. Concerns around China’s slowdown persist, but pressure on Chinese currency eased this month on the back of a broader weakening in USD.

Domestic Updates

India’s retail inflation dips below RBI target for first time in ~5 years

The retail inflation in India, which is measured as a change in the Consumer Price Index (CPI) softened to 3.54% YoY in July from 5.08% in June and 7.44% in July 2023. It’s the lowest reading in the last 59 months. It’s the first time in nearly 5 years that retail inflation came in below the RBI’s medium-term target of 4%. This is attributable to the food inflation that reached its lowest level since June 2023 as well as the high base effect of last year.

Wholesale price inflation decelerates for first time in 3 months

Inflation based on the wholesale price index (WPI) declined to 2.04% YoY in July from 3.36% in June coming in below market forecasts of a 2.39% rise. This happened as Primary Articles (food particles, minerals, and vegetables) and Food Index rose at a softer pace in July vs. June (3.08% vs 8.80% and 3.55% vs 8.68%, respectively) while vegetable (-8.93% vs 38.76%) and paddy (10.98% vs 12.07%) inflation fell.

Retail inflation for farm and rural workers softens

Retail inflation for farm and rural workers softened to 6.17% YoY and 6.20% in July 2024, respectively, from 7.02% and 7.04%, respectively due to lower prices of certain food items.

India’s industrial output growth moderates

The growth in India’s industrial output, as measured by the Index of Industrial Production (IIP), moderated to 4.2% in June from 6.2% in May due to sluggish growth in manufacturing and electricity output. The growth in manufacturing output decelerated to a 7-month low of 2.6% in June from 5% in May while the same in electricity slowed to a 3-month low of 8.6% from 13.7% in May. However, the growth in mining output rose to an 8-month high of 10.3% in June from 6.6% in May.

India’s real GDP growth slips to 15-month low

The growth in India’s real GDP slipped to a 15-month low in the first quarter of FY25 at 6.7% YoY compared with 7.8% in the previous quarter. Despite the fall, India still remains the world’s fastest major economy (China’s GDP growth in the April-June quarter is recorded at 4.7%). The slowdown in India’s real GDP growth has been attributed to lower-than-expected consumer spending (although consumer demand remained strong growing 7.44% YoY in Q1FY25 compared with 4% in Q4FY24) and subdued government spending (declined 0.24% YoY) as well as election-related disruptions and extreme heat due to summer impacting economic activities.

The primary sector (comprising agriculture, livestock, forestry, fishing, and mining & quarrying) witnessed a degrowth of 2.7% YoY against a growth of 4.2% in the same quarter of FY24. The secondary sector (comprising manufacturing, electricity, gas, water supply & other utility services, and construction) depicted a YoY growth of 8.4% compared with 5.9% in the year-ago quarter. The tertiary sector (services) growth declined to 7.2% YoY compared with 10.7% in Q1FY24.

Despite a slowdown in India’s GDP growth, growth in Gross Value Added (GVA) surprisingly accelerated to 6.8% in Q1FY25 from 6.3% in Q1FY24 and was higher than expected. This was mainly led by construction, public administration, defence and other services, and agriculture segments.

Fiscal deficit stands at 8.1% of FY estimates

India’s fiscal deficit, the gap between govt. expenditure and revenue, came in at INR 1.36 lakh crore for the first quarter of FY25, which is 8.1% of the full-year estimate of INR 16.85 lakh crore, set in the interim budget. However, the govt. reduced the fiscal deficit projection for FY25 to INR 16.13 lakh crore in the annual budget presented in July.

“We are seeing good amount of convergence between market expectations and RBI policies”, Shaktikanta Das

The Reserve Bank of India’s Monetary Policy Committee (MPC) keeps the repo rate unchanged at 6.5% for the 9th time in a row at its bi-monthly meeting with a majority of 4:2. The committee also retained the stance of ‘withdrawal of accommodation’. Governor Shaktikanta Das said, “We are seeing a good amount of convergence between market expectations and RBI policies, they are well aligned.” The central bank retained the inflation forecast at 4.5% raising concerns about food price trajectory and geopolitical tensions. Quarterly forecasts of inflation are revised as follows:

The GDP growth projection was kept unchanged for FY25 (at 7.2%) as well as for Q2FY25, Q3FY25 and Q4FY25. However, the GDP growth forecast for Q1FY25 has been lowered from 7.3% to 7.1%.

India is on fast track in terms of FDI inflows in manufacturing

The foreign direct investment (FDI) inflows in the manufacturing sector jumped 69% to US$165.1 billion in the last 10 years (2014-24), revealed Jitin Prasada, the Minister of State for Commerce and Industry. In Apr-Jun 2024, FDI to India rose by 26.4% to US$22.4 billion, marking the fastest expansion in nearly 5 quarters.

India’s trade deficit continues to expand

India’s trade deficit continues to expand due to declining exports and rising imports. In July 2024, it stood at US$23.5 billion compared with US$20.98 billion in June. Merchandise exports fell 1.4% YoY to US$33.98 billion while merchandise imports increased 7.5% YoY to US$57.48 billion in July.

Unemployment rate declines from 8-month high

The unemployment rate in India dipped to 7.9% in July from the 8-month high of 9.2% in June, revealed the Centre for Monitoring Indian Economy (CMIE) based on their Consumer Pyramids Household Survey. In July, unemployment was higher in urban areas at 8.5% compared to rural areas at 7.5%. In absolute terms, the number of unemployed declined to ~3.5 crore in July from 4.1 crore in June.

Growth in passenger vehicle sales decelerates

Total passenger vehicle sales in India slipped 1.9% YoY to 296,785 units in July in stark contrast to a 5% growth in June, data from the Society of Indian Automobile Manufacturers (SIAM) revealed. However, SIAM believes growth to improve in the short term due to above-average rainfall and the upcoming festive season.

Global Update Roundups

Monetary policies 

  • The US Federal Reserve kept the federal funds rate unchanged at a 23-year high of 5.25%-5.50% for the eighth consecutive meeting. However, Federal Reserve Chairman Jerome Powell, at the Jackson Hole Economic Symposium, clearly indicated that the central bank will cut its interest rate in the September meeting if inflation aligns with expectations. Powell noted the cooling off job market and a downward revision to payrolls and expressed confidence in inflation nearing the central bank’s 2% target.
  • The Bank of England cut its benchmark bank rate by 25 basis points to 5% after maintaining it at 16-year highs for a full year. The move aligned with market expectations. However, the bank intends to tread cautiously in loosening the monetary policy by closely monitoring the inflation trajectory.
  • The People’s Bank of China left its key lending rates – 1-year (the benchmark for business and household loans) and 5-year Loan Prime Rates (mortgages) unchanged at 3.35% and 3.85%, respectively, after cutting them to new record lows in July. The move reflects China’s ongoing efforts to boost its economy and achieve the target growth of 5% in 2024.

GDP growth

  • Japan: The GDP rose 0.8% QoQ in Apr-Jun 2024 in sharp contrast to a decline of 0.6% in the first quarter of the calendar year, as per preliminary reading. It was the strongest quarterly growth since the first quarter of 2023 led by a rise in private consumption (accounts for more than half of the economy) for the first time in five quarters (1.0% vs. -0.6% in Q1CY23)
  • China: The growth in the Chinese economy decelerated to 4.7% YoY in Q2CY24 from 5.3% growth in Q1CY24, missing the consensus of a 5.1% growth. The sluggish growth is attributed to a continued weakness in the country’s real estate market, sluggish domestic demand, falling currency, and trade frictions with the West.

 Unemployment data 

  • US: The unemployment rate rose to 4.3% in July, the highest level since October 2021, from 4.1% in June, adding to concerns of a broader downturn. In July, the US added 114,000 jobs, which is down from 206,000 in June falling short of expectations.
  • UK: The unemployment rate declined to 4.2% in Jun 2024 from 4.4% in May, which was a two-and-a-half-year high. It came in below market forecasts of 4.5%. In absolute terms, the number of unemployed decreased by 51,000 to 1.44 million due to a fall in a number of people unemployed for up to 6 months.
  • Canada: The unemployment rate remained unchanged at the 30-month high of 6.4% in July and came in below expectations of 6.5%. The Canadian economy lost 2,800 jobs in the month. The increase in full-time workers was offset by losses in part-time jobs. The labour participation rate in Canada dipped to a 26-year low of 65% in July (sans the pandemic year).

Inflation readings

  • US: Consumer price inflation in the US decelerated for a 4th consecutive month to 2.9% in July, the lowest reading since March 2021, from 3% in June. The reading is below the consensus of 3%. Prices for essentials, meat, poultry, fish, and milk recorded a marginal rise. Meanwhile, categories like used cars, airfares, and gasoline are getting cheaper.
  • Eurozone: The annual inflation rate rose to 2.6% in July from 2.5% in June. It was above initial market expectations of 2.4%. Countries with the highest annual inflation rates included Romania, Belgium, and Hungary and those with the lowest rates included Finland, Latvia, and Denmark.
  • China: The annual inflation rate rose to 0.5% in July from 0.2% in June, surpassing market expectations of 0.3%. It was the highest inflation reading since February. Food inflation was flat compared to a deflation of 2.1% in June while non-food prices continued to rise driven by clothing, housing, health, and education.
  • Japan: The annual inflation rate held steady at 2.8% for the third straight month in July and remained at its highest level since February. It’s driven by elevated prices of electricity (rose the most since March 1981 at 22.3% vs. 13.4% in June), gas (7.4% vs. 2.4%), food (2.9% vs. 3.6%), housing (0.6% vs. 0.6%), transport (1.2% vs. 2.5%), furniture & household utensils (3.7% vs. 3.7%), clothes (2.2% vs. 2.2%), healthcare (1.5% vs 1.4%), and culture (4.4% vs. 5.6%).
  • UK: The annual inflation rate edged up to 2.2% in July after remaining steady at 2% for consecutive two months earlier, which is also the central bank target. However, it came in below the consensus estimates of 2.3%. Categories that recorded faster price increases include housing and household services (3.7% vs 2.3%), clothing and footwear (2.1% vs 1.6%), communication (4.5% vs 2.9%), and miscellaneous goods and services (3.5% vs 2.9%).

Consumer confidence

  • US: Consumer confidence rose to a six-month high of 103.3 in August from an upwardly revised 101.9 in July reflecting improved perceptions of business conditions. However, the citizens are concerned about the labour market after the unemployment reading jumped in July.
  • Japan: Consumer confidence index remained steady at 7 in July compared with a month-ago reading but came in below the consensus of 36.9. Households’ sentiment in the country improved while the sentiment for income growth and employment deteriorated.
  • UK: Consumer Confidence indicator remained steady at -13 in August for consecutive two months and defied expectations of a minor improvement to -12 due to concerns about the economy. However, the indicator reading remains at the highest level since September 2021.

Balance of Trade

  • US: The US recorded a trade deficit that narrowed to US$73.1 billion in June from the revised US$75 billion in May, which is a 20-month high. Exports increased 1.5% to US$266 billion driven by higher sales of civilian aircraft, automotive vehicles, and energy commodities, including natural gas, petroleum products, and fuel oil.
  • China: China recorded witnessed a trade surplus that widened to US$84.65 billion in July from US$80.22 billion in July 2023 but came in below the consensus estimates of US$99 billion. Exports increased 7% YoY while imports rose 7.2%, reversing from a 2.3% fall in the previous month and depicting the strongest growth since April.
  • Japan: Japan recorded a trade deficit that expanded to JPY 621.84 billion in July from JPY 61.33 billion in July 2023, missing market expectations of a shortfall of JPY 330.7 billion. Imports increased 16.6% YoY, the highest since January 2023, to a 19-month high while exports rose for the eighth straight month by 10.3%.

Purchasing Manager’s Index

Monthly Data Snapshot


Disclaimer:

The details mentioned above are for information purposes only. The information provided is the basis of our understanding of the applicable laws and is not legal, tax, financial advice, or opinion and the same subject to change from time to time without intimation to the reader. The reader should independently seek advice from their lawyers/tax advisors in this regard. All liability with respect to actions taken or not taken based on the contents of this site are hereby expressly disclaimed.

The Transition to Electric 2-Wheelers in India

The faster transition to electric mobility in India is one of the highest needs of the hour given India’s pledge to reduce greenhouse gas (GHG) emissions by 33-35% by 2030 compared to 2005 levels. Given the fact that 2-wheelers account for more than 70% of vehicles on Indian roads, there is no doubt that the transition to e-mobility in India is highly dependent on electric 2-wheelers (E2W) compared to other classes of passenger vehicles in the segment. Hence, the role of E2W in achieving India’s GHG reduction goal is very critical as they emit up to 50% lesser GHGs compared to traditional internal combustion engines (ICE).

ICEs contribute to both air and noise pollution while E2W produces zero tailpipe emissions mitigating climate change and helping reduce noise pollution which is a major concern in urban areas. Also, the transition to E2W leads to minimal energy wastage and a lower carbon footprint as they offer a more efficient powertrain than ICE, resulting in an efficient conversion of electrical energy into mechanical energy. Furthermore, they are cheaper to design and manufacture and have lower grid load requirements. These factors, along with increasing consumer awareness are resulting in the development of domestic manufacturing capabilities of E2W in India, the world’s largest 2-wheeler market, and elsewhere in Southeast Asia.

If we look at the trend in the adoption rate of E2W across the world, a significant bifurcation is visible with respect to the class of 2-wheelers. While developing countries like China are inclined towards transportation-oriented 2-wheelers developed countries like North America are focusing more on the heavyweight (more than 250 CC) segment.

The below chart indicates that the adoption rate of E2W in India has been increasing at a rapid pace in the past few years.

Within the E2W segment in India, e-scooters hold the dominant market share due to factors such as affordability, lightweight design, shorter charging times, and good maneuverability. In fact, the share of e-scooters in the overall scooter sales jumped from below 10% to roughly 15% on average in FY23 and FY24.

Competition – E2W Players in India

The competition in the E2W market in India is unique and converse to what it is in the ICE 2W market at the beginning. In the ICE market, incumbents like Hero MotoCorp, Bajaj Auto, TVS Motor, etc., continue to dominate the market. However, in the E2W market, the legacy players face strong competition from new players like Ola Electric, Ather Energy, and Okinawa Autotech due to several factors such as their high reliance on offline channels, OEM-led apps, and digital purchase journey provided by start-up OEMs, etc. However, things have changed lately as legacy players started expanding their presence in the evolving market by setting up more touchpoints, service networks, new product launches, and collaboration in charging networks with new players (for example, Hero and Ather).

Factors driving the transition

Bike rental model: The emergence of bike rental model in Tier-I and Tier-II towns spearheaded by companies such as Bounce, Vogo, and YULU brought the utility of E2W to the forefront not only for commuting but also for e-commerce and hyperlocal deliveries as well as long-term rentals. Their subscription plan, ranging from hourly to weekly, monthly, and annual, offered a lot of flexibility to users. Overall, the subscription plans and bike aggregation model by some operators have accelerated the adoption of E2W for both private and commercial purposes.

Government support: The Government of India (GoI) has rolled out several incentives to promote and incentivize E2W and overall EV adoption. In 2015, the Faster Adoption and Manufacturing of (hybrid &) EVs (FAME I) was launched, a major initiative under the National Electric Mobility Mission Plan (NEMMP), to address the concern by subsidizing EV use and manufacturing. The first phase was later extended to increase subsidies and reduce the GST rate on EVs. The second phase was launched in 2019 and extended till March 2024. FAME II was aimed at electrification of Public and Shared Transport subsequently aligning with the base objectives of FAME I.

In 2021, GoI also launched the Production Linked Incentive (PLI) scheme under the Make in India initiative to boost the manufacturing of advanced chemistry cell battery storage. Further, in 2022, the Battery Swapping Policy for EVs was introduced to promote battery-swapping methods.

These government supports have helped reduce the cost of ownership, boosted customer awareness, and helped the launch of feature-rich models, alleviating cost concerns of owning E2W thereby attracting budget-conscious consumers.

Delivery business: The rise of the delivery business in India, especially post-COVID-19, has pushed the adoption of E2W mobility as it provides an efficient and cost-effective solution for last-mile deliveries. Further, E2W facilitates agile transportation in crowded urban areas while reducing operational costs and carbon emissions.

Total Ownership Costs (TCO): TCO per km plays a pivotal role in the transition to E2W in India as it influences consumer decisions to adopt them. Compared to ICE 2-wheelers, E2W reduces operating expenses of ownership due to significantly lower fuel costs and minimal maintenance requirements / expenses.

Fewer parts: E2W, like other EVs, requires significantly fewer parts than traditional ICE 2-wheelers. For instance, an ICE 2-wheeler has more than 150 components that are split between the engine and transmission assemblies while the powertrain in an E2W has just 25 components. This reduces the maintenance needs of E2W; however, their components are more complex than ICE components.

Challenges in transition

Despite the strong momentum in EV adoption, the road to the E2W transition in India is still patchy. Challenges loom with respect to concerns about vehicle safety, battery life, insufficient charging infrastructure, and other factors. Let’s deep dive into some of them.

Battery:  The battery is the key and the most expensive component of E2W like other EVs. It accounts for 35-40% of the vehicle price and about 50% of the battery cost is attributed to cathode which is mainly made up of Lithium, Cobalt, Manganese, and Nickel. Currently, the majority of OEMs are dependent on imports to meet their battery requirements, and their domestic operations only involve the assembly of battery packs.

Over 95% of the world’s lithium is imported from four countries – Australia, Chile, Argentina and China. Australia, which houses the world’s largest lithium mine, Greenbushes, exports ~95% of its lithium to many countries, the top buyer being China. Given the rising adoption of EVs in India, the battery demand for EVs in India is expected to quadruple from ~15GWH currently to ~60 GWH by FY30. As a result, the development of a battery manufacturing ecosystem in India holds the key to the targeted adoption of E2W and EVs in India.

Reduction in subsidy: GoI has cut back subsidies to OEMs due to a lack of localization of procurement and assembly of vehicles. The FAME II subsidy scheme, which ended its run on March 31, 2024, saw both Cap on demand incentive (as a percentage of showroom price) and Demand incentive (INR per kWh) reduced from 40% to 15% and INR 15,000 to 10,000, respectively, since 2023. This amendment had hit the pace of transition to E2W in India in the recent past. GoI has replaced FAME II with the Electric Mobility Promotion Scheme 2024 (EMPS 2024) which will offer support only up to INR 10,000 per two-wheeler.

Negative publicity: The use of E2W in India faced negative publicity in the past and is vulnerable to incidents of accidents and malfunctioning due to inferior vehicle quality. The fear and concerns about vehicle safety have slowed the pace of transition to some extent.


Disclaimer:

The views provided in this blog are of the author and do not necessarily reflect the views of Vivriti. This article is intended for general information only and does not constitute any legal or other advice or suggestion. This article does not constitute an offer or an invitation to make an offer for any investment.  

THE PULSE – A monthly digest of key macroeconomic events, June 2024

“There are decades where nothing happens; and there are weeks where decades happen.” – Vladimir Ilyich Lenin


Domestic Updates

India’s retail inflation soothes but wholesale inflation continues to rise

The retail inflation based on the Consumer Price Index (CPI) rate for May dropped to a 12-month low of 4.75% YoY, which was below expectations and saw a marginal decline from 4.83% in April. The downward trend is attributed to all contributors to the headline inflation either softening or remaining steady on a mom basis except a few like pulses. Vegetable inflation continues to be a concern (rose 27.3% YoY in May vs. 27.8% in April) due to the impact of heatwaves across the country. Core inflation, which strips out food and fuel, remained steady at 3.1% YoY in the month. This is the 9th consecutive month the retail inflation remained within RBI’s tolerance band of 2 percentage points within 4%. On the other hand, wholesale price inflation jumped to 2.61% YoY in May from 1.26% in April driven by rising prices of food and primary articles. Food inflation surged to 9.82% in May from 7.74% in April due to higher prices of cereals, wheat, pulses, vegetables, and fruits.

India’s industrial output growth moderates to 3-month low

The growth in India’s industrial output, as measured by the Index of Industrial Production (IIP), moderated to 5% YoY in April from an upwardly revised 5.4% last month, mainly driven by performance in the mining (6.7% YoY) and power (10.2% YoY) sectors. Manufacturing sector output grew 3.9% driven by basic metals, coke and refined petroleum products, and motor vehicles, trailers & semi-trailers.

RBI not in for any rate cut

In its second meeting of the financial year 2024-25, the Reserve Bank of India (RBI) kept the repo rate unchanged at 6.5% for the eighth consecutive time, which was in line with market expectations. RBI Governor Das said, “These decisions are in consonance with the objective of achieving the medium-term target for consumer price index inflation of 4% within a band of +/- 2% while supporting growth”. However, the central bank committee has revised India’s GDP growth forecast upwards from 7% to 7.2% for FY2024-25. It remained focused on the withdrawal of accommodation to ensure that inflation does not go up while supporting growth.

India to remain the fastest-growing major economy!

The World Bank in its recent report predicted that India will remain the fastest-growing major economy, with an average growth rate of 6.7% over the next three years, including the current financial year. However, it mentioned that the growth rate is expected to moderate due to a slowdown in investment from a high base. In April’s report, the global agency raised India’s growth forecast by 20 basis points to 6.6% for FY25. For FY26 and FY27, the growth forecasts are 6.7% and 6.8%, respectively.

2 -wheeler & 3-wheeler growth on a fast lane!

The automotive industry witnessed a robust performance in May. Passenger vehicle sales in the domestic market rose 3.9% YoY due to a high base while two-wheeler and three-wheeler segments recorded double-digit growth of 10.1% and 14.7% respectively in May due to higher demand.

RBI report indicates domestic resilience in India’s financial system

RBI’s Financial Stability Report reflected robustness and resilience in the Indian financial system despite global economic challenges like prolonged geopolitical tensions, rising public debt, and the sluggish pace of disinflation. The gross non-performing assets (GNPA) of scheduled commercial banks (SCB) declined to a multi-year low of 2.8% and the net non-performing assets (NNPA) ratio stood at 0.6% at March 2024-end. The financial condition of the non-banking financial companies (NBFCs) remained healthy with a Capital to Risk-weighted Assets Ratio (CRAR) of 26.6%, GNPA ratio of 4% and, return on assets (RoA) of 3.3%, respectively, as of March 2024-end.


Global Updates

US unemployment worsens

The unemployment rate in the US rose to 4% in May, the highest since January 2022, which is higher than 3.9% in April. The market expected the unemployment rates to be unchanged. The labour force participation rate declined to 62.5% in May from 62.7% in April.

Japan’s economic contraction turns narrower

The GDP growth in Japan contracted at a narrower pace of 1.8% YoY in Jan-Mar 2024 compared to estimates. The preliminary reading was a 2.0% decline, and a median forecast was a 1.9% fall.

Roundups

Monetary Policies 

The US Federal Reserve in its Federal Open Market Committee (FOMC) meeting left the benchmark interest rates unchanged at 5.25-5.50% for the 7th straight meeting, in line with Wall Street estimates, on a unanimous vote. The US Fed retained the GDP growth projections for 2024 but raised the inflation forecast for the year by 20 basis points (bps) in addition to a 10-bps hike in 2025. With this, the central bank kept the policy rate unchanged since July 2023 after hiking the rates by 5.25 percentage points since March 2022 to tame inflation down consistently toward the 2% target range.

Other central bank actions: The Bank of Canada reduced its key interest rate by 25 basis points (bps) to 4.75%, marking its first rate cut since March 2020. This happened as Canada’s inflation rate moved closer to the central bank target of 2% in recent months (recorded at 2.7% in April) while GDP growth rate (1.7%) came in weaker than expected in the first quarter of calendar year 2024. The Bank of Canada last announced a hike in interest rates to 5% in July 2023 and held it there. The central bank Governor Tiff Macklem said “We’ve come a long way in the fight against inflation. And our confidence that inflation will continue to move closer to the 2% target has increased over recent months”. The European Central Bank announced its first interest rate cut since 2019 by 25 bps to 3.75% from a record-high level of 4% citing progress in controlling inflation. However, the bank said its efforts to combat inflation are far from over. The central bank now expects inflation to be 2.2% on average in 2025, up from the previous estimate of 2%. The Bank of England’s Monetary Policy Committee decided to keep the Bank Rate unchanged at 5.25% during its June meeting, which was in line with the market expectations. The central bank, which set the target inflation at 2%, saw inflation falling to 2% in May from 2.3% in April and 3.2% in March. The Bank of Japan kept its key short-term interest rate at around 0% to 0.1% at its June meeting by a unanimous vote, as widely expected. The central bank will reveal its tapering plan for the next 1 to 2 years at the July meeting. It will continue buying government bonds at the current pace of US$38 billion per month but start trimming in the future. The People’s Bank of China left their benchmark loan prime lending rates unchanged in the June meeting. By consensus, the central bank kept the 1-year loan prime rate (LPR) at 3.45% and the 5-year LPR at 3.95%. This happened as China’s real estate sector continues to remain under pressure.

Inflation readings

The annual inflation rate in the US slowed marginally to 3.3% in May, the lowest in three months, from 3.4% in April, due to cheaper gasoline. Despite falling from the peak of 9.1% in June 2022, inflation continues to remain above the central bank target of 2%. In the Eurozone, annual inflation eased to 2.5% in June from 2.6% in May as per preliminary forecasts. Thanks to softer pace of rise in prices of food, alcohol and tobacco, and energy. Inflation was steady for non-energy industrial goods and services. In the UK, the annual inflation rate reached the central bank’s target level of 2% in May, which is the lowest since July 2021. Inflation declined from 2.3% in April led by led by a sluggish pace of increase in prices of food (1.7% vs 2.9%, the lowest since October 2021), namely bread and cereals, vegetables, etc. Prices also eased for restaurants and hotels (5.8% vs 6%) and recreation and culture (3.9% vs 4.4%). The annual inflation rate in Japan accelerated to 2.8% in May 2024 from 2.5% in April, pointing to the highest reading since February. There was a steep upswing in electricity prices as energy subsidies fully ended (14.7% vs -1.1% in April), reversing declines in the prior 15 months. At the same time, prices rose further for food (4.1% vs 4.3%), housing (0.6% vs 0.6%), transport (2.3% vs 2.7%), furniture & household utensils (2.9% vs 2.5%), clothes (2.2% vs 2.2%), healthcare (1.1% vs 1.2%), culture (5.2% vs 6.2%), miscellaneous (1.2% vs 1.1%), and communication (0.4% vs 1.0%). The annual inflation rate in China was unchanged at 0.3% in May for the second straight month in a row which is lower than market forecasts of 0.4%. Food prices declined 2% while non-food prices rose 0.8% in the month.

Disclaimer:

The details mentioned above are for information purposes only. The information provided is the basis of our understanding of the applicable laws and is not legal, tax, financial advice, or opinion and the same subject to change from time to time without intimation to the reader. The reader should independently seek advice from their lawyers/tax advisors in this regard. All liability with respect to actions taken or not taken based on the contents of this site are hereby expressly disclaimed.