DATE
July 8, 2025
PLACE
Mumbai
READING TIME
10 mins
Featured Article

The Pulse – Insights on key macroeconomic data and events (June 2025)

“Financial conditions have been eased, supported by accommodative monetary policy and low volatility in financial markets. The strength of the corporate balance sheets also lends support to overall macroeconomic stability.” – RBI Financial Stability Report (FSR), June 2025


Executive Summary

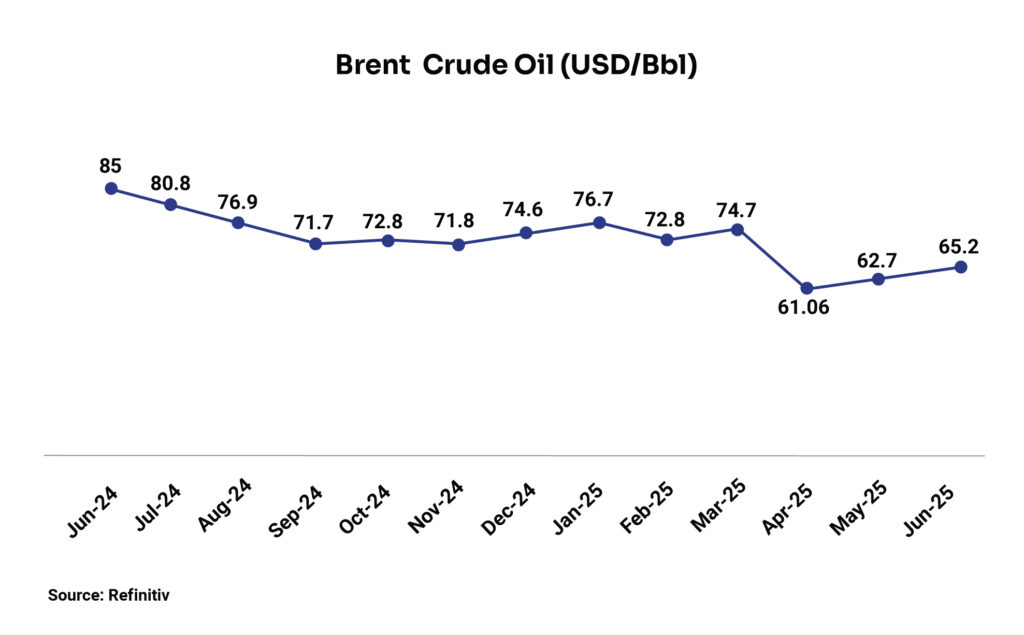
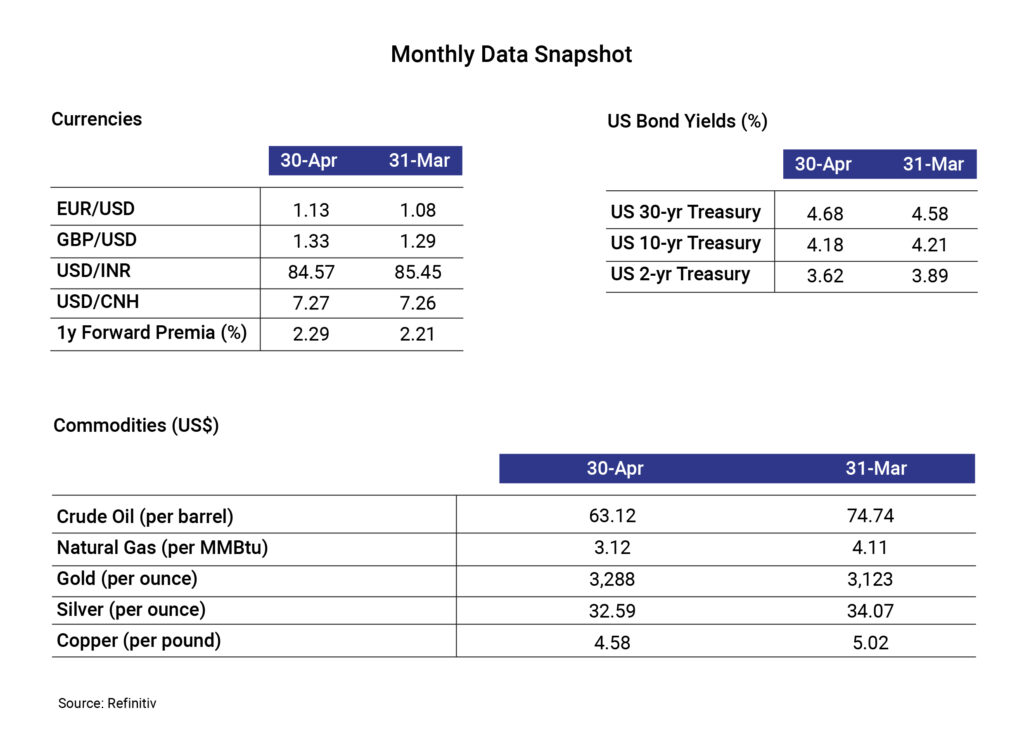
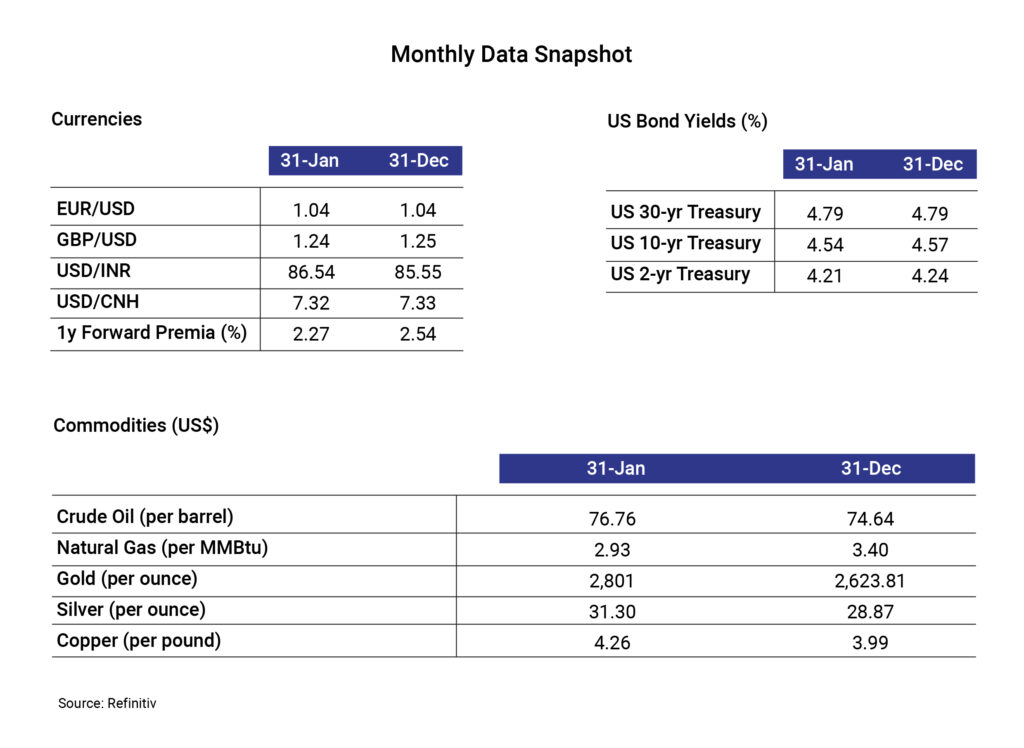
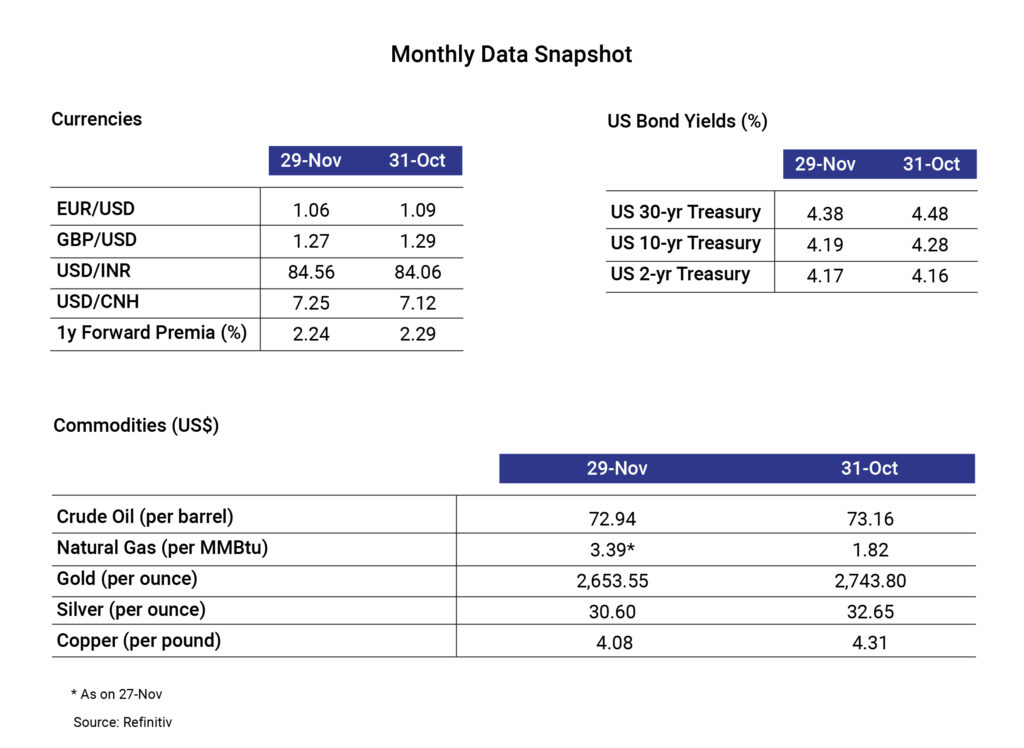
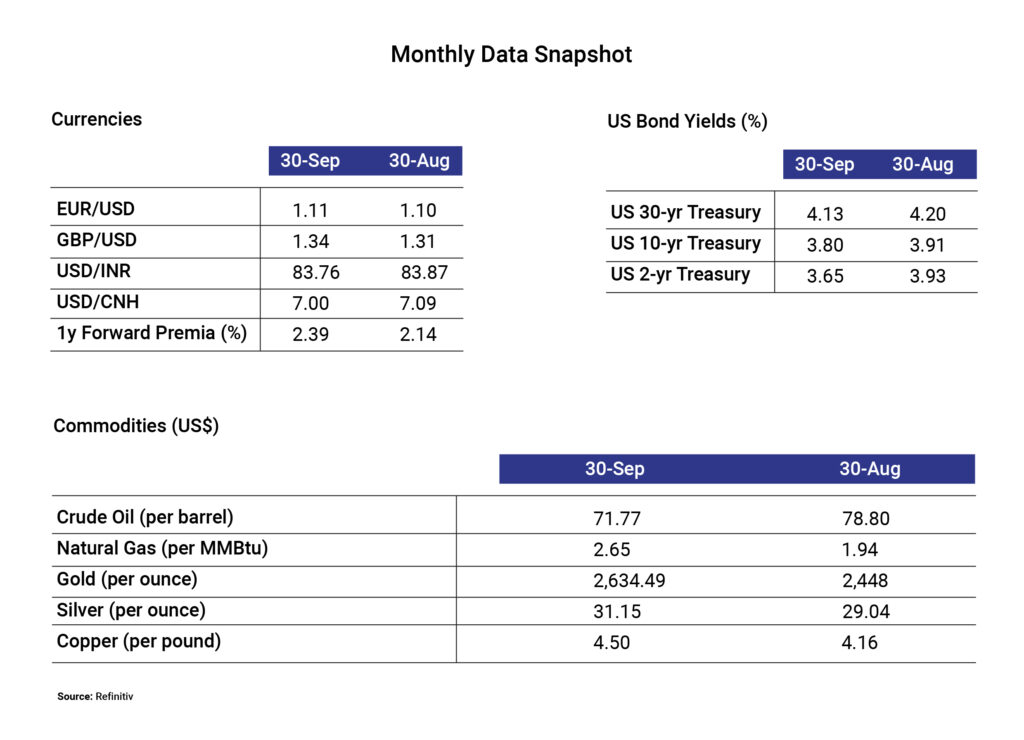
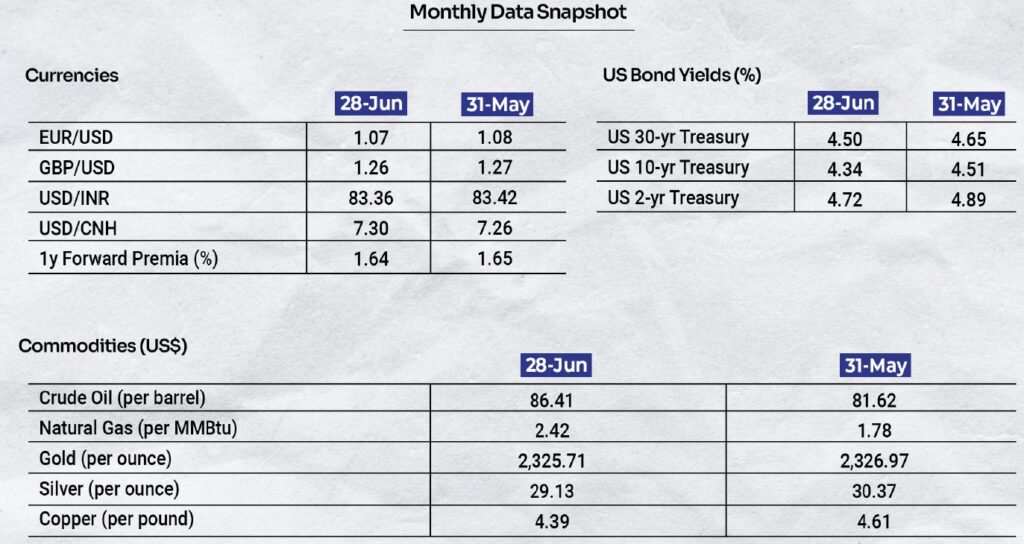
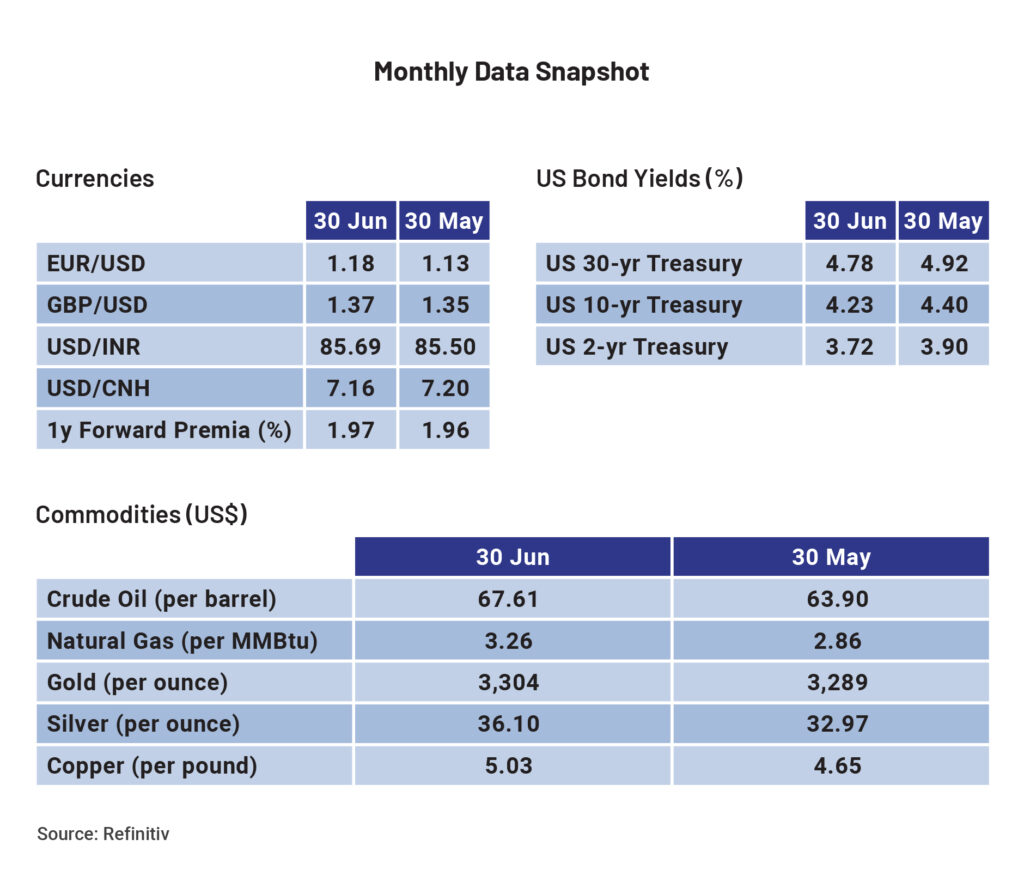
Geo-political tensions in the Middle East were the biggest concern during the month, with significant escalations between Israel and Iran, reminding markets of tensions in the 1980s. With the US striking Iran, global markets took a beating, and crude oil, in particular, saw a sharp spike as the tensions escalated, with Brent reaching about US$80. The de-escalation later through the month, with counterparts reaching an agreement, calmed the markets, with oil giving up most of its move higher.

Meanwhile, the US Fed kept the rates on hold as widely expected, with the Summary of Economic Projections leaning towards stagflation, with Personal Consumption Expenditures inflation revised higher. The Fed kept the dot plot to two cuts this year but reduced the subsequent two years by one cut each. The US consumer price inflation came in softer than expected for the month, and so far, the tariff impact on inflation has been muted for the last two months. The US Fed chair indicated that some impact would be inevitable over time. President Trump continued to push for lower rates, and rhetoric around tariffs continued, with early signs of deals with a few nations. Elsewhere, the European Central Bank cut rates by 25 basis points (bps) along expected lines, taking the cumulative cut since mid-2024 to 200 bps, the Swiss National Bank reduced the rates to zero, while the Bank of England kept them on hold.

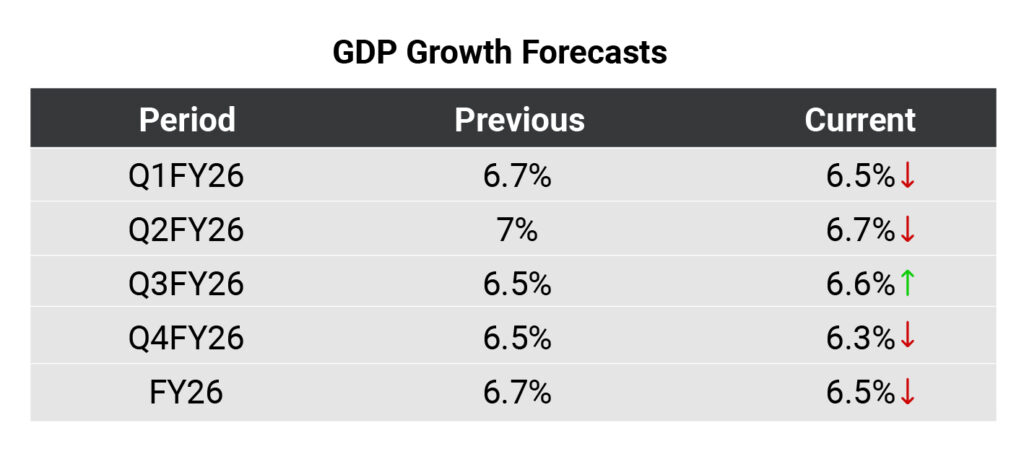
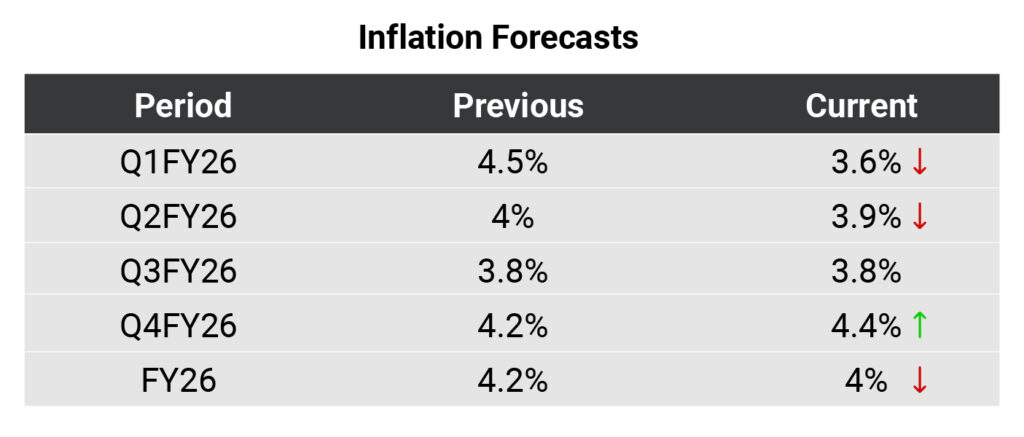
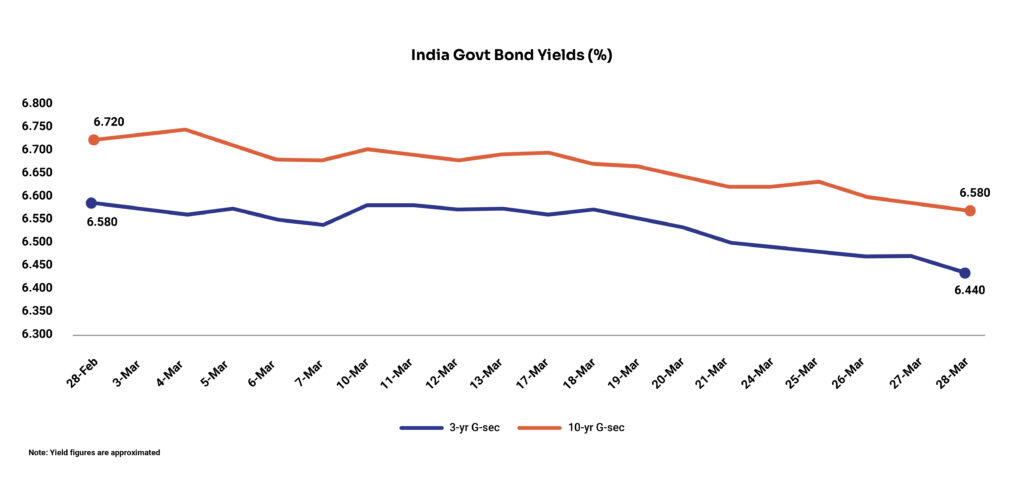
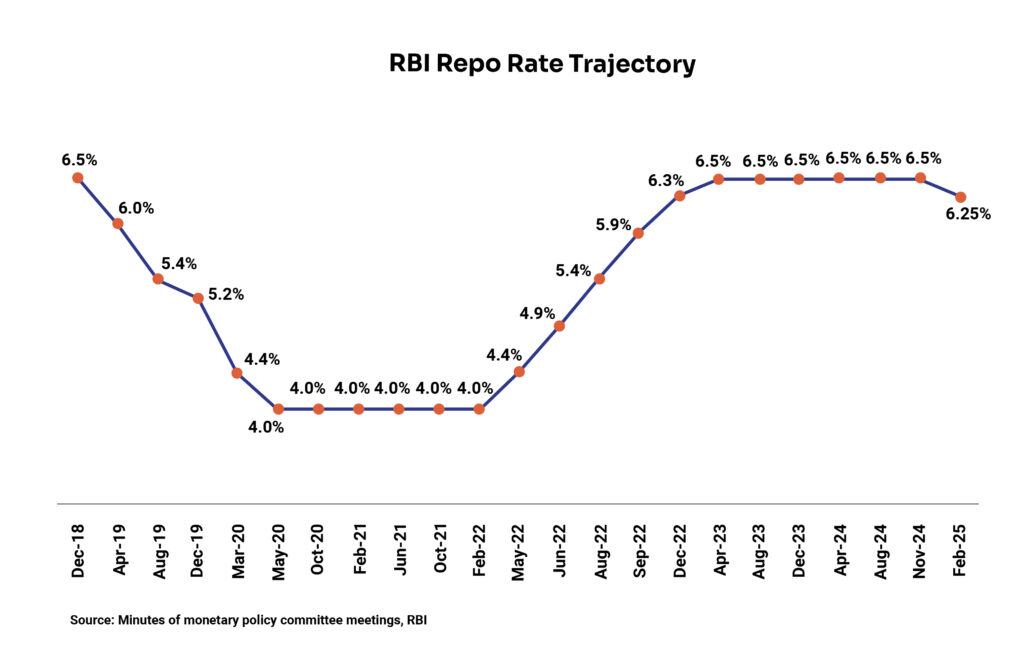
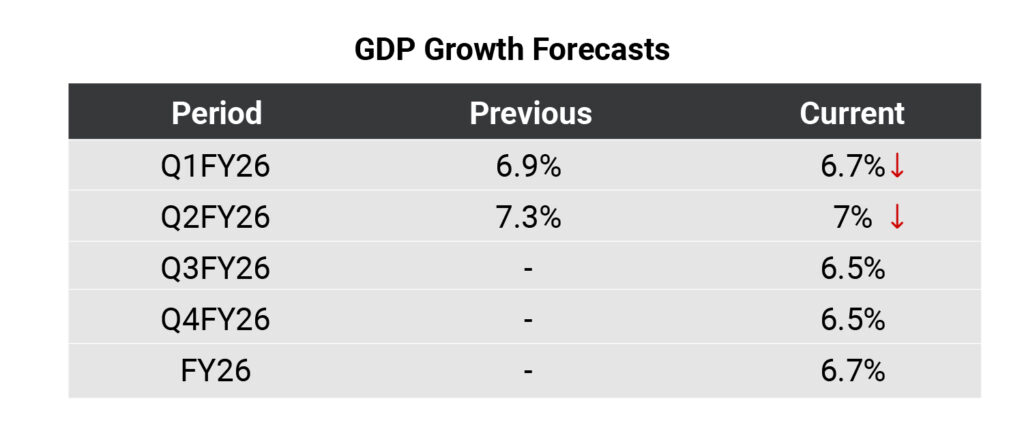
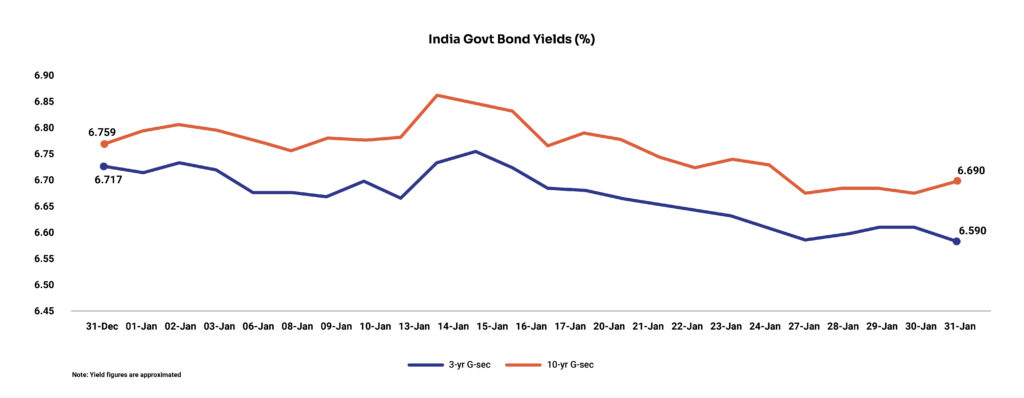
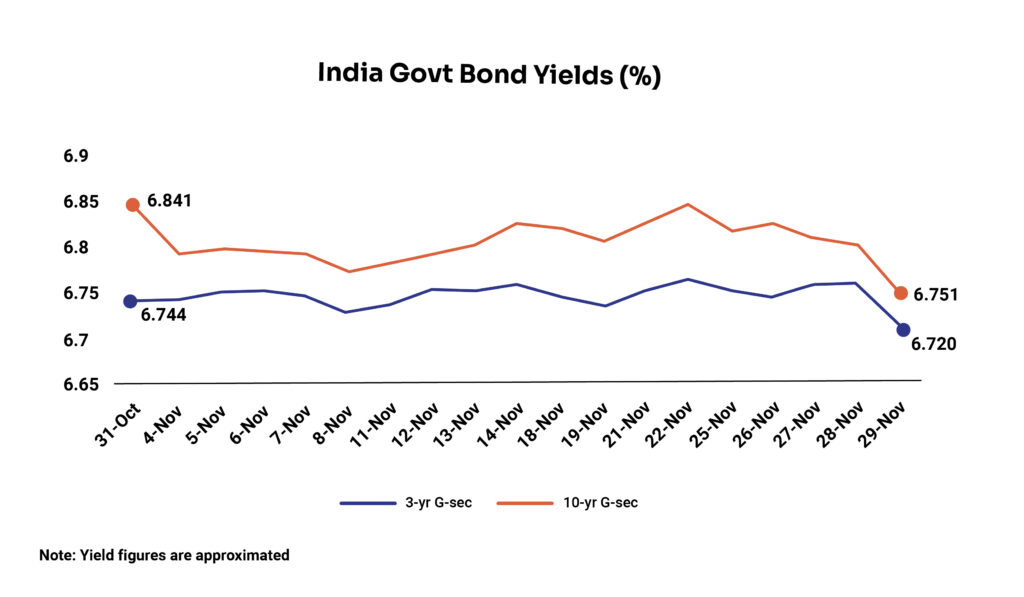
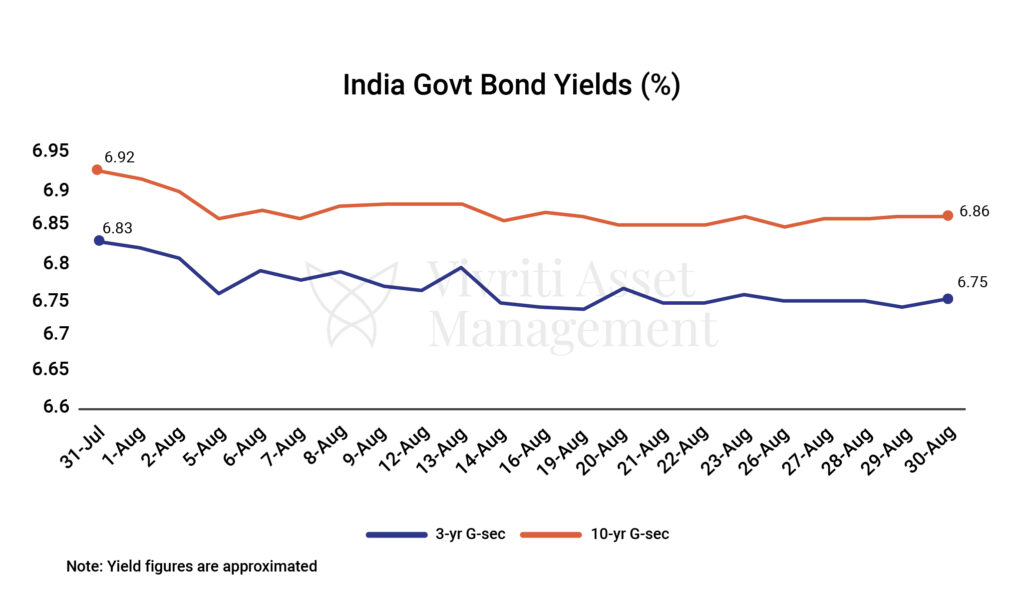
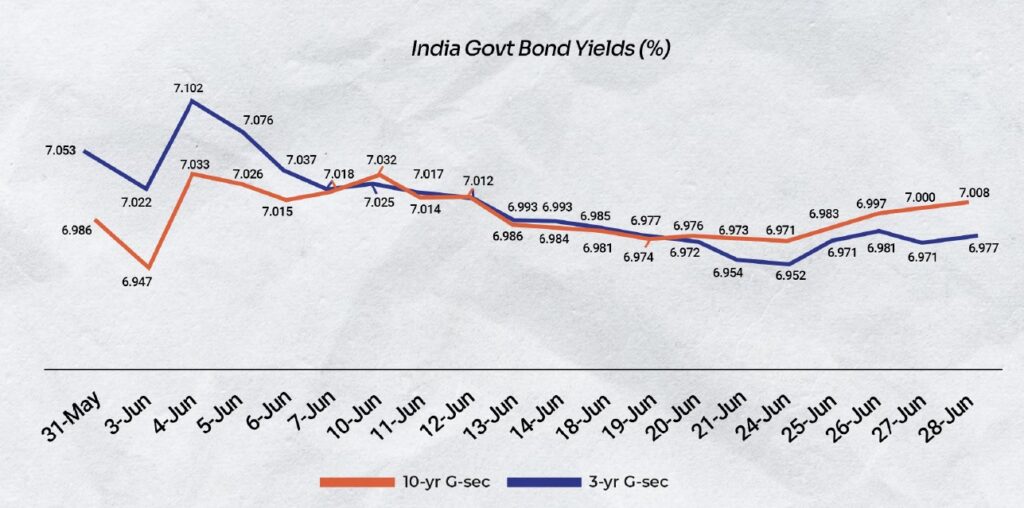
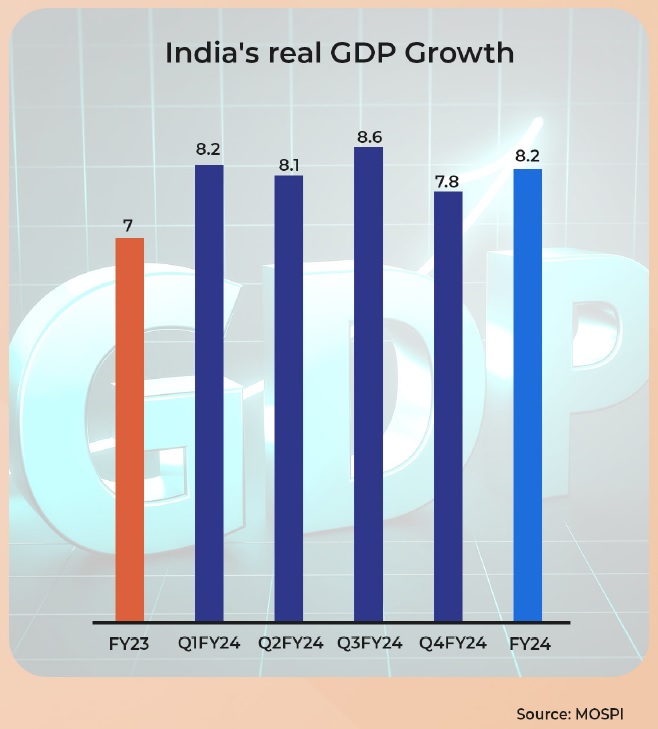
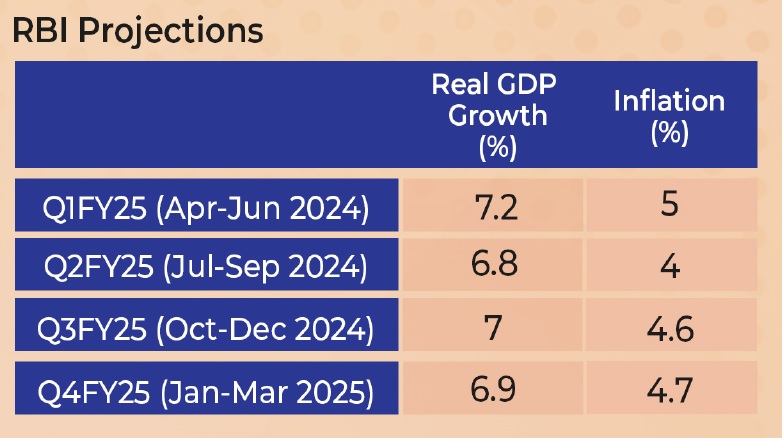
On the domestic front, a surprise policy outcome by the RBI, where they front-loaded cuts by reducing repo rates by 50 bps with a 5-1 majority, against the broader consensus estimate of 25 bps. The Monetary Policy Committee (MPC) also cut the cash reserve ratio (CRR) by 100 bps to 3%, infusing about INR 2.5 lakh crore liquidity in a staggered manner, thereby focusing on monetary transmission to boost growth. Finally, the MPC changed the stance to neutral, indicating that the future decision will be data-driven and the bar to reduce further will be high. Barring any significant data surprises, we believe the MPC stays on an extended pause from here. RBI kept the growth rate forecast unchanged at 6.5% while reducing the inflation forecast to 3.7% for FY26. Markets reacted with a steeper curve, with front-end rallying on the back of a larger-than-expected cut.

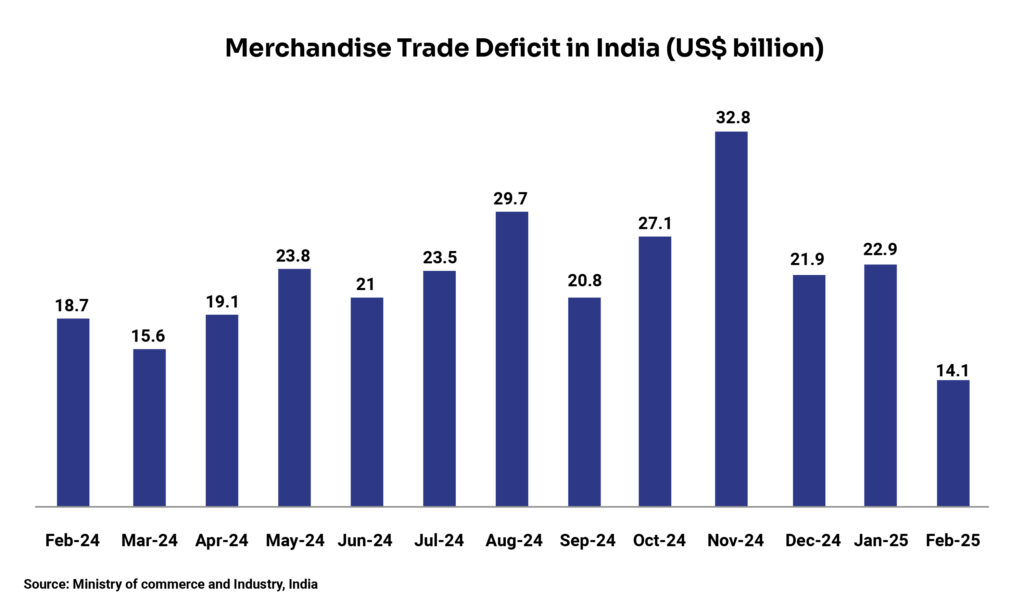
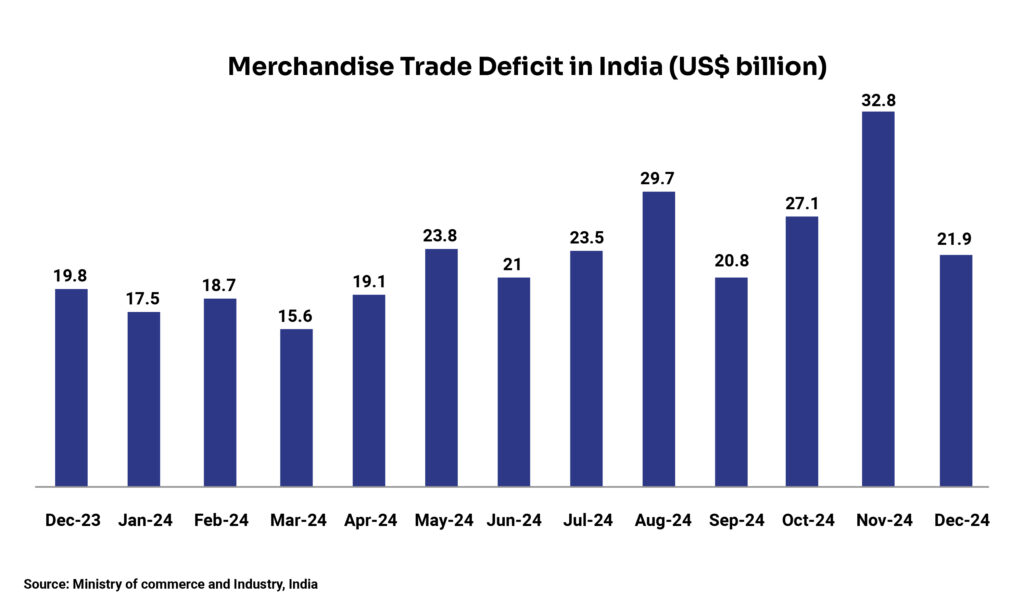
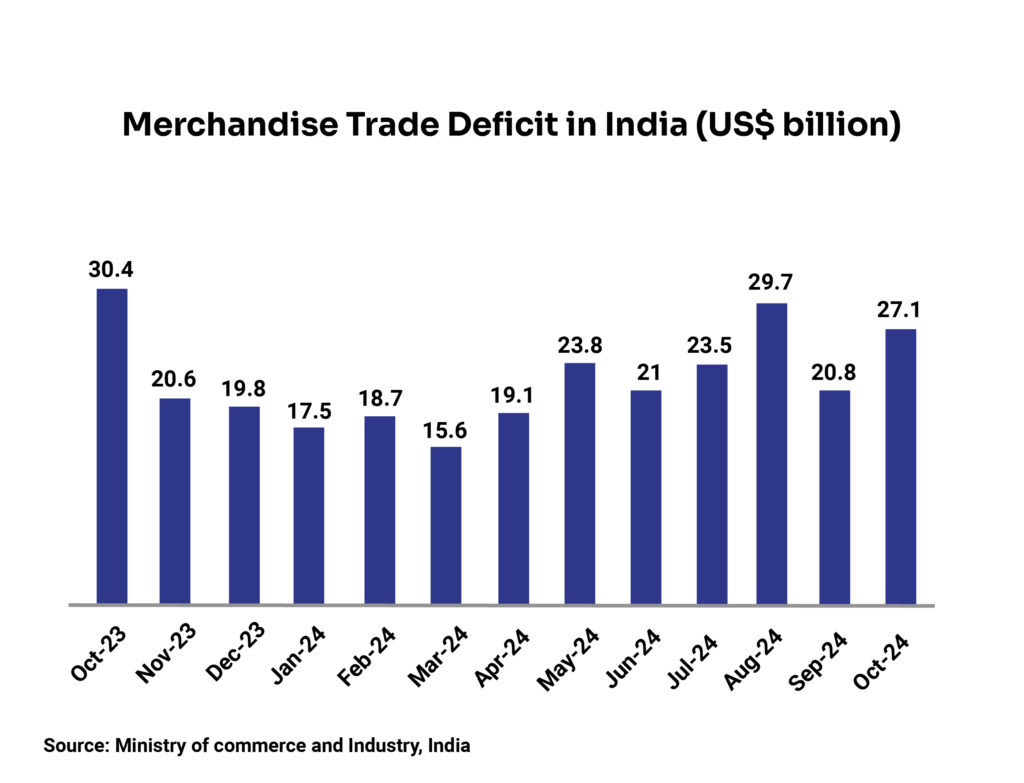
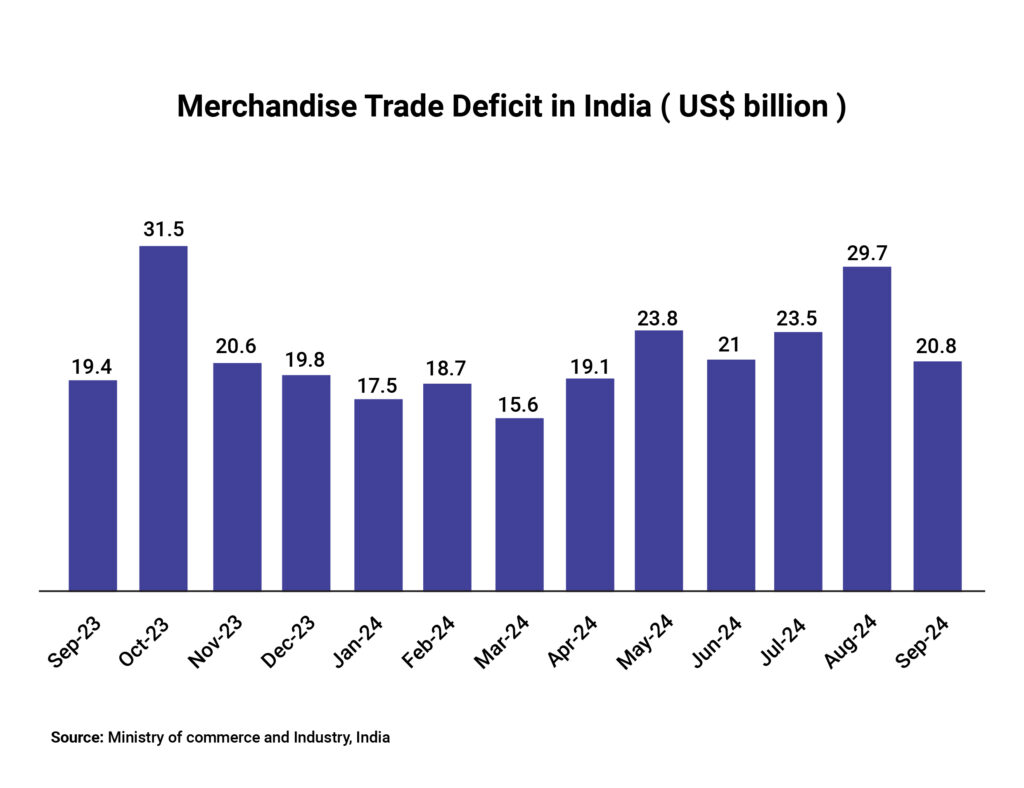
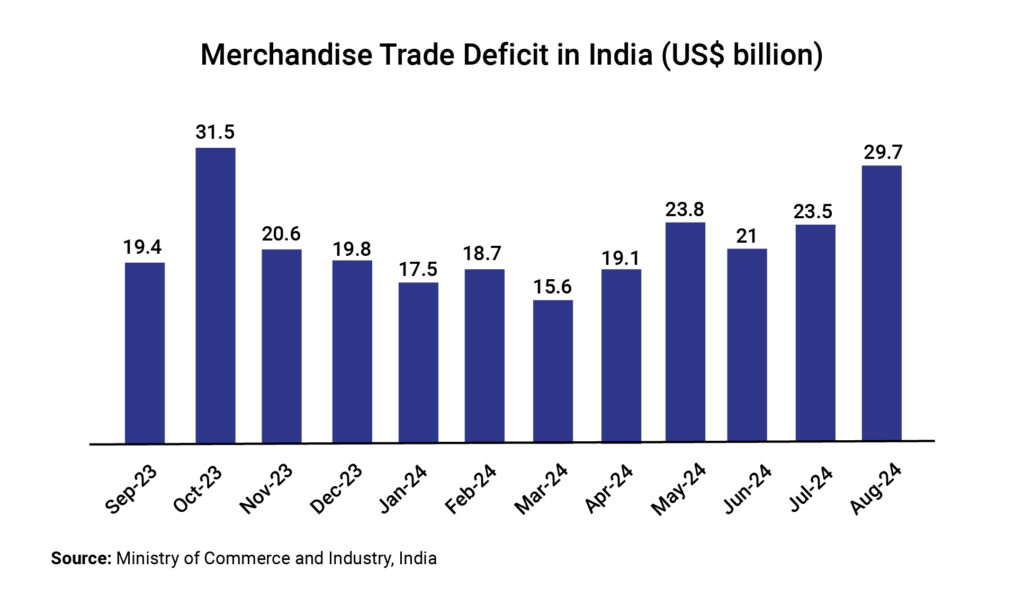
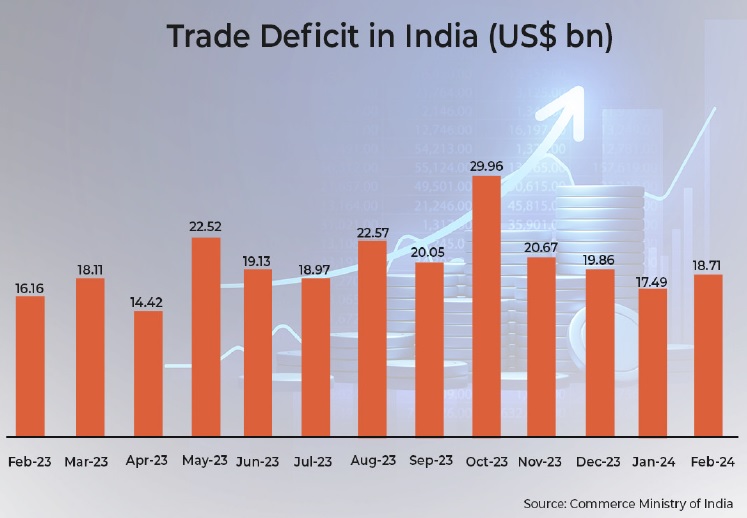
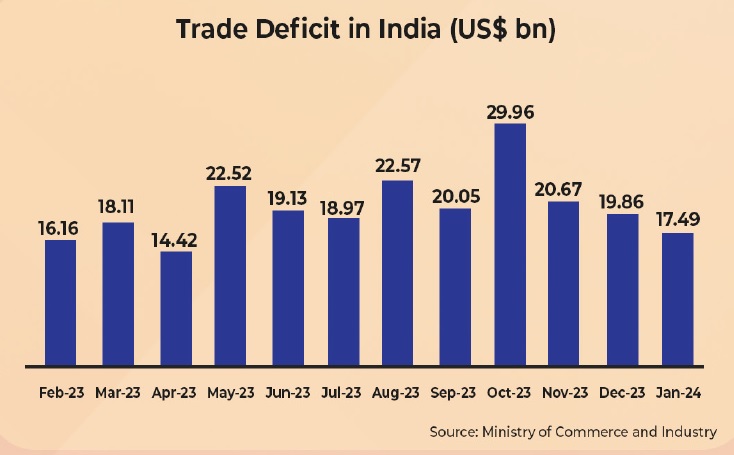
Among other data points, inflation surprisingly eased to a six-year low of 2.82% led mainly by food prices. The trade deficit also narrowed to US$21.9bn in May from US$26.4bn in April, led by a contraction in imports. On the currency front, INR took a beating on the back of geo-political tensions and subsequent oil spike during the month, but stabilized on de-escalation, with foreign exchange reserves restoring to around $700bn.

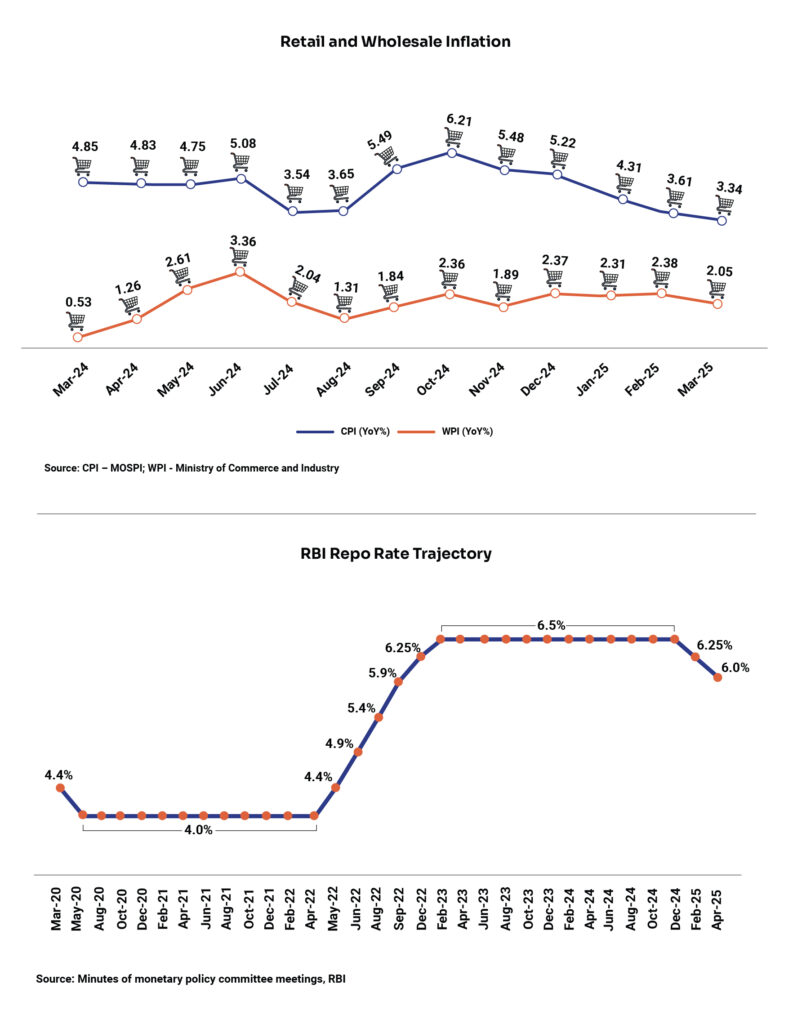
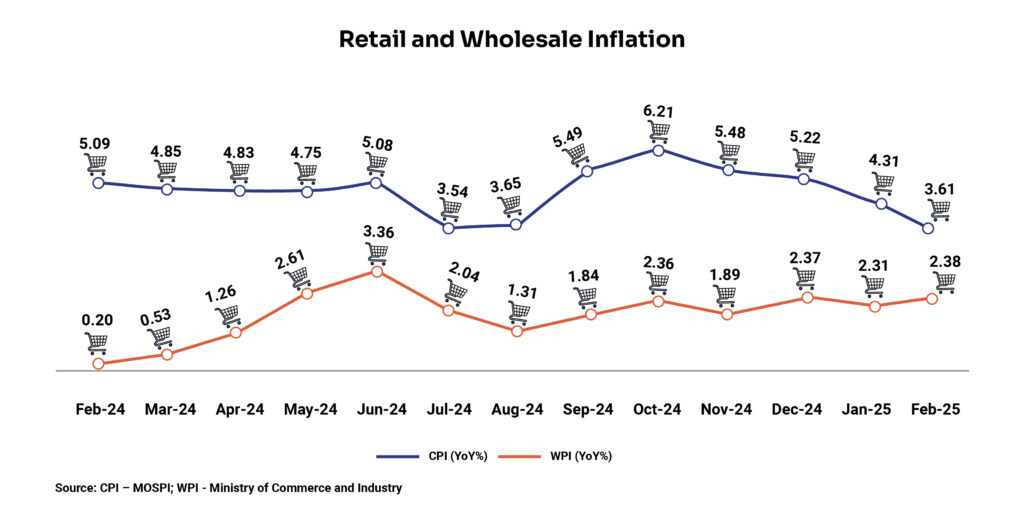
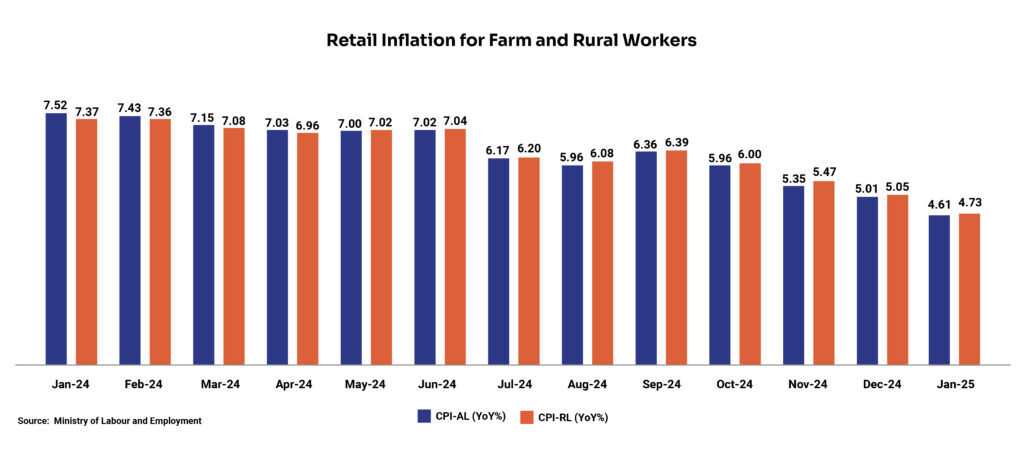
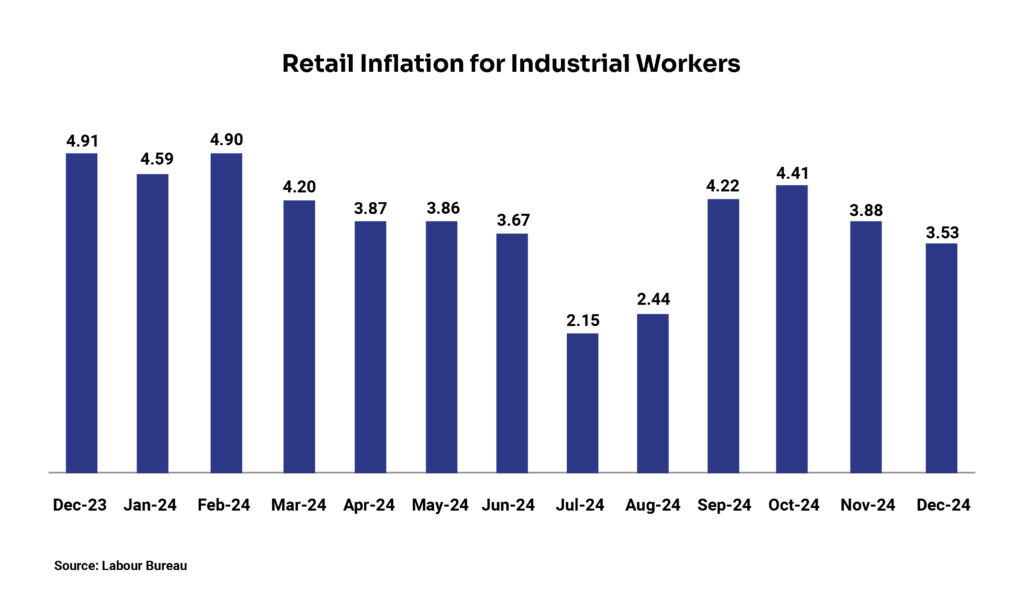
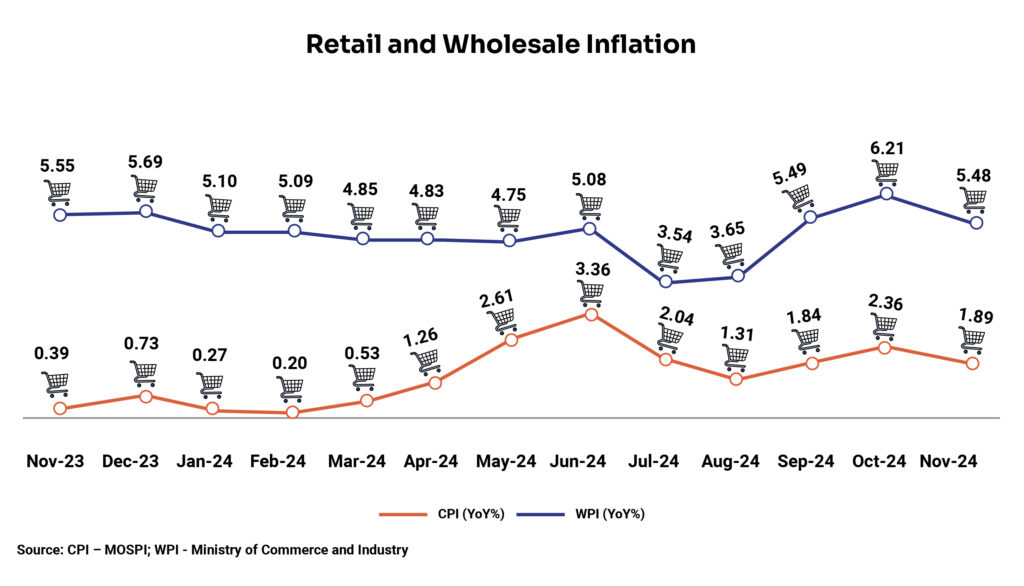
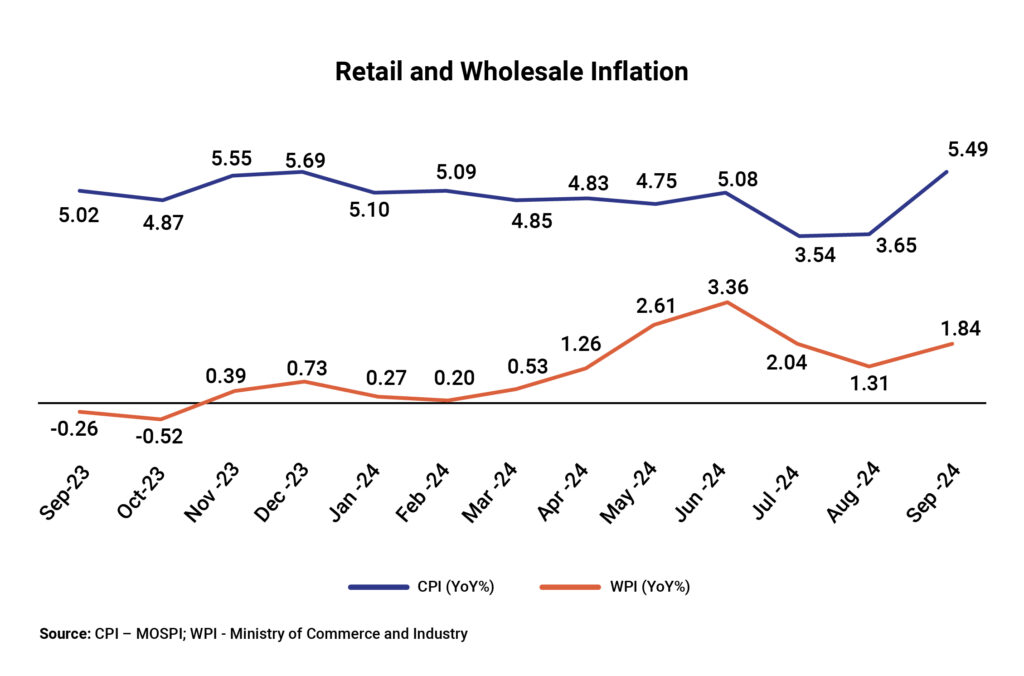
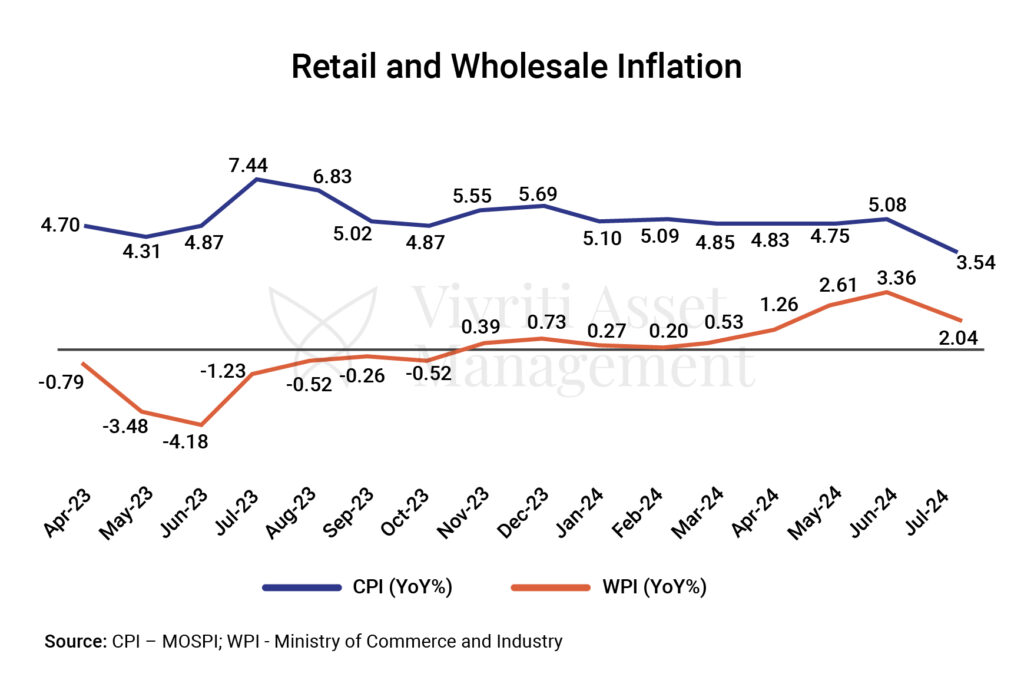
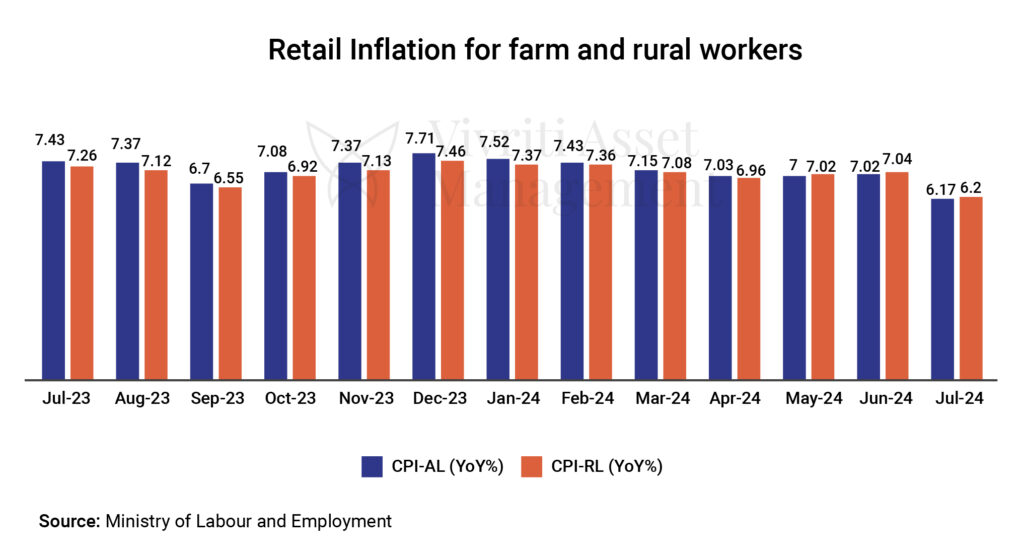
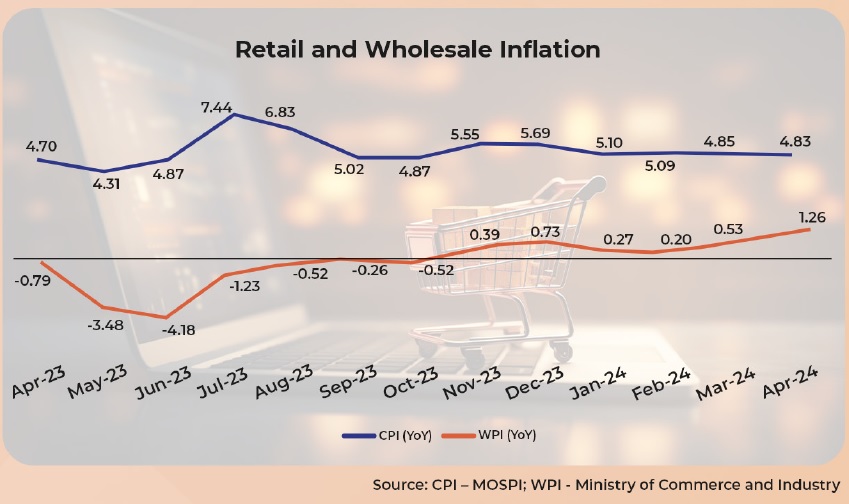
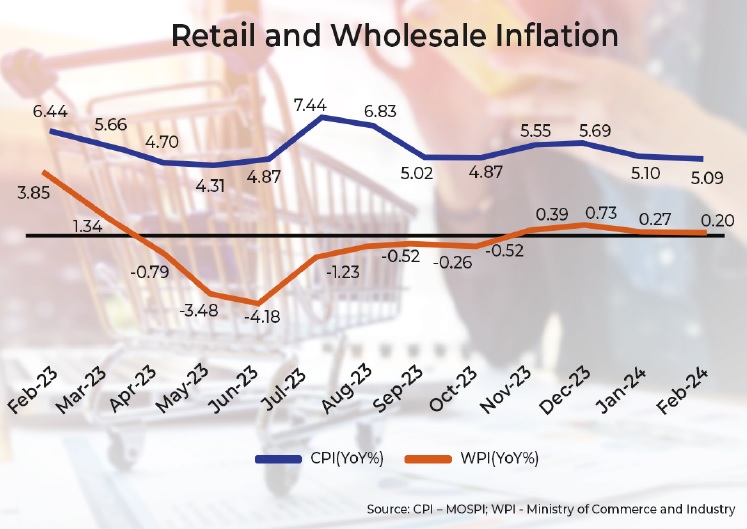
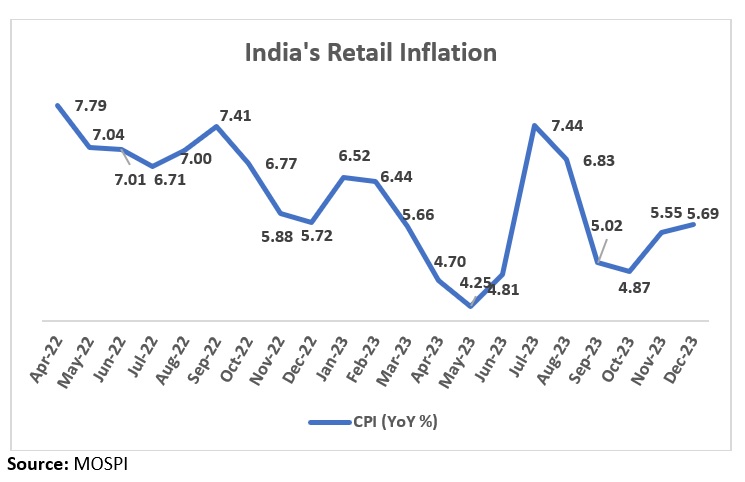
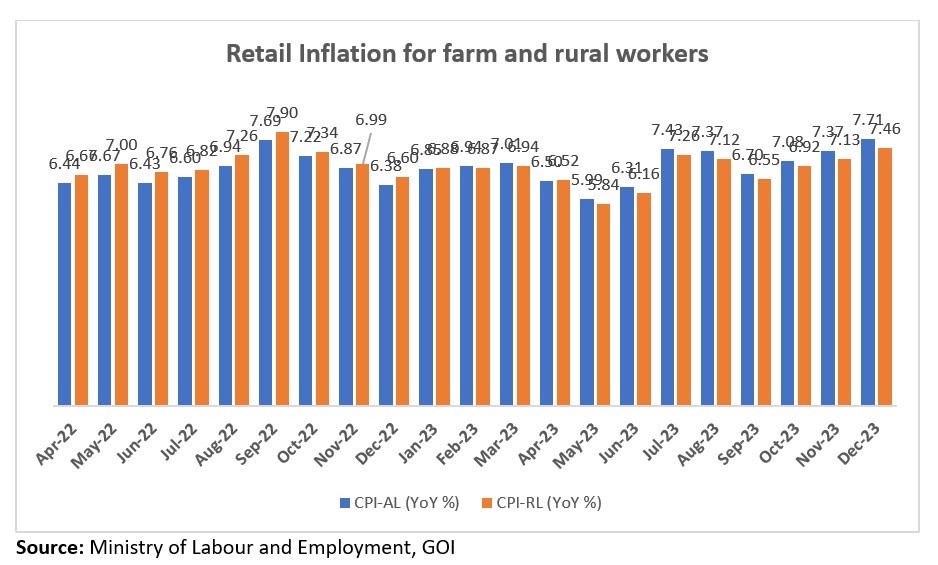
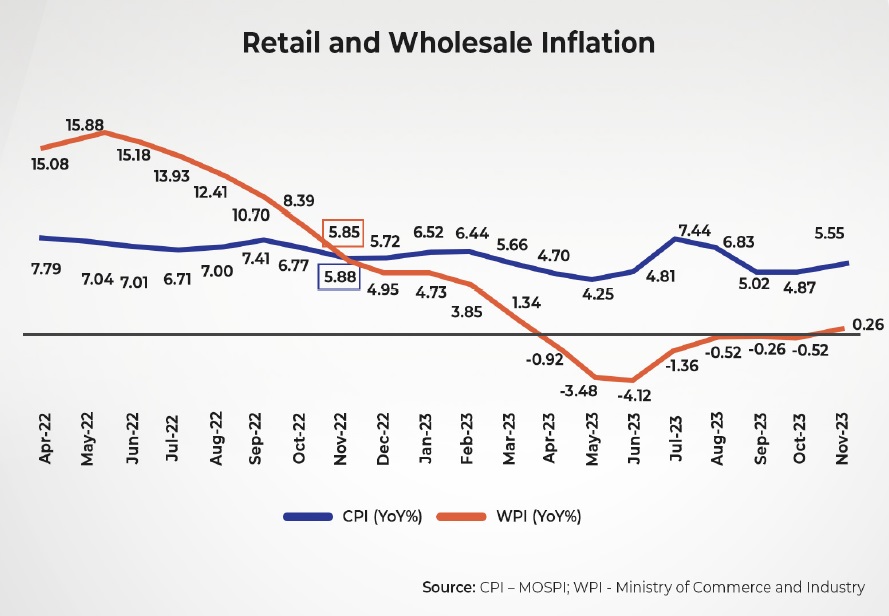
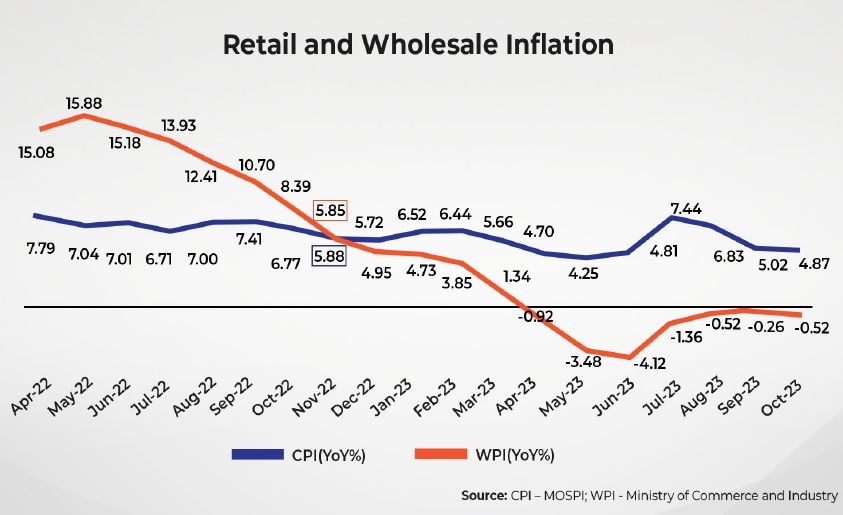
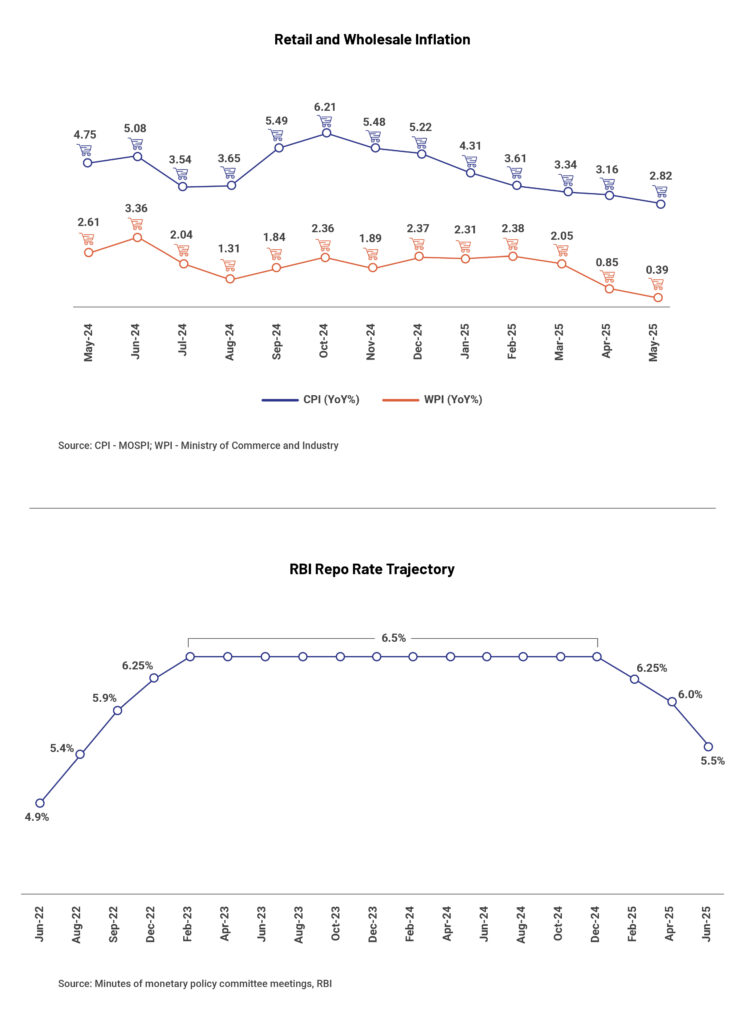
Retail inflation slips below 3% to a 6-year low; RBI announces the steepest repo rate cut in CY25

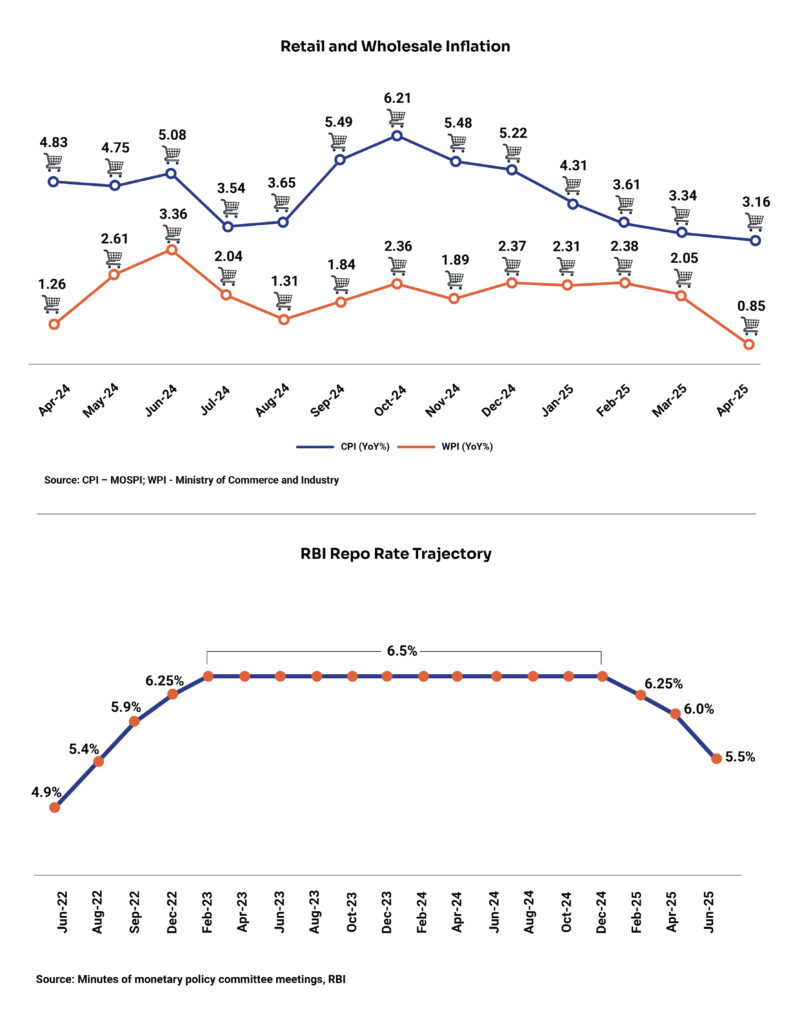
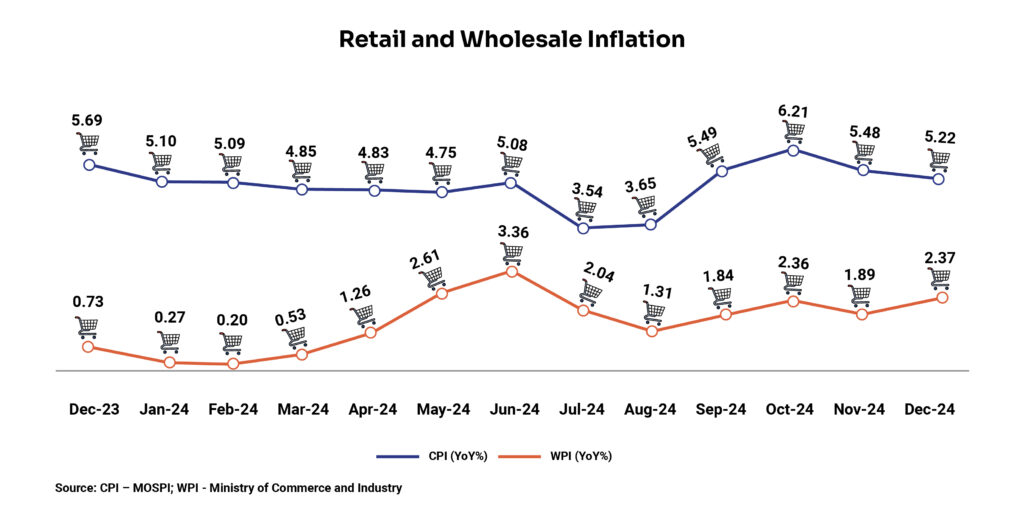
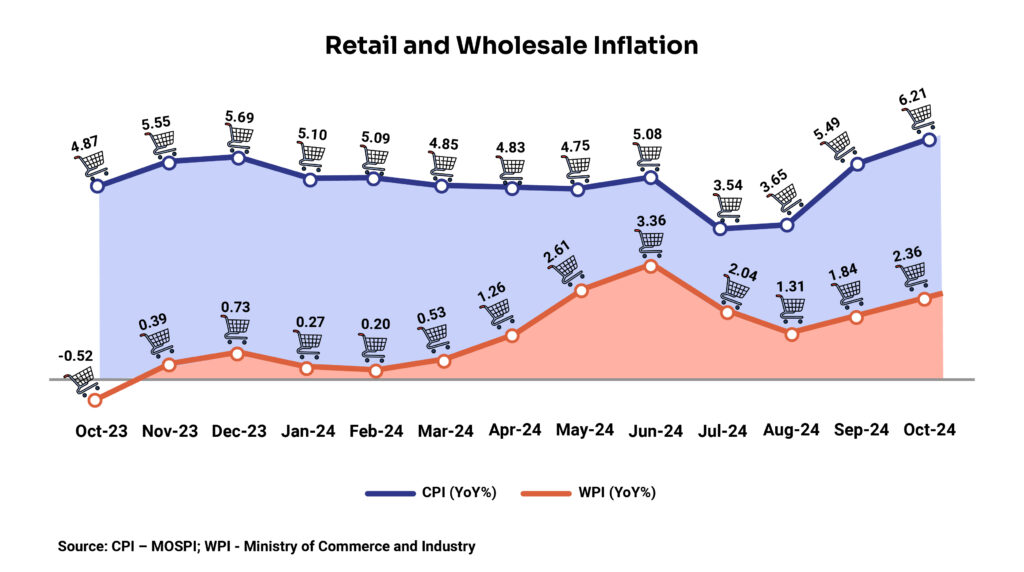
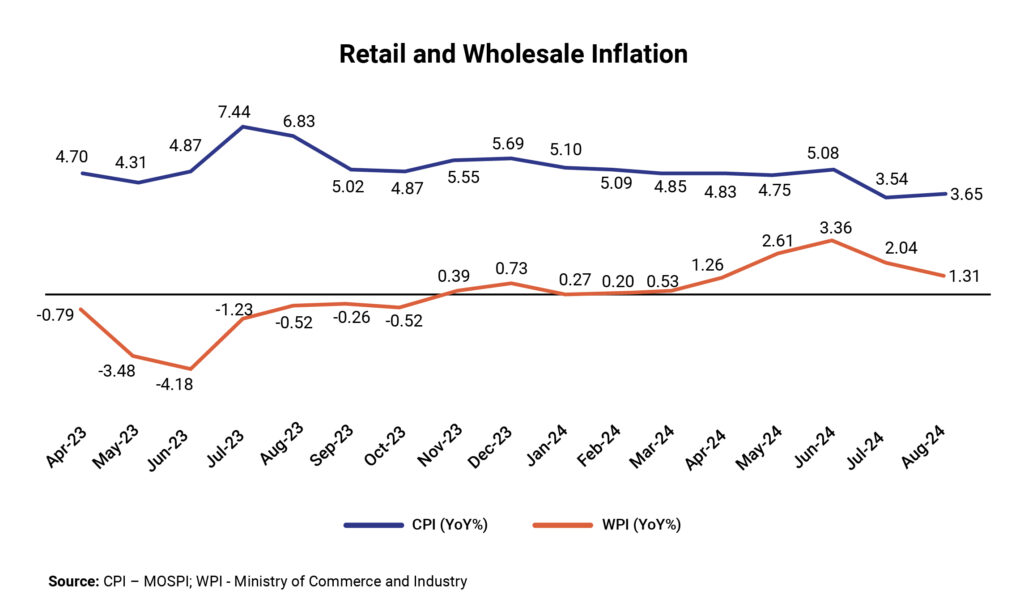
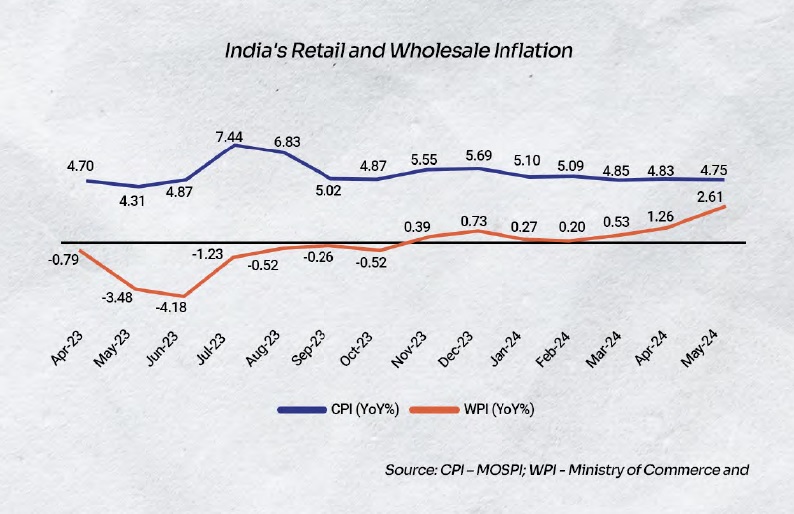
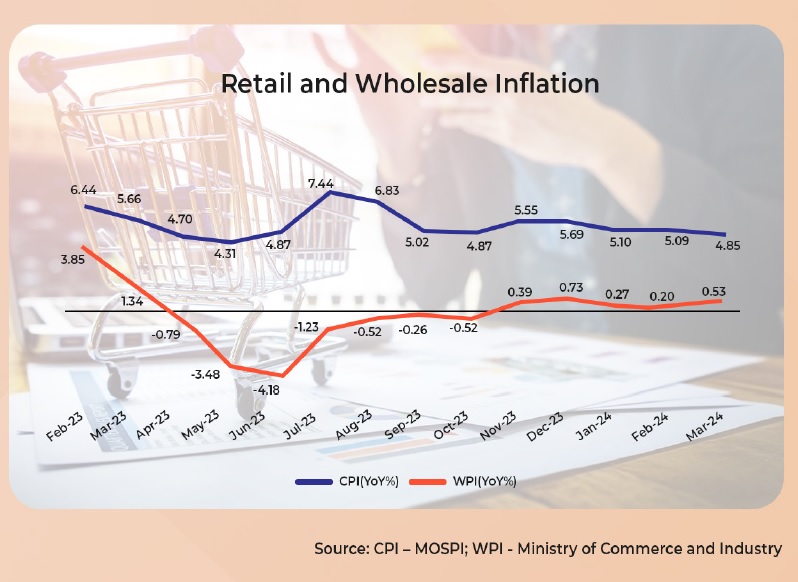
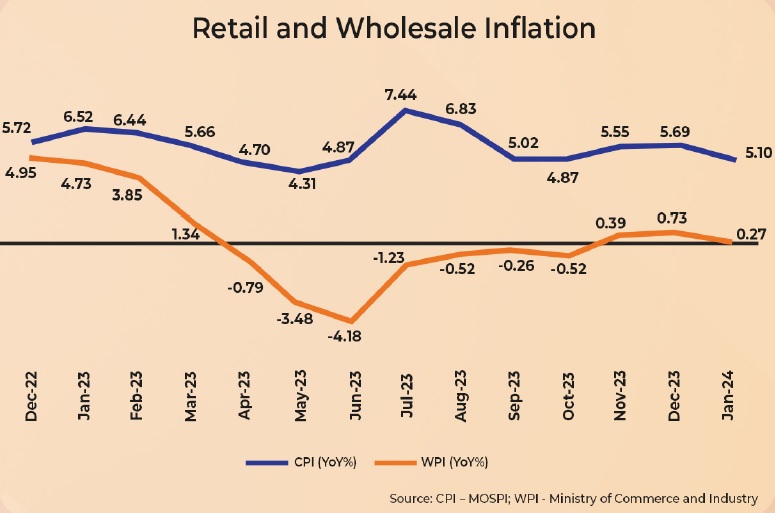
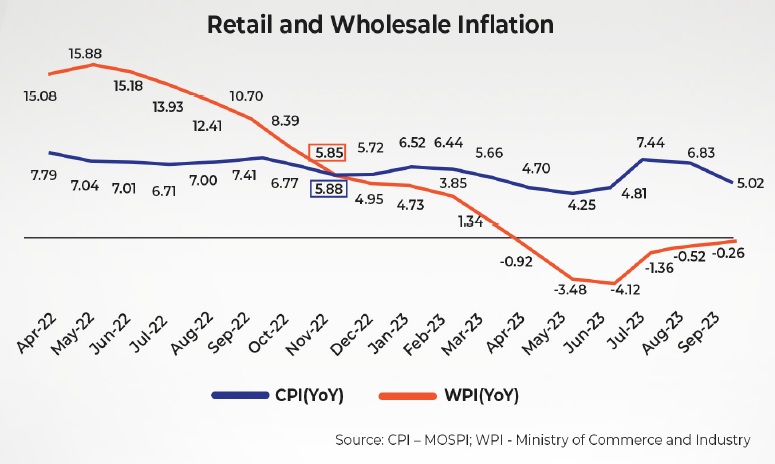
India’s retail inflation, which is measured by the consumer price index (CPI), eased to over 6-year low of 2.82% YoY in May (lowest since February 2019) reflecting 34 bps MoM fall from 3.16% in April. The fall is attributed to food inflation, which dropped to a near 4-year low of 0.99% YoY in May. Within the food basket, vegetables inflation fell 13.7% YoY, the lowest in over 2 years followed by pulses which moderated to 8.2% YoY during the month. However, core inflation, which excludes volatile food and energy prices and is seen as a reliable indicator of domestic demand, slightly inched up to 4.2% YoY in May from 4.1% YoY in April.

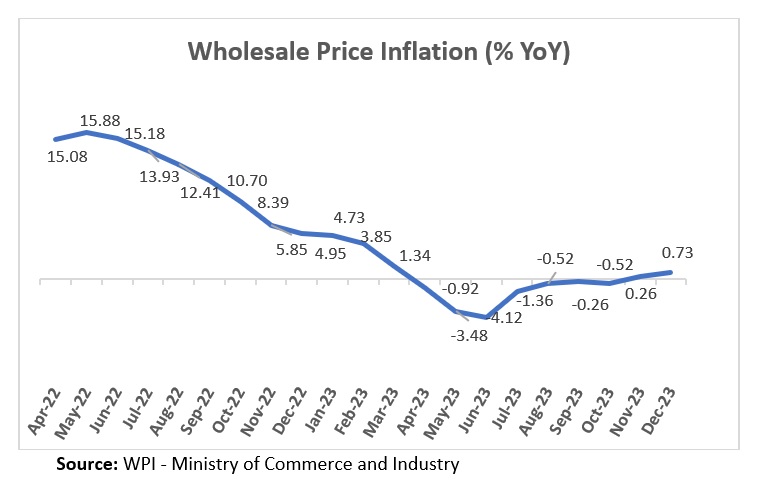
The wholesale inflation continued its downward trajectory, falling to a 14-month low of 0.39% YoY in May. The decline is led by lower food and fuel prices. Core inflation moderated to 0.8% YoY in May from 1.57% in April.

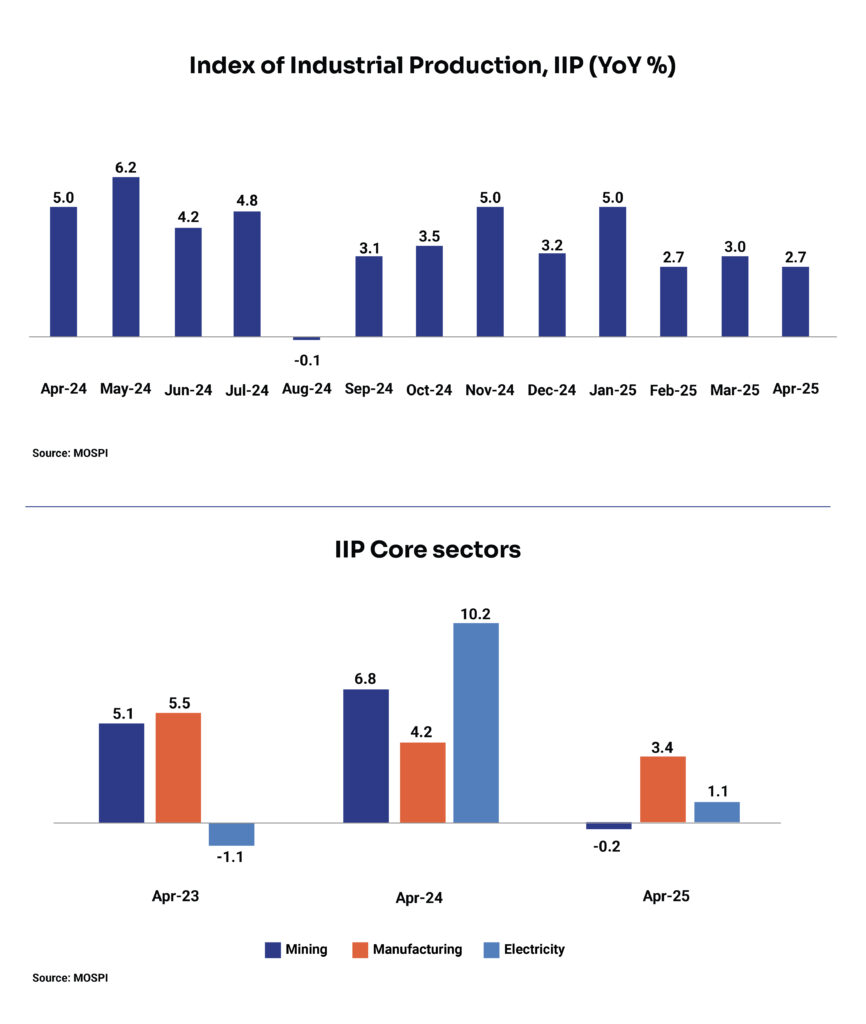
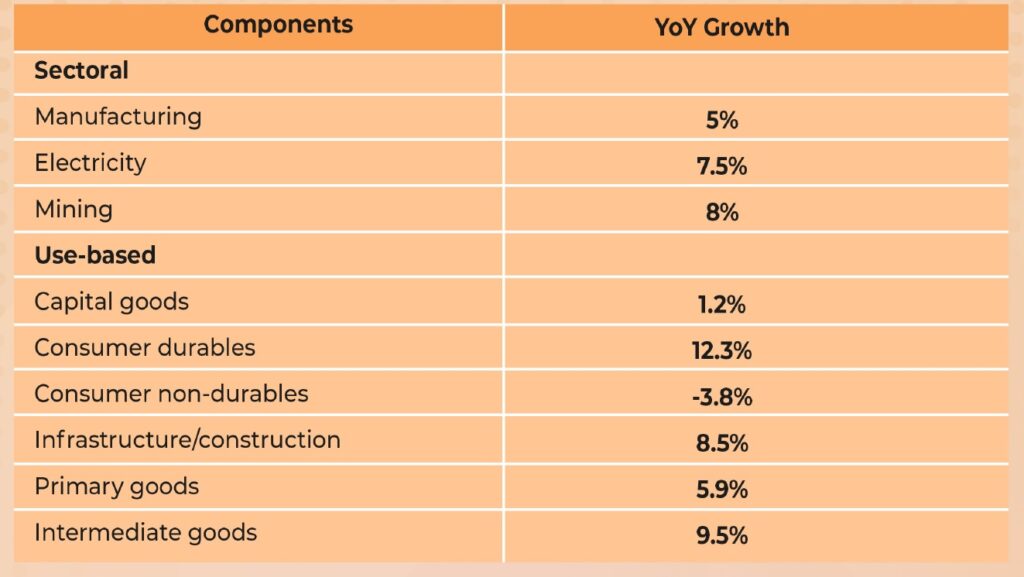
Inflation in manufactured products, the largest component in the overall basket, eased to a 7-month low of 2.04% YoY in May followed by inflation for primary articles which contracted to a 23-month low of 2.02% YoY during the month. The decline is driven by a fall in prices of vegetables, pulses, potatoes, onions and protein-rich items such as eggs, meat, and fish. Within the primary articles index, prices for minerals declined sharply to 0.44% in May versus 9.69% in April. The fuel & power category recorded a deflation of 2.27% YoY in May driven by a decline in prices of mineral oil. In contrast, prices of electricity and coal increased during the month.

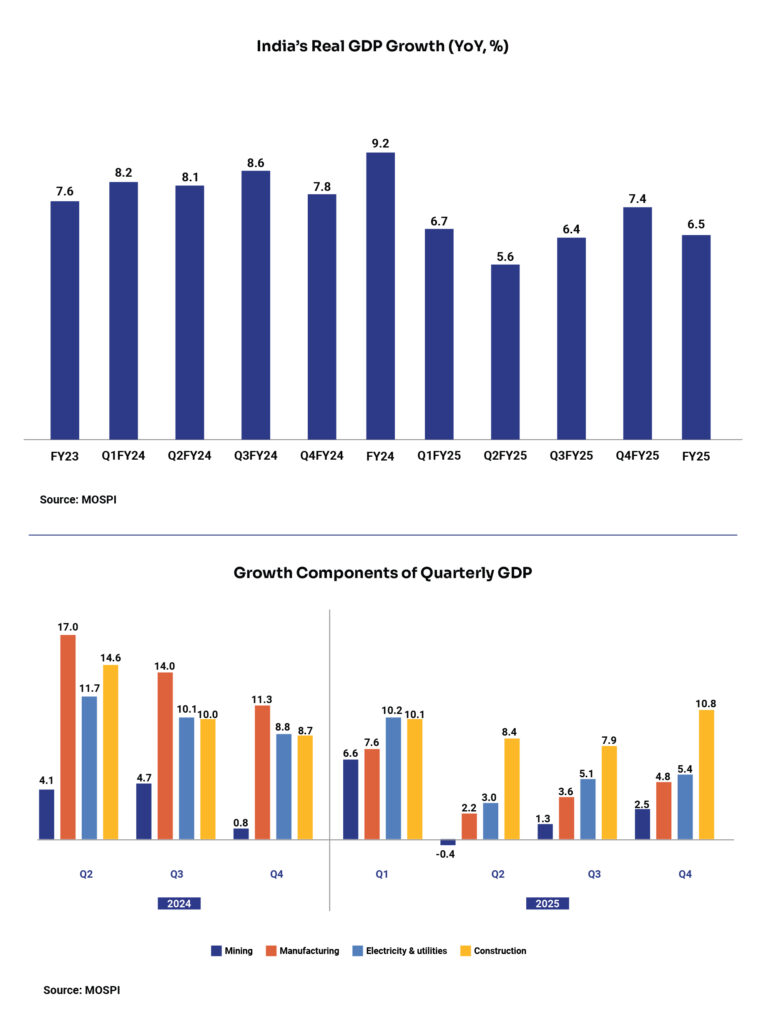
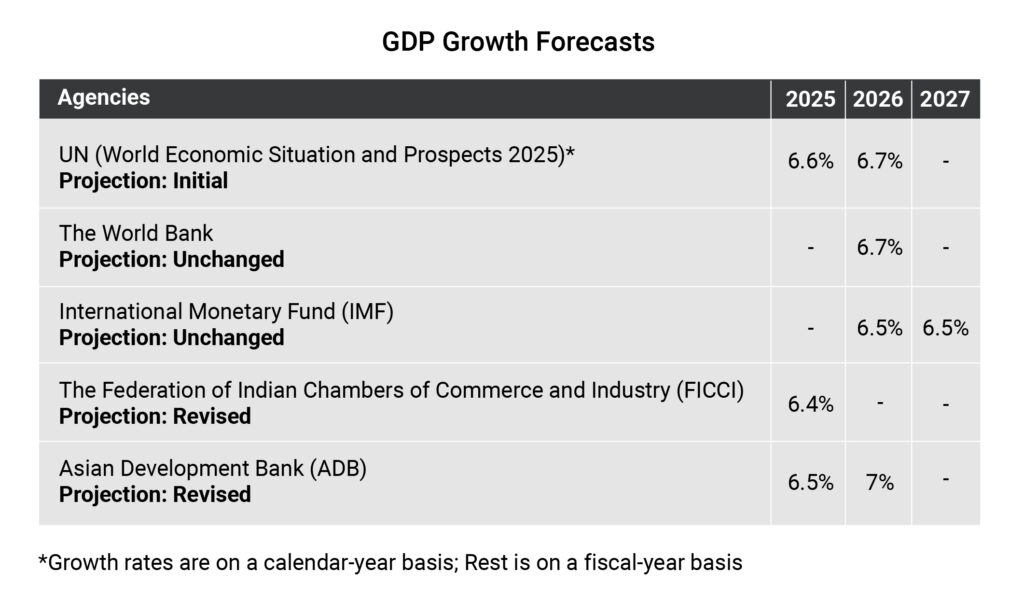
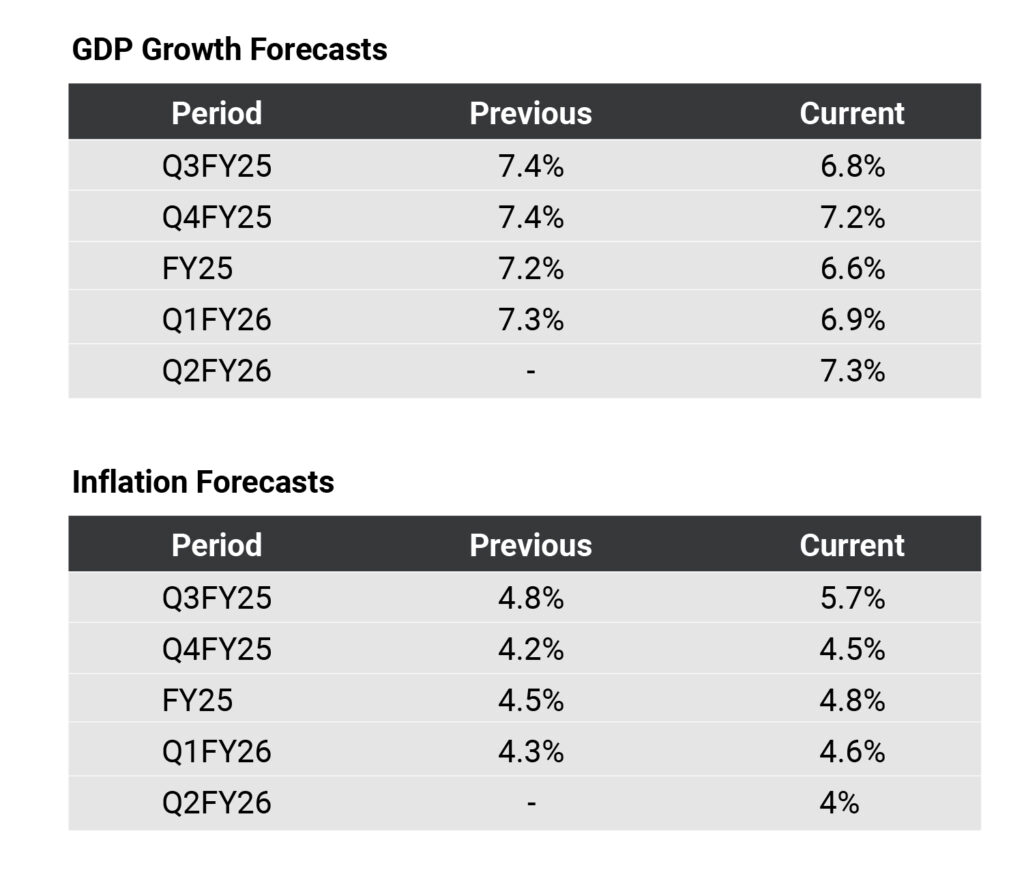
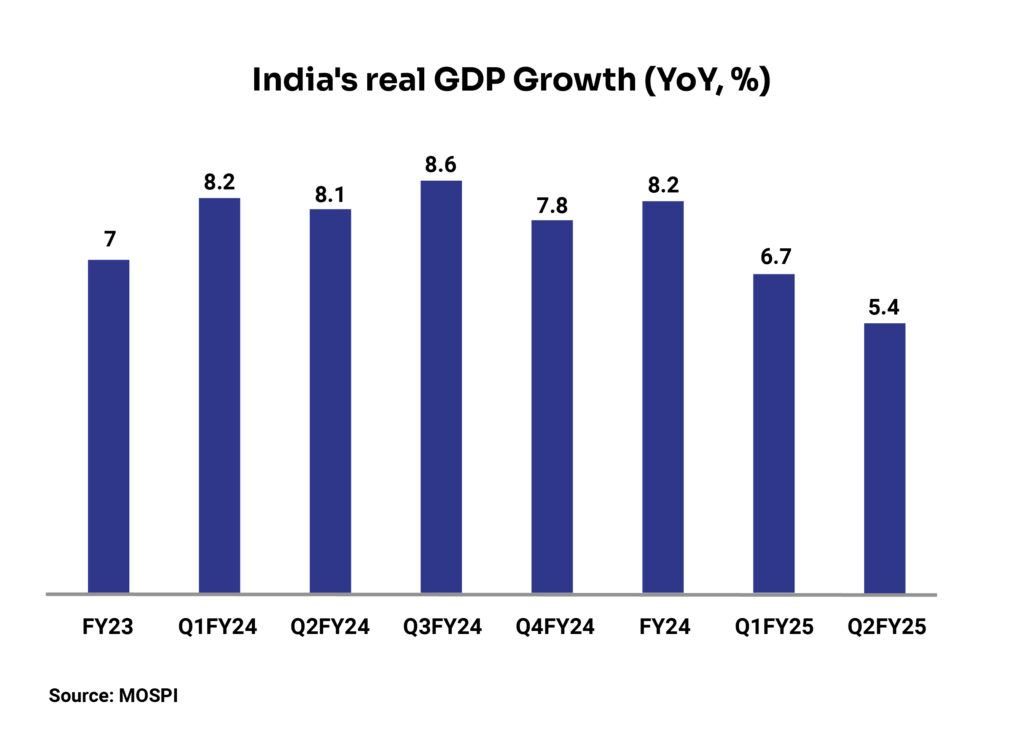
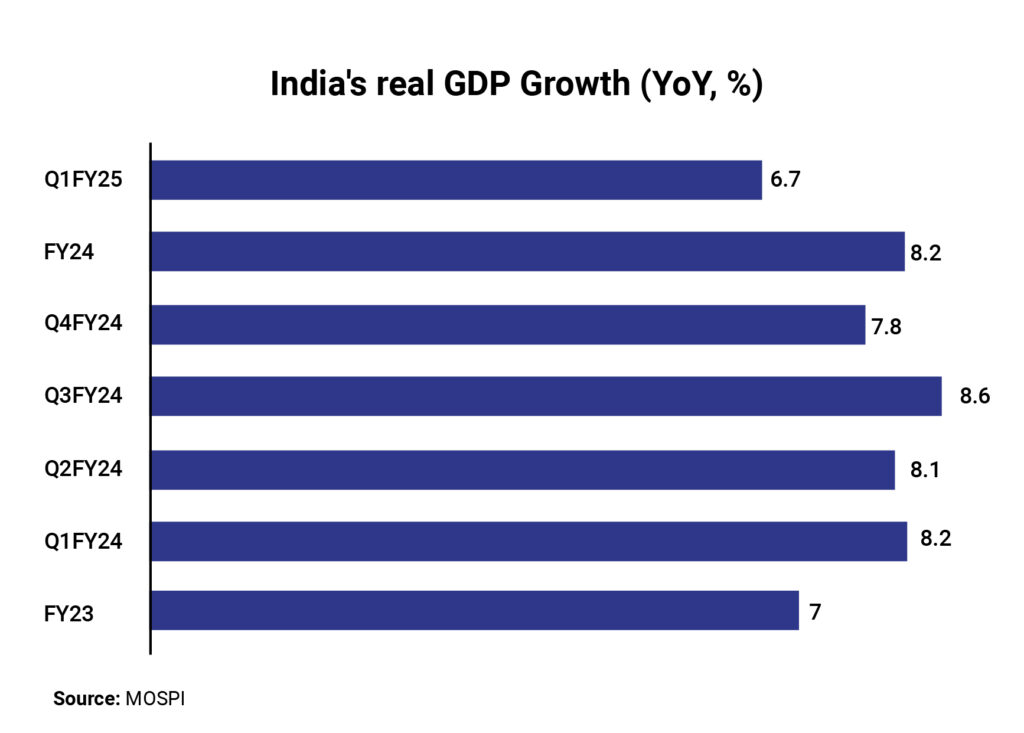
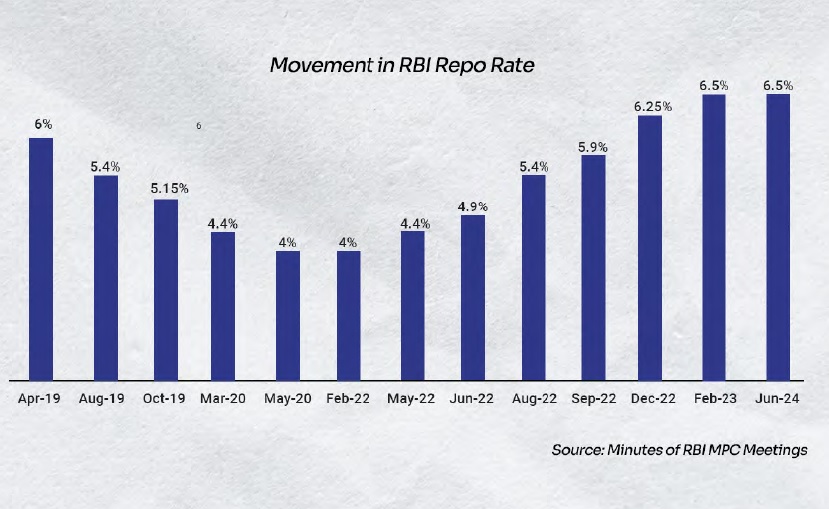
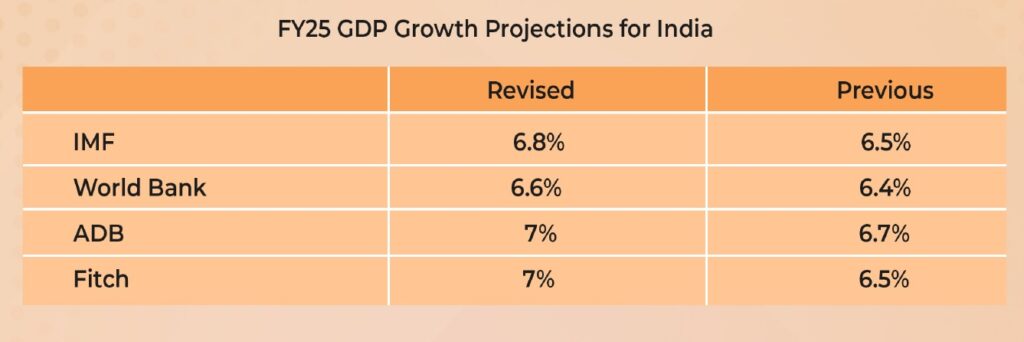
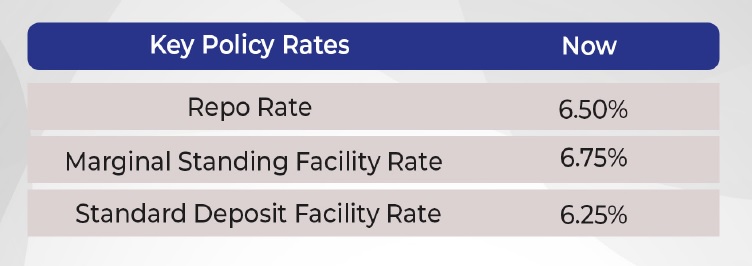
Amid the steady decline in inflation, RBI has reduced the repo rate by 50 basis points (bps), the third consecutive rate cut in CY25, to 5.5%. This rate cut has been the sharpest since the 75-bps reduction during Covid-19 in March 2020. With limited room for further rate cuts, the RBI has changed its monetary policy stance from accommodative to neutral. While external challenges like geopolitical tensions and trade policy shifts remain, RBI has retained India’s growth projection for FY26 at 6.5%.

India’s net foreign direct investment inflows hit record low in FY25

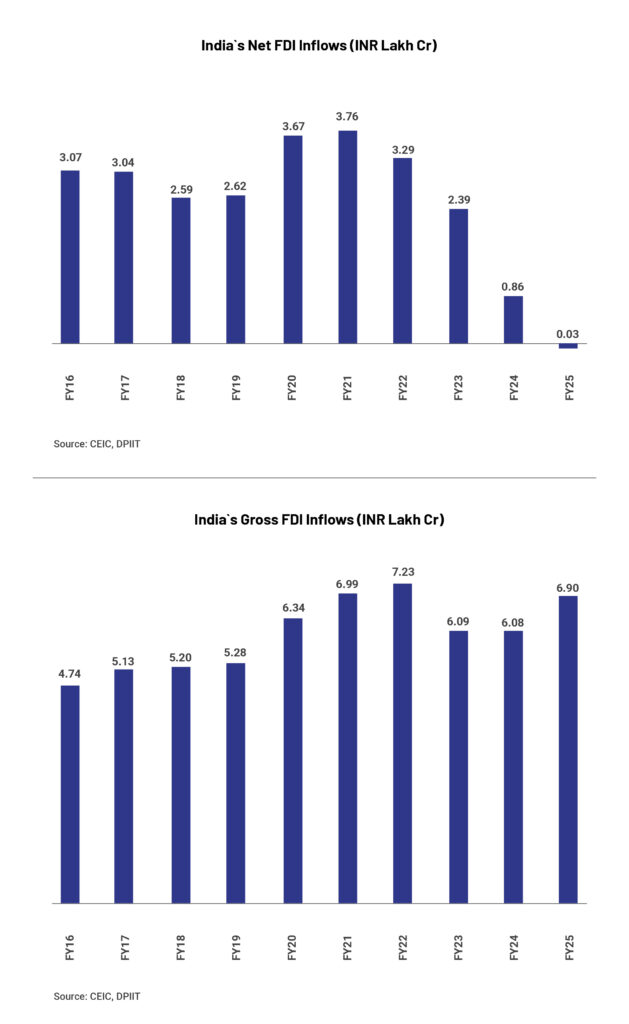
Net foreign direct investment (FDI) inflows into India plummeted 96.5% YoY to an all-time low of US$353 million (~INR 3026 crore) in FY25 from US$10 billion (~INR 86,000 crore) in FY24. The decline in net FDI inflow – calculated by subtracting repatriation and net FDI outflow from gross FDI inflow – happened despite a strong uptick in gross FDI inflow. The decline can be linked to large scale exits by foreign entities trigged by IPOs of large-scale companies such as Hyundai Motor India and Swiggy, among others.

Net FDI outflow grew 75% YoY to US$29.2 billion (INR 2.49 lakh crore) in FY25. Singapore, US, UAE, Mauritius, and the Netherlands together accounted for over 50% of the outflow. Repatriations and disinvestment rose by 15.7% to US$51.5 billion (INR 4.4 lakh crore) in FY25. Economists believe that the moderation in net FDI inflows is not a sign of weakness but is evidence of a mature market enabling the foreign players to enter and exit smoothly.

Gross inward FDI stood at a 4-year high of US$81 billion (INR 6.9 lakh crore) in FY25, as per RBI data. Sectors such as manufacturing, financial services, electricity and energy, and communication services together accounted for ~60% of the inflows. This highlights that India still holds the potential of an attractive investment destination. Furthermore, improving the ease of doing business and strengthening regulatory policies can aid in attracting foreign investment in India.

RBI Financial Stability Report Bank indicates resilient credit growth among NBFCs

The Reserve Bank of India’s bi-annual Financial Stability Report indicated deceleration in credit growth but improvement in asset quality in the banking sector at the last financial year end. For NBFCs, credit growth improved while asset quality remained improved in the same period. However, the central bank flagged concerns in the financial markets due to volatility in government bond markets, driven by dynamic policy and geopolitical environment.

The credit growth of scheduled commercial banks (SCBs) decelerated to the lowest level (11%) in three years as of March 2025 due to a moderation in growth in agriculture, services, and personal loans over the last few quarters. The credit growth of public sector banks outpaced that of private sector banks as of March 2025 after more than a decade. The credit growth of NBFCs (Upper and Middle Layers) accelerated to 20.7% as of March 2025 from 16% as of September 2024 due to the conversion of a housing finance company (HFC) to an upper-layer NBFC and the merger of a middle-layer NBFC with an upper-layer NBFC.

Both SCBs and NBFCs continued to depict improvement in their asset quality, with the GNPA ratio declining to multi-decadal lows of 2.3% and 3%, respectively. For SCBs, the decline is attributed to stable asset quality in personal loans across major sub-segments and sustained improvements in asset quality across all sub-sectors in industrial loans, while agriculture remained the highest contributor to the GNPA ratio.

For NBFCs, the sustained improvement in asset quality is attributed to a decline in the GNPA ratio of government-owned NBFCs (to 1.4%) (accounts for 59% of advances by NBFC middle layer) and stable asset quality of privately-owned NBFCs (5.2%, which is the same as in September 2024). Sector-wise, asset quality improved in all except agriculture.

Notably, the stress in the retail loan book is visible among NBFCs compared to SCBs, and the former have significantly increased their share in unsecured personal loans and microfinance segments in recent years. SCBs reported a GNPA ratio of 1.2% in their retail loan book while NBFCs recorded a ratio of 3.1% in the same segment in the comparable period.

US inflation accelerates for the 1st time in 4 months, US Fed awaits further cuts

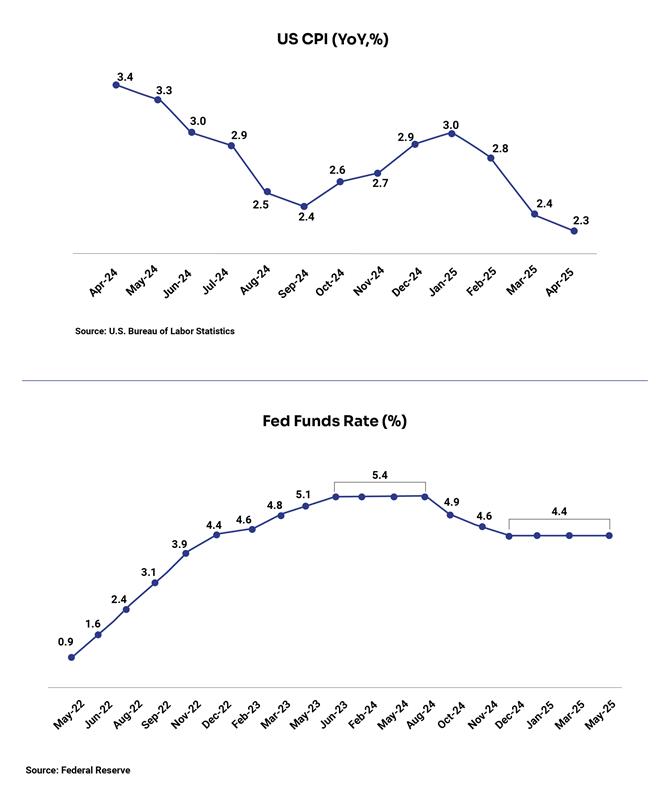
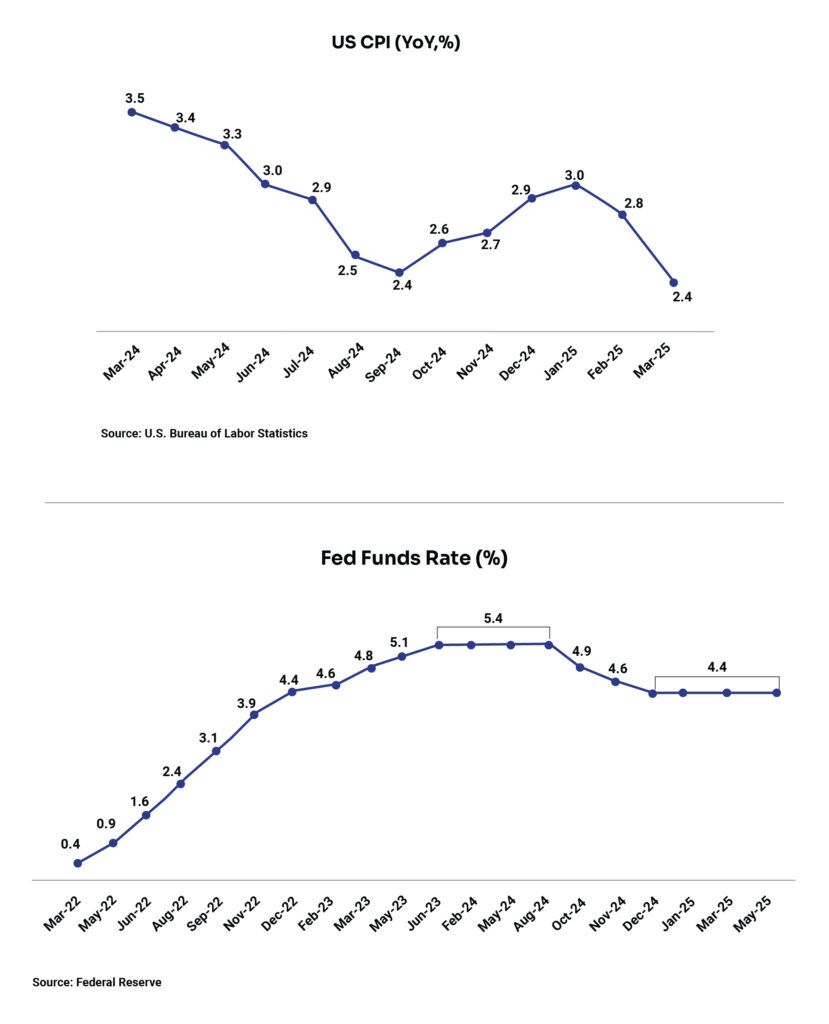
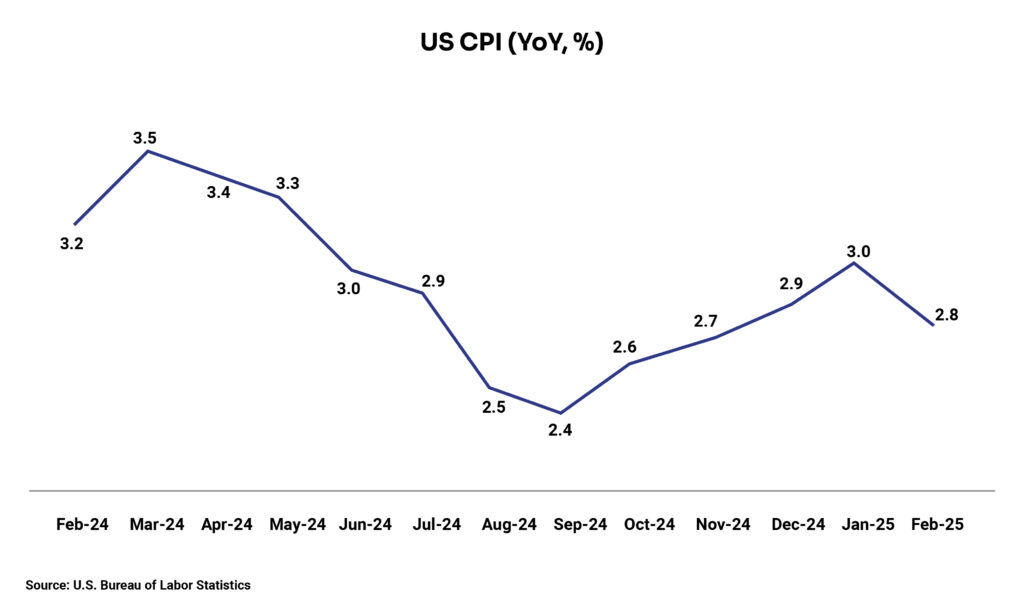
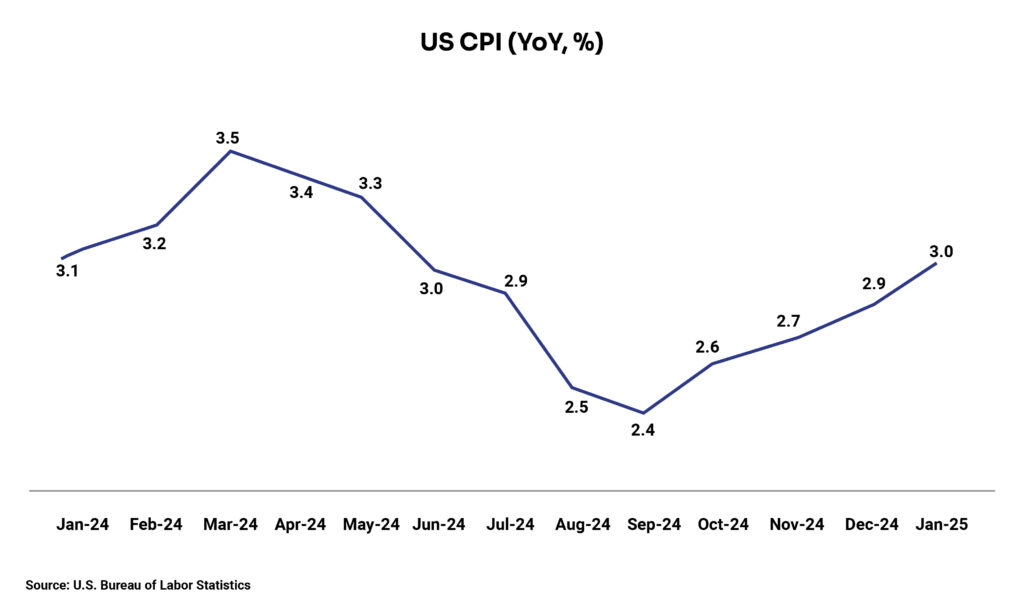
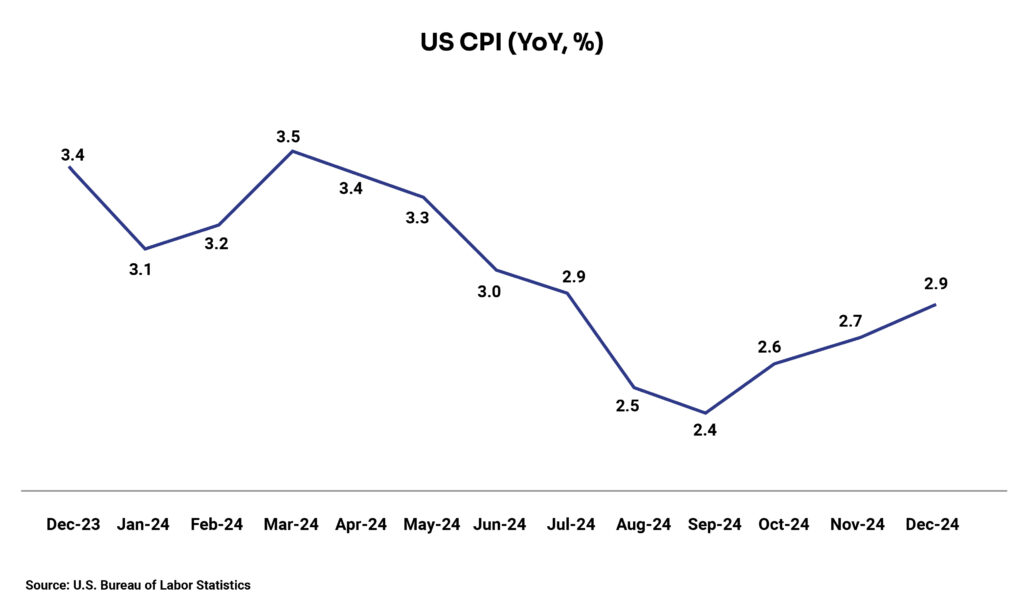
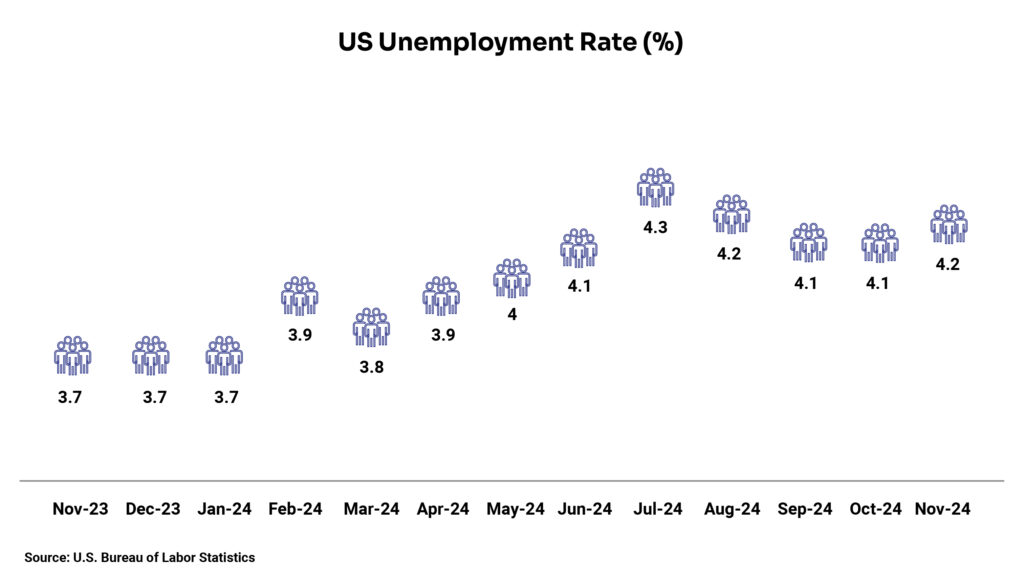
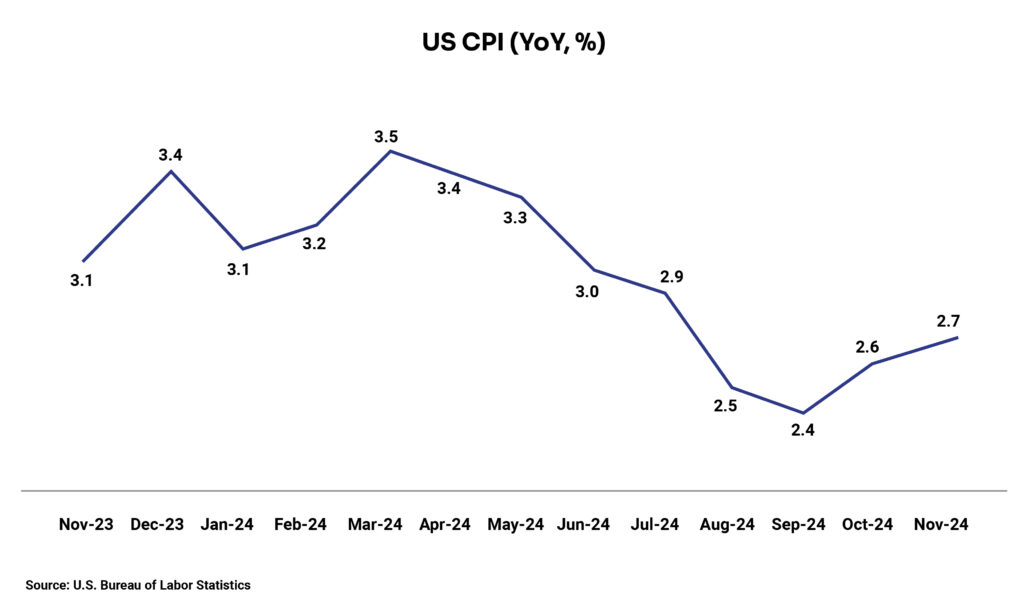
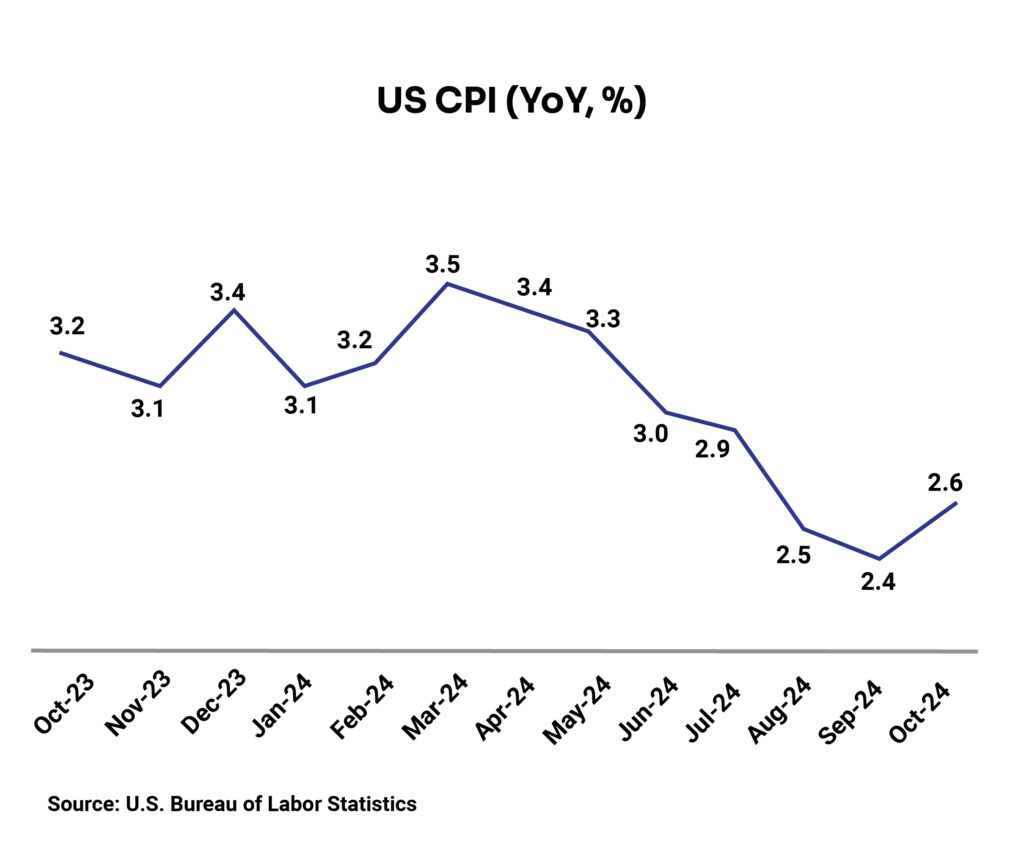
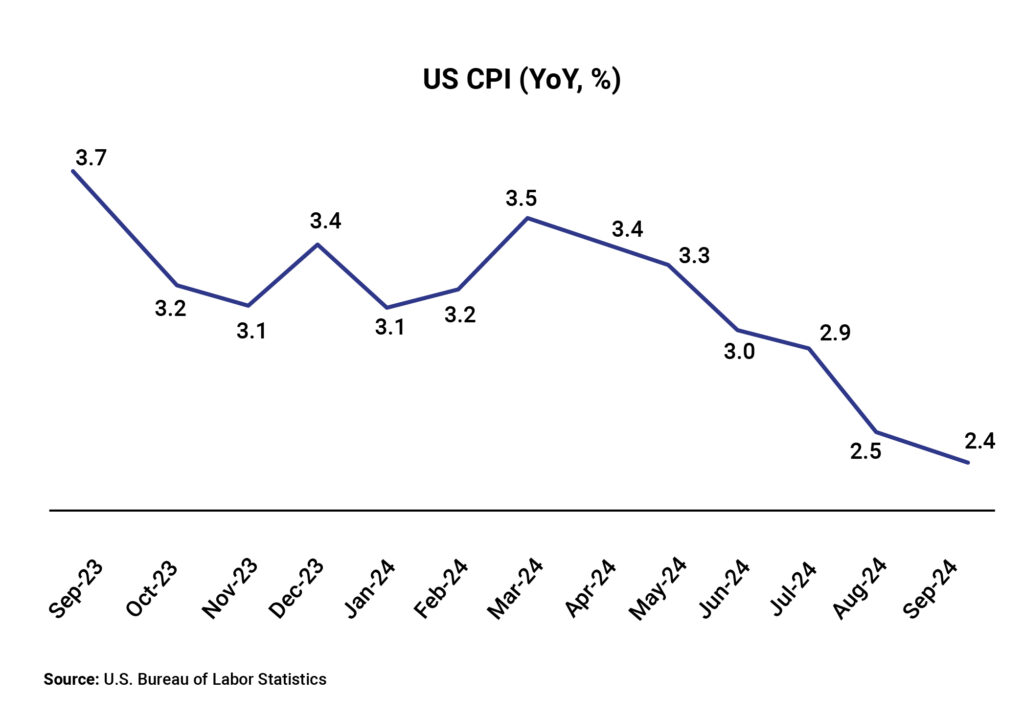
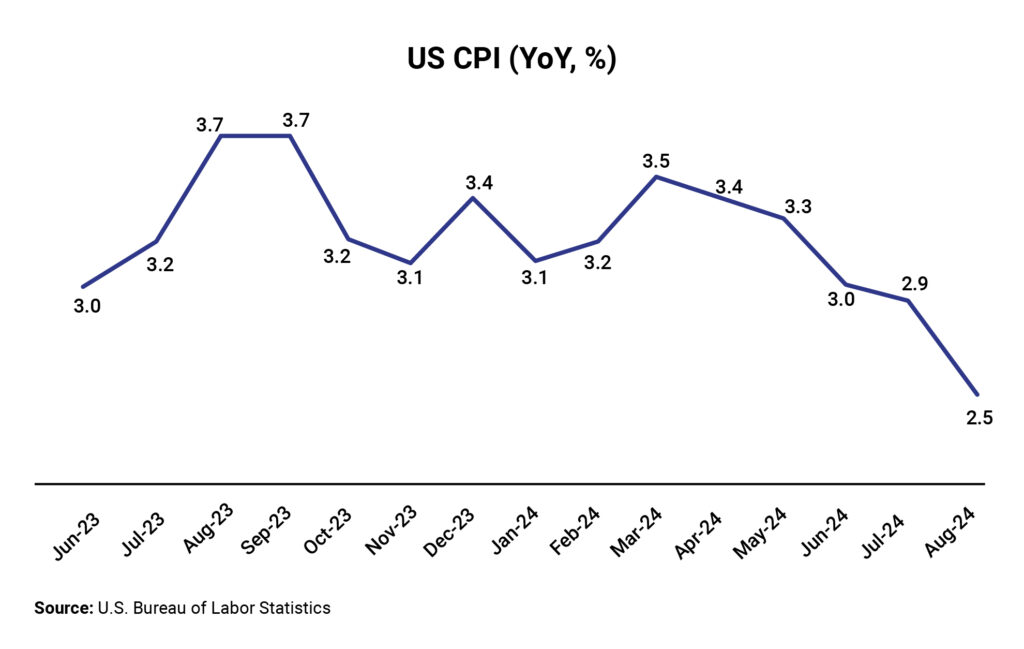
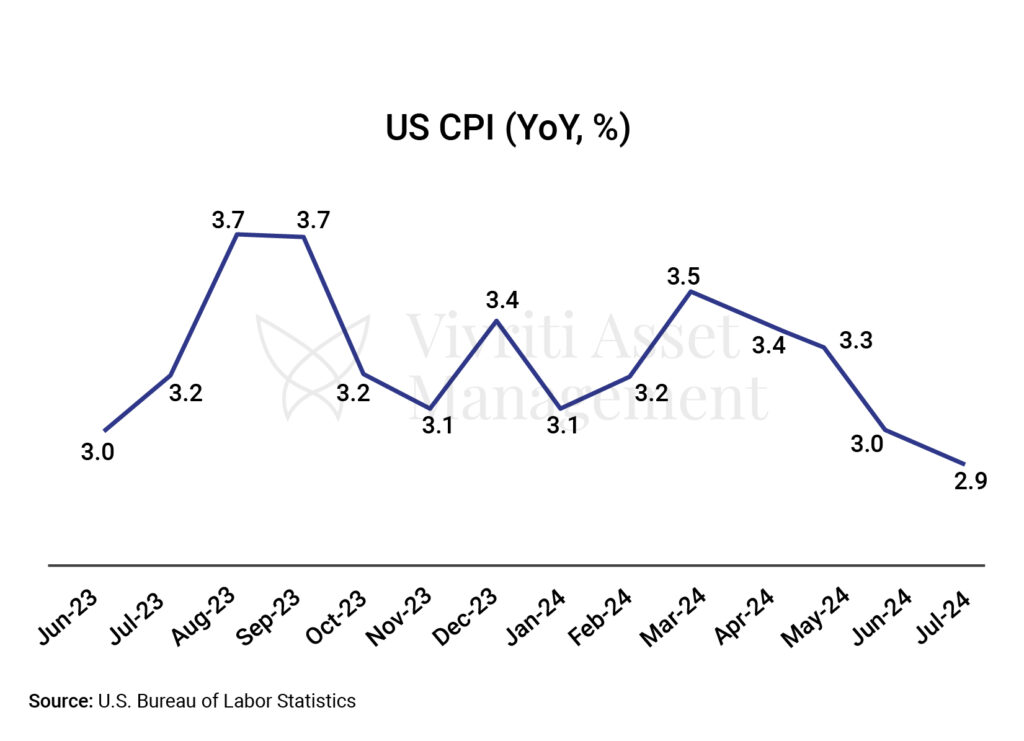
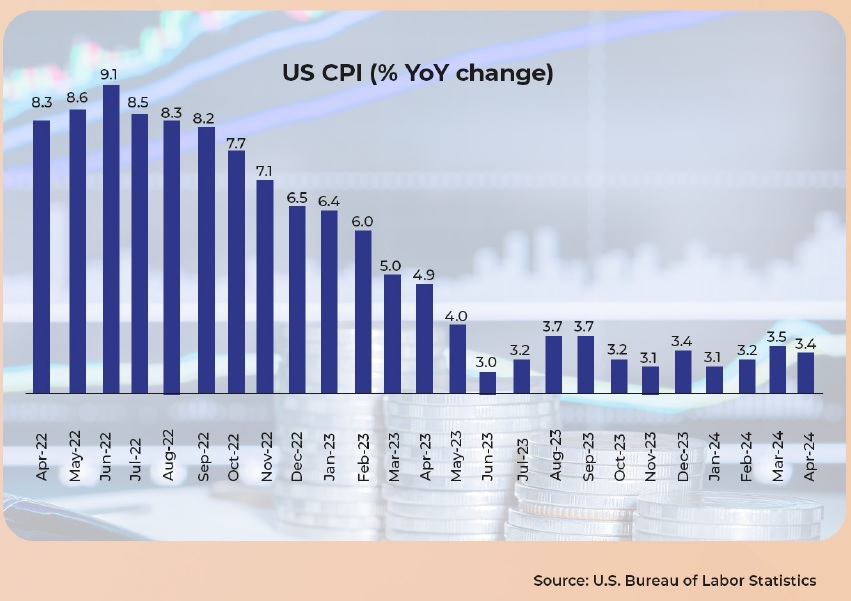
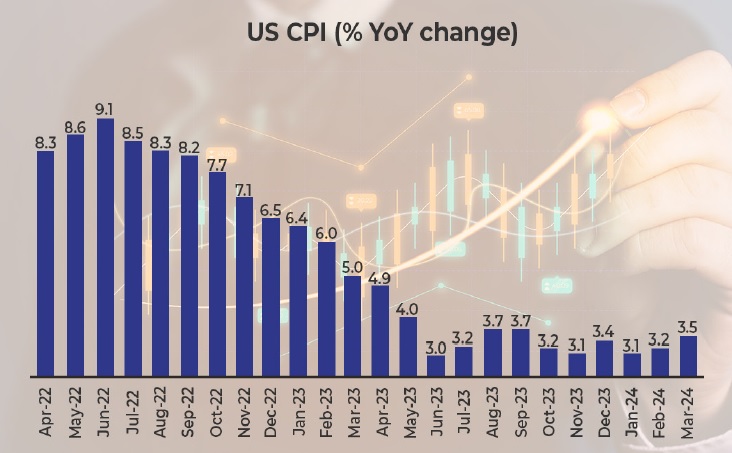
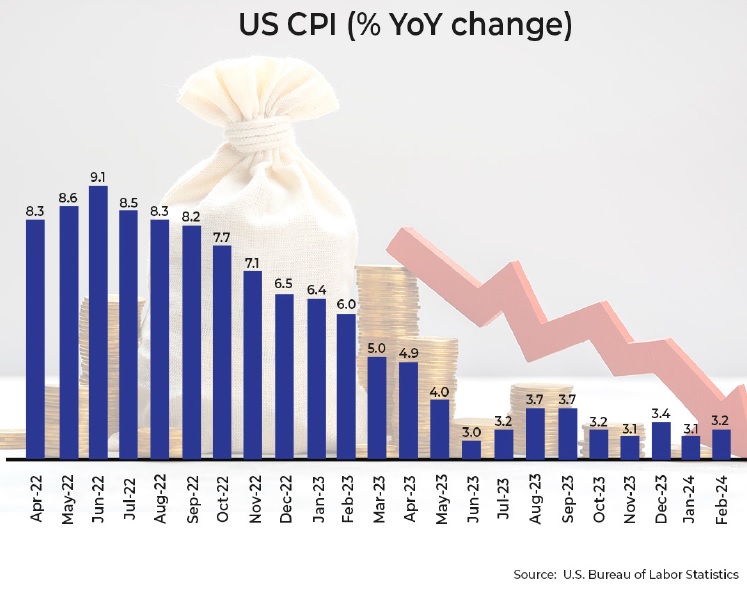
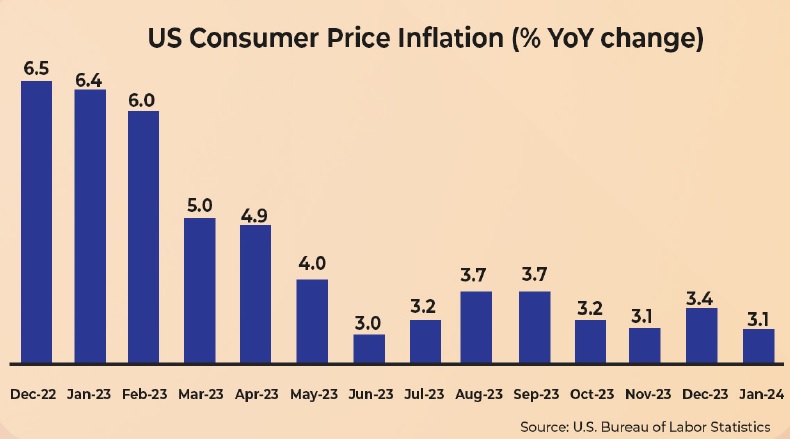
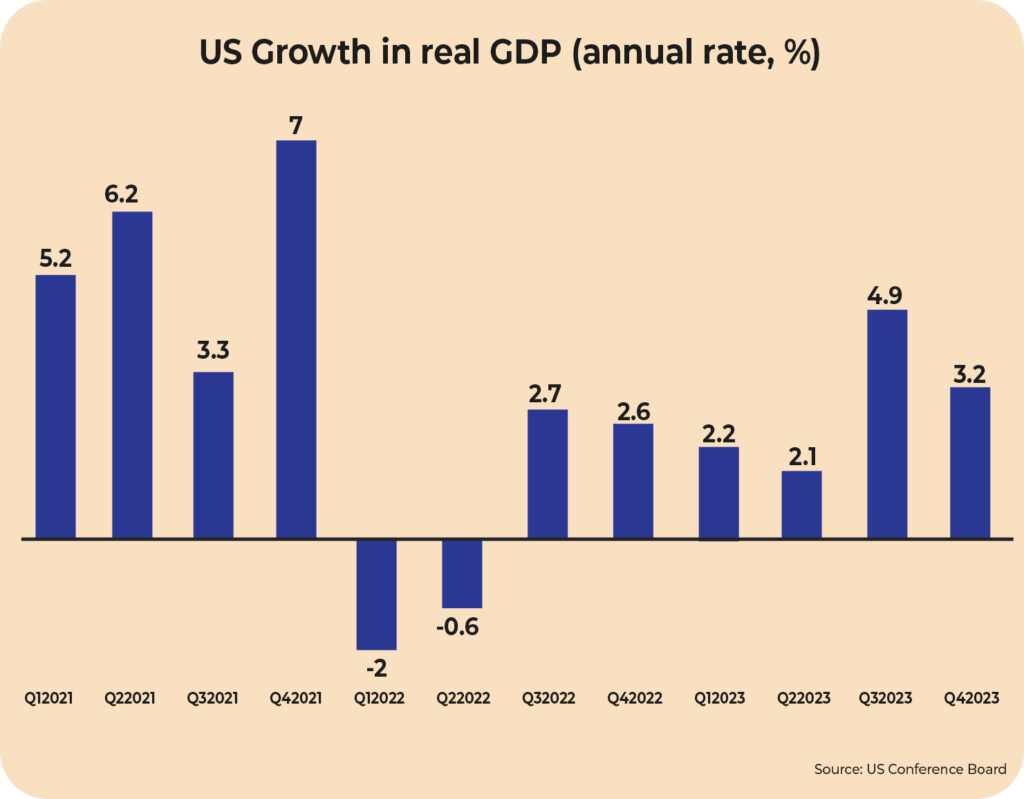
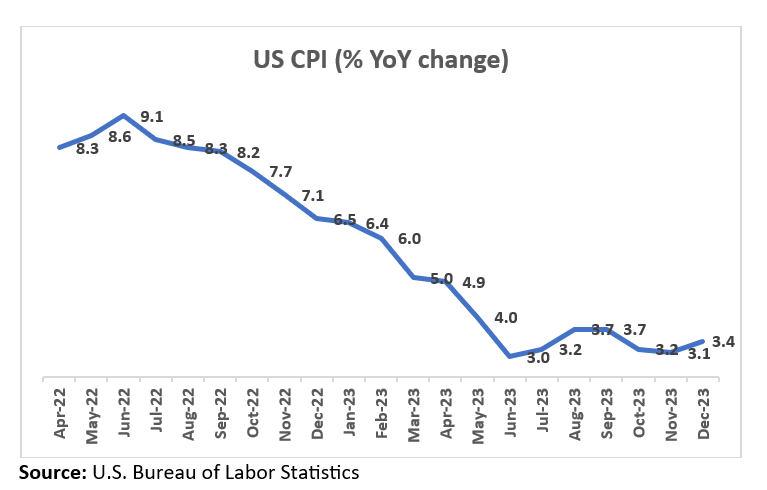
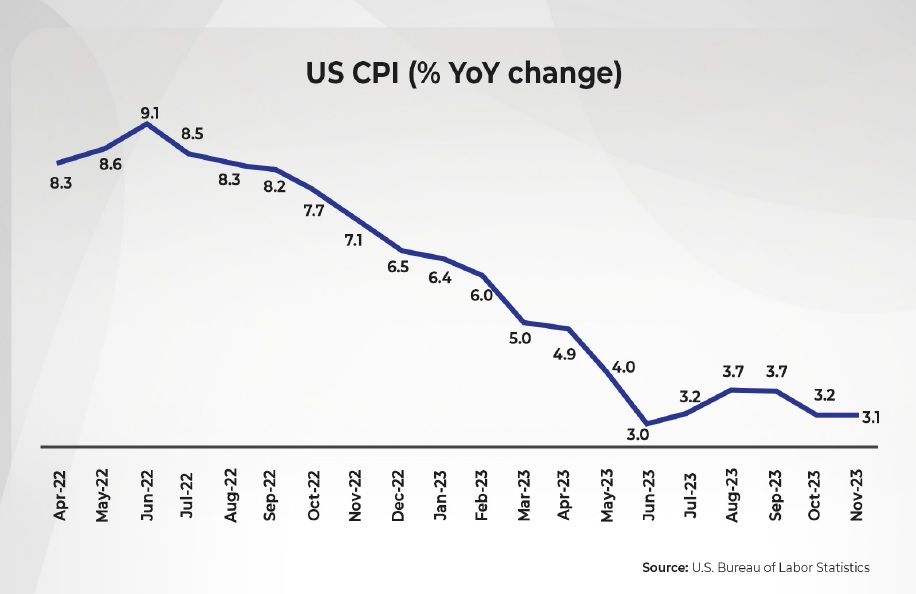
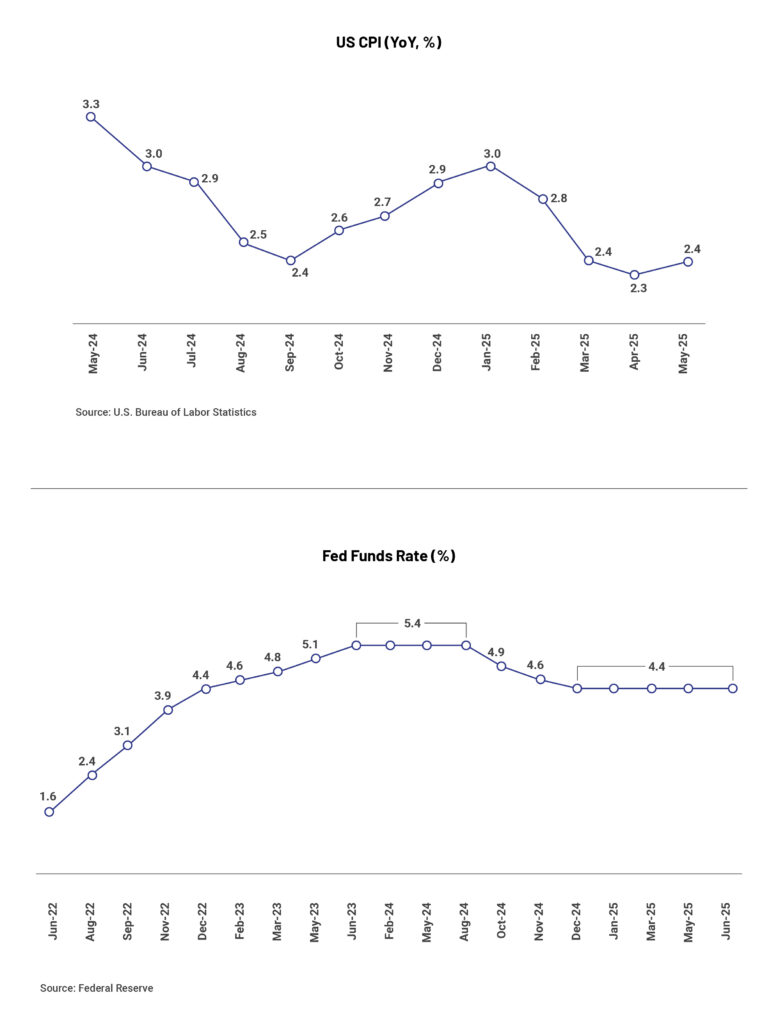
Consumer price inflation in the US accelerated for the first time in four months to 2.4% in May from 2.3% in April, which was the lowest level since 2021, However, the inflation came in below the consensus estimates of 2.5%. The acceleration is mainly driven by rise in prices of food (2.9% versus 2.8% in April), transportation services (2.8% versus 2.5%), used cars and trucks (1.8% versus 15%), and new vehicles (0.4% versus 0.3%).  The core inflation, which excludes volatile food and energy and is considered a better gauge of long-term trends by the US Fed, came in at 2.8%, slightly below the consensus estimates of 2.9%.

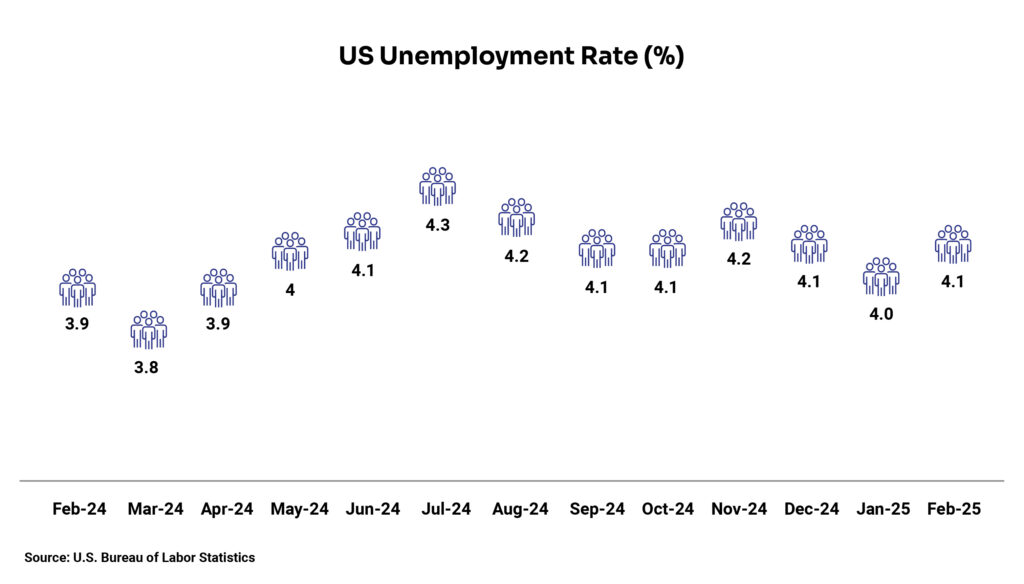
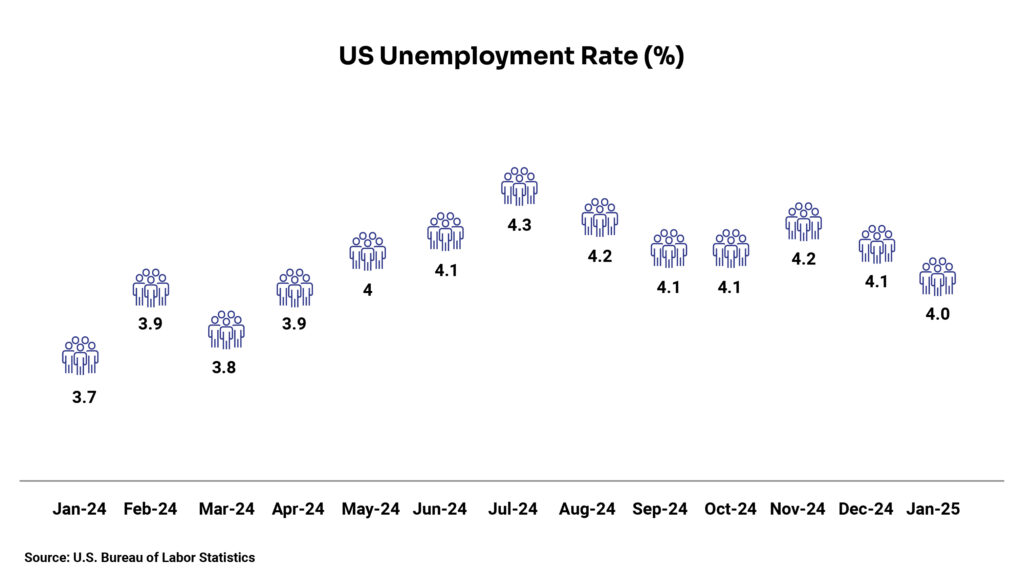
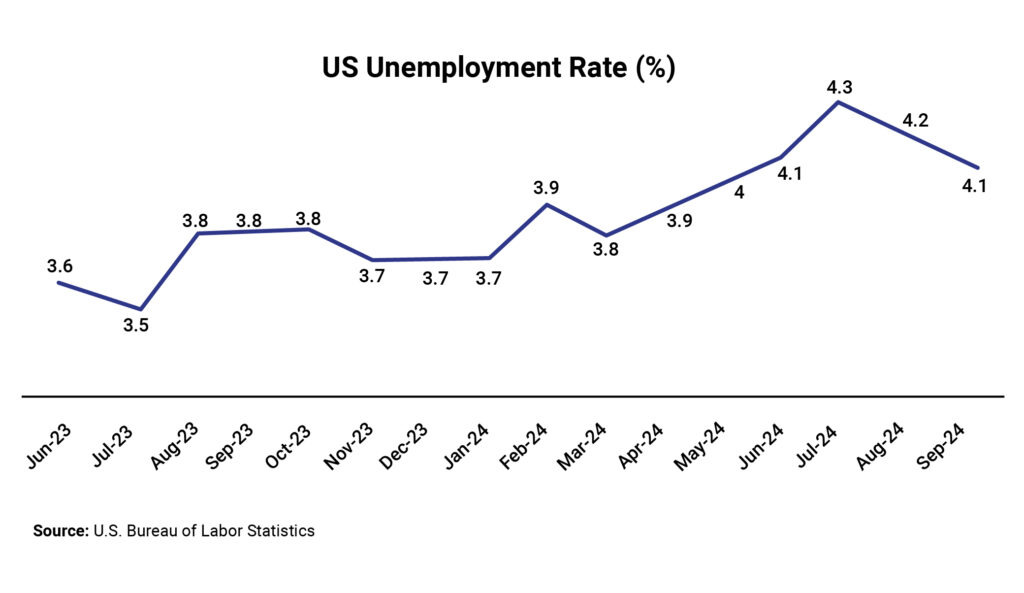
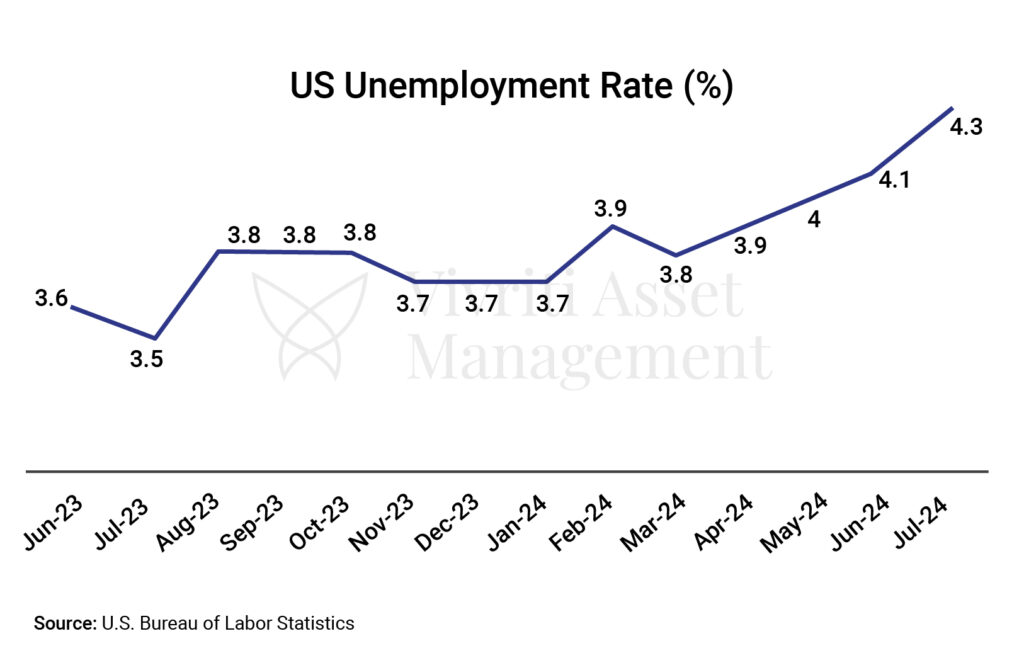
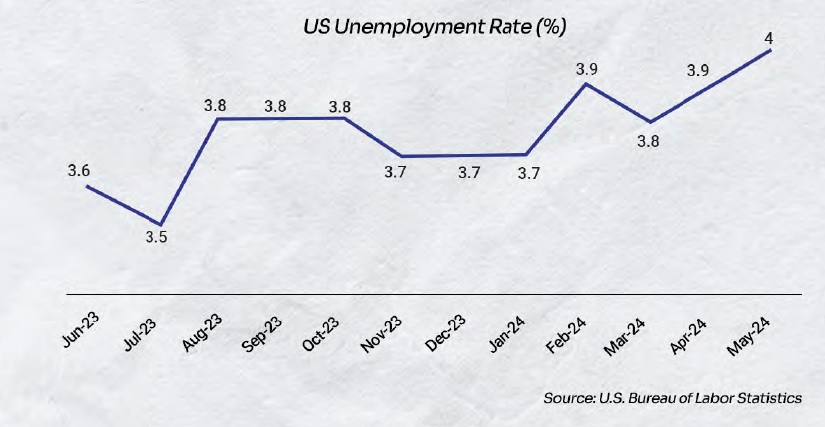
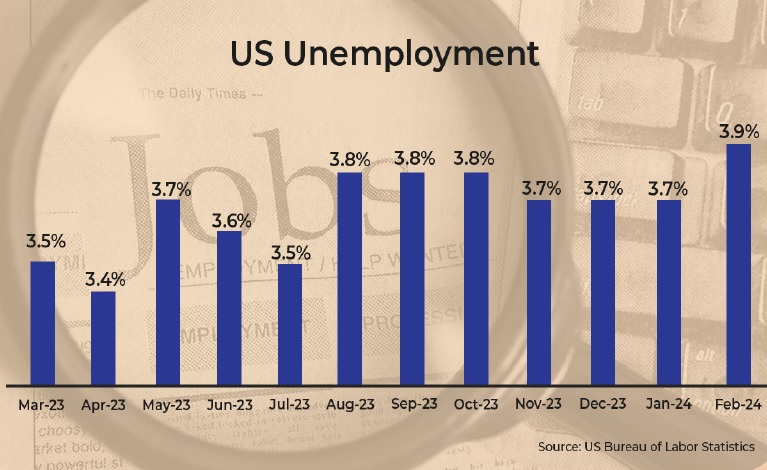
The US Federal Reserve held the repo rate steady at the 4.25%-4.5% range during its May meeting citing upside inflation risk and increase in unemployment. The Fed Chair Jerome Powell said, “that their existing policy is “in a good place” and can allow them to respond swiftly as economic conditions evolve.” As per market estimates, the US fed is likely expected to cut the rates in the later half of the year, although uncertainty remains.

US dollar is on its worst journey since 1973

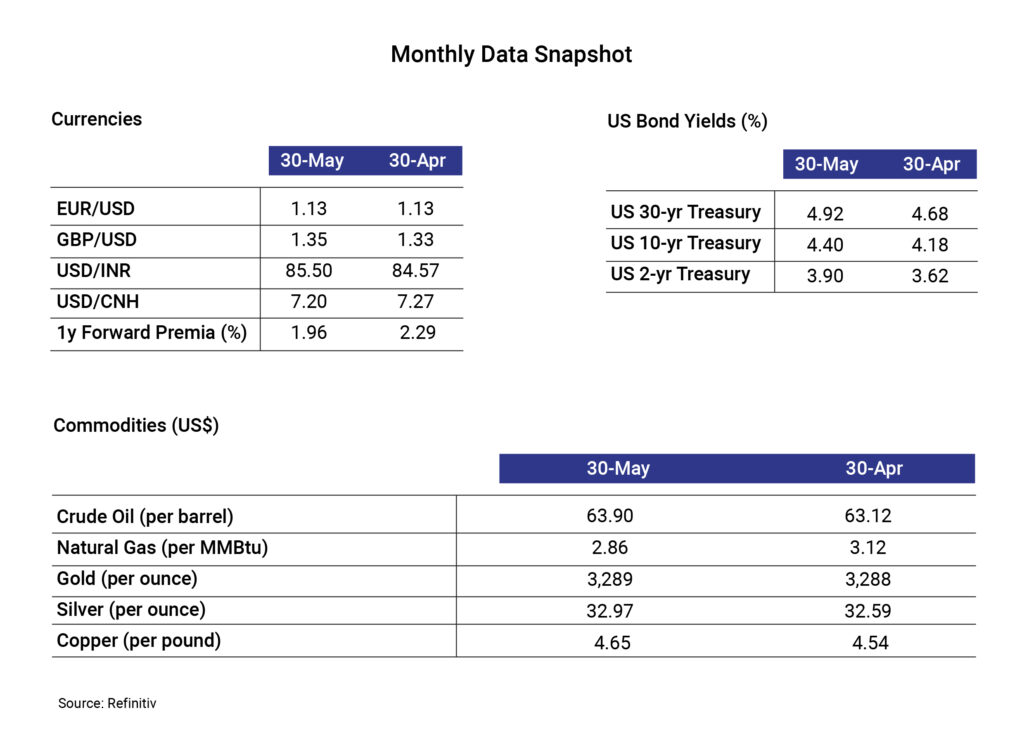
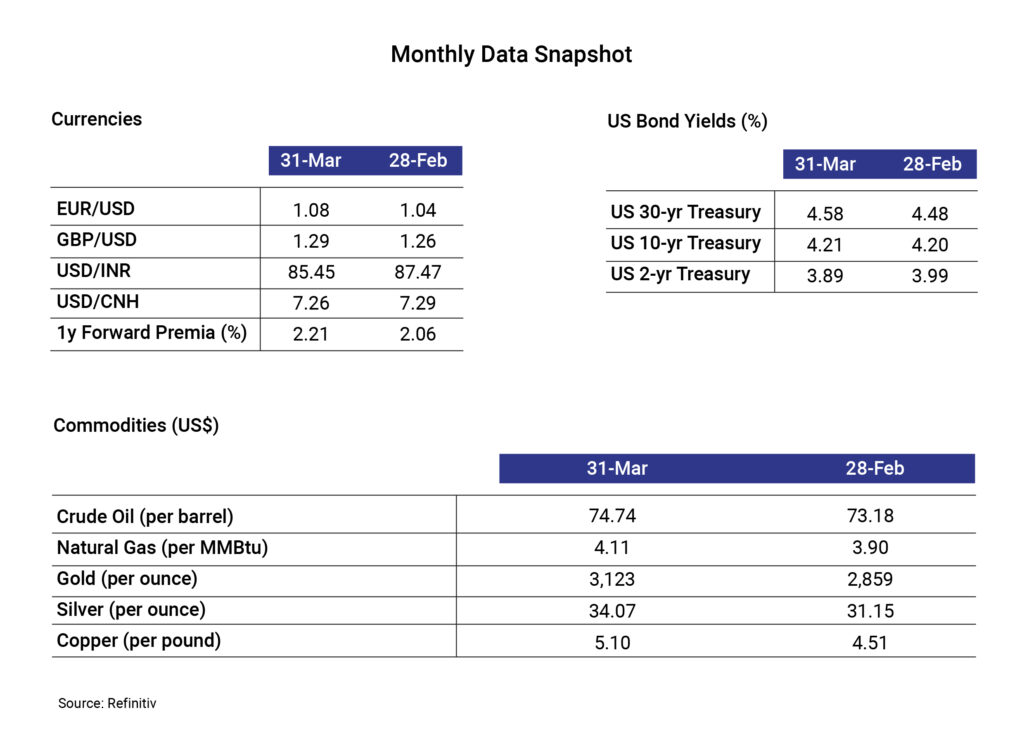
The US dollar has plummeted over 10% since the beginning of this year to June-end, marking its worst first-half performance since 1973. The ICE dollar index, which tracks the greenback against a group of six major global counterparts including the euro, yen, and pound, is hovering around 97, depicting a 13% fall from its 52-week high.

Despite a resilience in US stock markets, the prolonged fall in US dollar and declining long-term treasury yields indicates growing investor concerns about the ongoing tariff war and rising debt in the US, mainly after the “big, beautiful” tax bill that is expected to add US$3.2 trillion to the overall US debt, as per recent reports. The bill is designed to extend Trump’s 2017 tax cuts, curb healthcare and social welfare spending, and significantly increase public borrowing. Further, rising expectations of further interest cuts in the US following President Trump’s push for lower borrowing costs amid his criticism of the Federal Reserve chair led to conflicting signals on monetary and trade policy to the financial market. There is a growing concern that the dollar’s fall might eventually affect the US equities.

Disclaimer:

The details mentioned above are for information purposes only. The information provided is the basis of our understanding of the applicable laws and is not legal, tax, financial advice, or opinion and the same subject to change from time to time without intimation to the reader. The reader should independently seek advice from their lawyers/tax advisors in this regard. All liability with respect to actions taken or not taken based on the contents of this site are hereby expressly disclaimed.

DATE
June 6, 2025
PLACE
Mumbai
READING TIME
10 mins

The Pulse – Insights on key macroeconomic data and events (May 2025)

“The one instrument that has relative political autonomy is monetary policy.” –  Mohamed El-Erian


Executive Summary

The US Federal Reserve kept rates on hold and indicated that the central bank would likely be reactive instead of pre-emptive in the current uncertain environment. The US Fed’s statement noted the strength in economic activity, however, with rising stagflation risk. President Trump’s policies will continue to take centre stage and the impact of the same will likely determine the Fed’s next move. Meanwhile, the longer-end US treasury continued its weakness in May with yields rising on the back of the ‘Big Beautiful Bill’, with the US 30-year treasury breaching 5%, before a modest recovery. Moody’s also stripped the US of its pristine AAA sovereign rating citing fiscal concerns. In addition to tariffs flip flop, the focus is shifting to US fiscal policy with markets attaching significant term premiums seen in higher longer-end yields. Fading US exceptionalism, fiscal concerns, asset re-allocation, and tariff uncertainty – all of them are supporting softer USD and higher US yields. Barring sharp negative economic shocks, the US Fed will also not be in a hurry to act. Uncertainty continues to weigh on markets for now.

On the domestic front, geo-political tensions dominated the earlier part of the month with volatility in local currency assets. Markets regained their calm once the tensions eased, with rates rallying and currency moderating. Data-wise, inflation continued to moderate, strengthening the case for a deeper rate-cut cycle. Liquidity conditions continued to ease with additional Open Market Operations by the central bank. The Q4GDP growth came in better than expectations while domestic concerns remain due to headwinds from trade disruptions and global slowdown. On the currency front, INR benefits from an overall weaker USD. However, we believe the central bank will likely buffer up its reserves, which they spent since the peak in September-October last year (US$100 billion as per market estimates to defend INR).

Retail inflation drops to its lowest in nearly 6 years, food price-led downward trajectory may continue

India’s retail inflation, which is measured by the consumer price index (CPI) slipped further by 18 basis points month-on-month (MoM) to 3.16% YoY in April 2025, the lowest since July 2019. This can be attributed to a sharp MoM decline of 91 basis points in food inflation to 1.78%, which is the lowest since October 2021. However, core inflation, which excludes volatile food and energy prices, remained unchanged at 4.1% compared to the previous month. The fall in food inflation is driven by subdued food prices of vegetables, pulses, fruits, meat and fish. With this, the retail inflation stayed within the RBI’s medium-term target for three straight months.

The wholesale inflation fell to its lowest level in 13 months to 0.85% in April 2025 due to softening food inflation. It was lower than market estimates of 1.4% and 1.19% in April 2024. All three major segments of WPI – primary articles, fuel & power, and manufactured products – witnessed a moderation in inflation. Inflation for primary articles contracted to 1.44% in April for the first time in nearly two years primarily due to crude oil and natural gas inflation that fell to a 22-month low of 15.55% in April. Inflation in manufactured products, which accounts for over 60% of the overall basket, slowed to 2.62% in April from 3.07% in March. The fuel and power category witnessed a deflation of 2.18% in April against an inflation of 0.2% in March driven by a decline in prices of LPG, petrol, and diesel.

The deceleration in inflation is expected to provide RBI the needed comfort to continue with the rate cut cycle, with another 25-bps cut in FY26 being likely. Since the beginning of this calendar year, the central bank reduced the repo rate by 100 bps to 5.5% with a larger-than-expected cut of 50 basis points in June. The downside potential in India’s inflation trajectory remains strong due to lower global oil prices (with an expected pass-through) and an anticipated normal monsoon and higher foodgrain production, along with a favourable base. The rate cut cycle could get even deeper if the domestic economy experiences a slowdown below RBI’s growth projections for the year (6.5%).

Industrial output growth at 8-month low, mining and electricity sectors slow down

The growth in India’s industrial output, which is measured by the Index of Industrial Production (IIP), fell to an 8-month low of 2.7% YoY in April 2025 from an upwardly revised 3.9% in March 2025. This decline is attributed to the deceleration in mining and electricity sector growth. Mining sector output shrank 0.2% YoY, the lowest since August 2024, while the electricity sector output growth slowed to 1.1% YoY considering the early start of monsoons. This happened despite the 3-month high growth in the manufacturing sector, the largest in the IIP core sectors, to 3.4% YoY in April 2025. Within the sector, 16 of 23 industry groups showed positive growth in April 2025.

By use-based classification, capital goods reported the strongest growth of 20.3% YoY, which was an 18-month high, followed by consumer durables (6.4%), intermediate goods (4.1%), and construction goods (4%). Consumer non-durable goods remained in the negative territory with a 1.7% fall in output, indicating weakness in private consumption. While external headwinds remain a concern, domestic demand led by government spending, favourable rural outlook, and low energy prices is expected to boost domestic growth.

India’s Q4 Growth Suprises, FY26 outlook remains positive

India’s real GDP growth in Q4FY25 came in at 7.4% YoY, surpassing the market estimates by 40 basis points as well as the previous quarter’s growth of 6.4%. The 5-quarter-high growth is attributed to higher agriculture output led by foodgrain production and acceleration in industrial activity led by manufacturing, construction, and mining activities even though private consumption demand has slowed down due to weak urban demand.

The higher-than-expected Q4 growth led to an expected growth of 6.5% YoY for FY25, which is not overwhelming though as it decelerated to a 4-year low. The slowdown is attributable to lower growth in Industrial (5.9% in FY25 vs. 10.8% in FY24) and Services (7.2% in FY25 vs. 9% in FY24) activities. The agriculture sector was the shining star in the year with growth accelerating to 4.6% in FY25 from 2.7% in FY24 due to record Kharif production, favourable monsoon, and improved rural demand.

Going forward, the GDP growth is expected to be positively driven by a recovery in urban demand led by tax cuts and sustained low inflation level, buoyant rural demand on the back of above-normal monsoon and higher foodgrain production, lower crude prices, and continued monetary easing by the central bank (at least an additional 25 bps cut after June meeting). However, geopolitical tensions and a fall in demand for India’s exports due to a slowdown in the US economy will be concerns affecting the growth in the current fiscal year.
Global crude oil market falters, further dips are likely

Global crude oil prices (Brent) declined ~21% from the January peak of ~US$82/barrel to ~US$65/bbl on June 5th. This is the first time in nearly four years that crude oil prices have dipped below US$70 owing to several factors. However, the downward trajectory is expected to continue!

Demand side concerns due to a potential slowdown in the US, China, and global growth led to the primary fall in prices. The Organisation for Economic Cooperation and Development (OECD) recently lowered its global economic growth outlook from 3.3% in 2024 to 2.9% in 2025 and the next year, with the slowdown expected to be heavily concentrated in the US, Canada, Mexico and China. What added fuel to the fire was the Organization of the Petroleum Exporting Countries Plus (OPEC+) move on May 3 to a collective output hike of 4,11,000 barrels per day (bpd) from June. The oil cartel decided to raise production for the third month in a row leading to further dips in crude prices. OPEC+ steadily reversed nearly half of the 2.2 million bpd “voluntary” output cuts announced by eight of its members in 2023, which was meant to raise global oil prices. It is highly likely that the full 2.2 million bpd cut will be materialised by October 2025. The International Energy Agency (IEA) predicted oil demand to grow by a meagre 0.73% adding to the pain of an oversupplied market.

US inflation falls to its lowest level in over 4 years

Consumer price inflation in the US dropped to 2.3% in April 2025 from 2.4% in March, which is the smallest annual increase since February 2021. The consumer price index rose 0.2% in April on a seasonally adjusted basis below the market forecast of a 0.3% increase. The prices for gasoline and fuel oil fell sharply (-11.8% and -9.6% MoM, respectively) leading to a 3.7% decline in the energy index, which continued its declining trajectory. The other factor contributing to the slowdown in inflation was the food index, which fell 2.8% MoM primarily driven by a 12.7% decrease in egg prices.

The US Federal Reserve held the repo rate steady in its last meeting citing upside inflation risks. The US Fed kept the federal funds rate unchanged at 4.25%-4.5%, extending its pause in rate cuts since January. Hence, despite falling inflation, the US Fed is unlikely to cut rates in the near term due to concerns about tariff-led inflation.


Disclaimer:

The details mentioned above are for information purposes only. The information provided is the basis of our understanding of the applicable laws and is not legal, tax, financial advice, or opinion and the same subject to change from time to time without intimation to the reader. The reader should independently seek advice from their lawyers/tax advisors in this regard. All liability with respect to actions taken or not taken based on the contents of this site are hereby expressly disclaimed.

DATE
May 13, 2025
PLACE
Mumbai
READING TIME
10 mins

The Pulse – Insights on key macroeconomic data and events (April 2025)

“My gut tells me that uncertainty for the path of the economy is extremely elevated.” – Jerome Powell, US Fed Chair


Executive Summary

Tariffs dominated the month with liberation day tariffs turning out to be more severe than market anticipation. This triggered a strong risk off market reaction. Typical risk-off moves are associated with a stronger dollar and softer US yields, but this time it was different with fading US exceptionalism theme dominating market sentiments, strong sell-off in longer tenor US treasury yields, and a weaker dollar. The eventual pause on tariffs saw some normalcy return to the market with risk assets rallying. However, the chain of events has shaken investor confidence about US supremacy, depicted by a sharp rally in gold this year (almost 30% YTD), and US treasuries and the dollar losing value. Markets will likely continue to watch the tariff space as it progresses towards the pause deadline.

On the domestic front, the central bank followed up with another unanimous rate cut in April with the underlying dovish tone. In addition to the cuts, the series of liquidity infusion operations into the banking system led to a sharp rally in the rate curve. INR also appreciated against the dollar on the chatter of large inward flows. Market positioning of USD-INR was also long, which exacerbated the move as market participants stopped out. However, a recent chain of events with respect to geo-political tensions poses a risk to domestic markets and the space will be watched closely for escalations. So far, the sell-off is contained across asset classes domestically. We expect RBI to intervene whenever necessary to stem any sharp currency depreciation pressures.

Retail inflation falls to near 6-year low, more repo rate cuts are likely

India’s retail inflation declined marginally by 27 basis points (bps) on a month-on-month (MoM) basis to 3.34% in March, which is the lowest point in nearly 6 years. Although marginal on a MoM basis, the fall is much more pronounced (287 bps) when compared to the 2024 peak. The lower inflation is largely attributed to the decline in food inflation led by falling prices of vegetables, eggs, pulses, spices, and meat and fish. In the food basket, the deceleration in vegetable prices have been more intense as they went up by 42% YoY in October 2024 and dropped to a 21-month low of -7% YoY in March 2025.

The drop in food inflation also led the producer’s prices or wholesale inflation to decline to a 4-month low of 2.05% in March. Wholesale food prices eased from 2.38% in February to 2.05% in March driven by decline in vegetable prices.

With the 67-month low inflation print, the average inflation in Q4FY5 stood at 3.7%, which is lower than RBI’s prior estimate of 4.4%, while the average inflation for FY25 stood at 4.6%, lower than the same by 20 bps. Extreme heat during the summer may pose upside risks, however, a favourable base expects to keep inflation in check.

The deceleration in inflation is expected to provide RBI the needed comfort to continue with the rate cut cycle. Since the beginning of this calendar year, the central bank reduced repo rate by 50 bps to 6% with the early-April cut of 25 basis points. Due to a downside potential for domestic inflation led by lower global oil prices (with an expected pass through), expected normal monsoon and higher foodgrain production, a cumulative repo rate cut of another 50 bps is expected in this fiscal year. The rate cut cycle could get even deeper if the domestic economy experiences a slowdown below RBI’s growth projections for the year (6.5%).

Following are the revisions in real GDP growth and Inflation forecasts announced by the RBI Monetary Policy Committee:
India`s industrial output growth dips to 4-year low

India’s industrial output, which is measured by the Index of Industrial Production (IIP), recorded a growth of 4% in FY25, reflecting a sharp deceleration from 11.4% in FY22. This slowdown in the industrial activity can be attributed to global economic uncertainty that is hampering trade and export growth, weak consumption demand, and a decline in private and government capital expenditure. Moreover, the data released by National Statistics Office (NSO), highlights the YoY slowdown in all the three sectors.

Manufacturing sector (largest in IIP basket) grew 3% YoY in March 2025 (versus 2.8% in February), but the growth slowed down significantly from 5.9% in March 2024. Electricity sector, considering the summer months, rose 6.3% in March 2025 (against 3.6% in February) but the growth was lower than 8.6% in March 2024. On the other hand, the mining sector growth dipped to 0.4% in March 2025 compared to 1.3% a year ago. In March 2025, the drop in the mining sector output was largely offset by the improvement in manufacturing and electricity sector.

India’s industrial output growth surpassed in March from the downwardly revised estimate of 2.7% in February driven by MoM growth in two of its three components, manufacturing, and electricity. While there has been an improvement in the IIP numbers post August 2024-low, they have become volatile in the following months. Looking ahead, the growth in IIP would be likely be determined by the intensity and impact of trade tariffs and favourable domestic drivers.

India’s unemployment rate at 7-year low, factors like upskilling and economic resilience at play

The unemployment rate in India declined to a 7-year low of 3.2% in 2024 from 6% in 2018 according to the Periodic Labour Force Survey 2023-24. The labour force participation rate (LFPR), which is measured as a percentage of people in the labour force i.e. the people who are working, seeking or are available for work, grew to 60.1% in 2024 from 49.8% in 2018. Thanks to the stable economic growth post pandemic, increasing women participation in the workforce, growing youth population, improved employment opportunities, and the government initiatives to develop skills and foster entrepreneurship.

In addition, the significant fall in urban and rural unemployment to 5% and 2.5% in 2024 from 7.8% and 5.3% in 2018, respectively has contributed towards the drop in the unemployment rate. As technologies evolve, there is a necessity to balance its impact on the workforce and to equip them with the necessary skills. Investing in technological advancement and implementing more flexible labour regulations could further strengthen the labour market.

US heads for negative quarterly growth 1st time in 3 years, trade deficit at record high

The US economy shrank for the first time in three years as advance estimates by the Bureau of Economic Analysis depicted a 0.3% annualised fall in GDP in the first quarter of 2025. It’s the first negative quarterly growth since the first quarter of 2022. Trump’s tariff play led to an unexpected rise in imports, as observed by many economists across the board. Imports surged 41.3% during the quarter, driven by a 50.9% increase in goods, which was the highest growth recorded, except during Covid times, since 1974. This happened as businesses front-run tariffs before its implementation in early April.

Apart from imports (with a 5-percentage points impact), the 5.1% decline in government spending due to cuts from the Department of Government Efficiency (D.O.G.E.) impacted the GDP growth by 0.3 percentage points. These were partially offset by growth in investment, consumer spending, and exports. Personal consumption rose (1.8%) but recorded the slowest gain since Q2 2023 while it rose 4% in the prior quarter. Private domestic investment surged nearly 22% driven by a 22.5% rise in equipment spending ahead of the tariff implementation.

It is yet to see whether the economy could rebound in the current quarter, which is enough to avoid a stagflation (a period of tepid growth and high inflation) after the drag from import goes away.

The higher import caused the US trade deficit to hit a record high of US$140.5 billion in March. Imports rose 4.4% to an all-time high of US$419 billion while exports went up 0.2% to US$278.5 billion, which was also a record high. The biggest contributor to imports was consumer goods, especially pharmaceutical, most of which originated from Ireland.

US inflation continues to ease but Fed awaits further cuts

Consumer price inflation in the US came in at 2.4% YoY in March 2025, continuing the easing trajectory since the beginning of the year. The consumer price index declined a seasonally adjusted 0.1% in March, translating to a 12-month rate of 2.4% down from the January peak of 3%. Falling energy prices kept the inflation in check. Gasoline prices fell over 6% in the month leading to a broader 2.4% decline in the energy index. The secondary factor for the lower inflation was the drastic fall in travel-related costs, including airfares (fell 5.3% MoM) and hotel room tariffs (down 3.5%).

The US President has urged the Fed to cut interest rates, but the central bank held them steady in its recent meeting citing upside inflation risks. The US Fed kept the federal funds rate unchanged at 4.25%-4.5%, extending its pause in rate cuts since January. The Fed Chair Jerome Powell said a “great deal of uncertainty” remains about the implications of President Donald Trump’s tariff policy. As per market consensus, the US fed is unlikely to cut rates until June.

Disclaimer: The information provided in this article is for general informational purposes only and is not an investment, financial, legal or tax advice. While every effort has been made to ensure the accuracy and reliability of the content, the author or publisher does not guarantee the completeness, accuracy, or timeliness of the information. Readers are advised to verify any information before making decisions based on it. The opinions expressed are solely those of the author and do not necessarily reflect the views or opinions of any organization or entity mentioned.

DATE
April 4, 2025
PLACE
Mumbai
READING TIME
10 mins

The Pulse – A monthly digest of key macroeconomic events (March 2025)

“We believe that it will have a short-lived impact on inflation, but for growth, a trade war will be extremely detrimental” – Luis de Guindos, Vice President, European Central Bank


Executive Summary

Uncertainty continued to weigh on markets through the month with impending liberation day tariffs, with yields ending marginally softer for the month on softer data points. Fed kept rates on hold and the median dot plot remained broadly the same since the last reading indicating the central bank is not in a rush to act. However, projections showed signs of stagflation worries, with lower growth forecast and higher inflation forecast. The tariff announcement on key trading partners turned out to be more severe than what the market was pricing, triggering a sharp reaction across asset classes – stocks crashed, bond yields fell, and the dollar index traded weaker. The actual implementation deadline is still a couple of days away and there would be likely some negotiations and possible retaliations, in some instances.

In continuation with measures to ease banking system liquidity, RBI announced more tranches of Open Market Operations and another foreign currency swap earlier last month. Steps were pre-emptive ahead of the seasonal year-end squeeze in March, being the fiscal year-end. There were positive data surprises last month with inflation coming in lower at 3.6%, led by softer food inflation, and IIP improved to 5%, led by a pick-up in the manufacturing sector. On the currency front, sharp lower movements in USD-INR caused the currency pair to drop ~2.3% last month, while FPI flows turned positive (including both debt and equity). With softer inflation and potential growth slowdown, we expect RBI to cut rates by another 25 bps and change its stance to accommodative in the upcoming April meeting.

Domestic Updates

India’s retail inflation plunges to 7-month low, wholesale inflation spikes

The retail inflation in India, measured by the change in the Consumer Price Index (CPI), moderated to a 7-month low of 3.61% YoY in February from 4.31% YoY in January. This is the first time since September 2024 that the inflation has dropped below the RBI`s medium-term target of 4%. The softening is attributable to food inflation that eased to 3.75% YoY in February, the lowest since May 2023. Vegetable deflation stood at 1.07% YoY in February compared to an inflation of 11.35% YoY in January. Along with vegetables, lower prices in eggs, meat, fish, pulses, and dairy products contributed towards the fall in inflation.

However, inflation based on the Wholesale Price Index (WPI) rose to an 8-month high of 2.38% YoY in February from 2.31% YoY in January led by lower deflation in fuel and power prices and higher costs in the manufacturing sector. The deflation for fuel and power declined to 0.71% YoY in February from 2.78% YoY in January whereas inflation for manufactured products increased to 2.86% YoY in February from 2.51% YoY in January. However, the food inflation declined to 5.94% in January from 7.47% in January, partially offsetting the rise in wholesale price inflation.

Meanwhile, retail inflation for farm and rural workers eased to 4.05% YoY and 4.10% in February respectively, from 4.61% YoY and 4.73% in the previous month. The retail inflation for farm and rural workers during the month is the lowest since November 2021.
The retail inflation for industrial workers (IW) measured by the CPI-IW, moderated to a 5-month low of 3.10% in January 2025 from 3.53% in December.
India’s industrial output growth accelerates

India’s industrial output, as measured by the Index of Industrial Production (IIP), grew 5% YoY in January 2025 compared to 3.5% in December primarily driven by the manufacturing sector. The manufacturing sector (largest in the IIP basket) output increased 5.5% in January compared to 3% in December as higher government spending in January provided support to industrial growth. Mining and electricity output grew 4.4% and 2.4%, respectively, during the month under review.

India`s GST collections register a sluggish growth

India’s GST collection grew 9.1% YoY to INR 1.84 lakh crore in February driven by an increase in domestic revenue. The GST from domestic sources increased by 10.2% YoY to INR 1.41 lakh crore in February. The top five states by collection remained the same with Maharashtra recording the highest collection (INR 30,637 crore) followed by Karnataka (INR 14,117 crore), Gujarat (INR 11,402 crore), Tamil Nadu (INR 10,694 crore), and Haryana (INR 9,925 crore). Net GST revenue grew 8.1% YoY to 1.62 lakh crore in the month under review.

OECD revised India’s GDP growth forecast downwards

The Organisation for Economic Co-operation and Development (OECD) lowered India’s FY26 growth forecast to 6.4% from its earlier estimate of 6.9% in December citing rising global uncertainty. The forecast for FY27 has also been lowered to 6.6% from the earlier estimate of 6.8%.

Meanwhile, Ministry of Statistics and Programme Implementation (MOSPI) has revised the growth estimates for FY25 to 6.5% from 6.4% projected in January. The ministry`s outlook is based on recovery in the agricultural and service sector during the December quarter.

Gross FDI inflows nosedive in Q3FY25

Gross foreign direct investment (FDI) in India dipped 5.6% YoY to US$10.9 billion in the October-December 2024 from US$11.5 billion in the October-December 2023, due to global uncertainties. Total FDI, including equity inflows, reinvested earnings and other capital, grew 21.3% YoY to US$62.4 billion in 9M FY25. In April-December 2024-25, major countries that contributed to equity inflows were Singapore, the US, the Netherlands, the UAE, Cayman Islands and Cyprus.

India’s trade deficit shrinks

India’s merchandise trade deficit, the gap between the imports and exports, declined to US$14.1 billion in February from US$22.9 billion in January driven by sharp decline in imports. This is the lowest deficit since August 2021. Merchandise imports fell 16% YoY to US$50.96 billion while exports fell 11% YoY to US$36.91 billion.

India’s unemployment rate skids

The unemployment rate in India slid to 8.2% in January 2025 from 8.3% in December, according to the survey by the Centre for Monitoring Indian Economy (CMIE). The average unemployment rate in India for the 2018-2024 period was 8.18%. The unemployment rate reached an all-time high of 23.5% in April 2020 and it reached an all-time low of 6.4% in September 2022.

India’s net direct tax collection growth slows

India’s net direct tax collection grew 13.13% YoY to INR 21.26 lakh in March slowing from 14.69% in February, according to the latest data released by the income tax department. Gross direct tax collections were up 16.15% to INR 25.87 lakh crore in FY25 from INR 22.27 lakh crore in FY24. During the same period, corporate tax collection was at INR 12.4 lakh crore, while Securities Transaction Tax (STT) collection, a component of direct tax, grew sharply by 55% YoY to INR 53,095 crore.

Passenger vehicle sales drop significantly

Total passenger vehicle (PV) sales in India fell 10.34% YoY to 303,398 units in February from 465,920 units in January, as per the data from the Federation of Automobile Dealers Association (FADA). The auto dealers attribute this decline to delayed conversions and other challenges. All the categories registered a decline – 2-wheeler sales were down 6% YoY, 3-wheeler segment fell 2%, commercial vehicles sales dropped 8.6%, and the tractor segment dipped 14.5% YoY.

Global Update Roundups

Monetary Policies

  • US: The US Fed kept the federal funds rate unchanged at 4.25% – 4.5% for the second time in a row in its March 2025 meeting, noting that the economy is expanding, and the unemployment rate remains under control while acknowledging the rising concern about the economic outlook at the same time. “We do understand that sentiment has fallen off pretty sharply, but economic activity has not yet,” the Federal Reserve Chair Jerome Powell said. “The economy seems to be healthy”.
  • ECB: The European Central Bank (ECB) cut its benchmark interest rates by 25 basis points to 2.65% from 2.9% while lowering the deposit facility rate to 2.5%, and the marginal lending rate to 2.9%. The move aims to boost economic growth amid rising concerns on persistent inflation and sluggish recovery in the Eurozone fearing a looming trade war.
  • BoJ: The Bank of Japan (BoJ) kept interest rates unchanged at 0.5%, in an effort to buy more time for gauging the effect of higher US tariffs on the export-intensive economy. “Japan’s economy is recovering moderately, albeit with some weak signs,” the BOJ stated.
  • China: China has kept its benchmark interest rates unchanged for the fifth straight months, in line with market expectations. The one-year loan prime rate (LPR), a benchmark rate for corporate and household loans, was kept steady at 3.1%, while the five-year LPR, a reference for property mortgages, has been retained at 3.6%. This happened as economic recovery and declining lender profit margins limit the need for further easing.
  • BoE: The Bank of England (BoE) kept the benchmark interest rate unchanged at 4.5%, treading caution about the persistent inflation, slowdown in economy, and global economic uncertainties. The country’s inflation remained above the central bank’s 2% target and is set to move higher in the next few months.

GDP growth

  • US: The US economic growth declined at an annualised rate of 2.4% in Q4CY24 from the previous quarter’s growth of 3.1% but was slightly higher than the consensus estimate of 2.3%. The slowdown in growth is a result of weakened exports, while imports surged, and a 9% decline in business investments. On the other hand, there was a slight increase in government and consumer spending, at an annual rate of 4.2%, in the fourth quarter.

  • Japan: Japan’s economy grew 0.6% QoQ in Q4CY24 from the previous quarter’s 0.4% (upwardly revised), the third consecutive quarter-on-quarter growth. This growth is attributable to increase in government spending by 0.4%, and business investments by 0.6% (compared to a 0.1% drop in Q3), which is above the expectations of 0.5%.
  • Euro Area: The seasonally adjusted GDP grew 0.2% in the Euro area and 0.4% in the EU on a QoQ basis in Q4CY24. Among the member states, Ireland recorded the highest growth (3.6% QoQ) followed by Denmark (1.6%), and Portugal (1.5%).
  • UK: The UK economy grew 0.1% QoQ in Q4CY24, in line with the previous estimate, and compared to the flat reading of Q3CY24. The improvement is led by increase in household spending, gross capital formation, public expenditure, and service sector output.

Unemployment

  • US: Unemployment rate in the US was 4.1% in February, slightly above the market expectations and January`s reading of 4%. The number of unemployed individuals grew to 7.05 million in February from 6.85 million in the previous month. The labour force participation rate dropped to 62.4% while the employment-population ratio declined to 59.9% in February.

  • UK: The unemployment rate in the United Kingdom remained steady at 4.4% in January 2025, in line with market expectations. With this, unemployment remained at the highest level for the third consecutive month as the number of individuals unemployed for up to 12 months increased. The economic activity rate remained unchanged at 21.5%.

  • Canada: The unemployment rate in Canada remained unchanged at 6.6% in February but came in below market expectations of 6.7%. The number of unemployed individuals decreased to 1.4 million in February from 1.5 million in the previous month. The labour force participation rate dropped to 63.5%.
  • China: The unemployment rate in China came in higher at 5.4% in February compared to the January’s reading of 5.2% and market estimates of 5.1%. This is the highest unemployment rate since February 2023. The jobless rate for local registered residents stood at 5.6%, non-local registrants at 5%, and for non-local agricultural registrants at 5.1%.
  • Japan: The unemployment rate softened to 2.4% in February compared to 2.5% in January and against the market forecasts of no change. The number of unemployed individuals fell by 3.4% to 1.68 million in February, while the number of employed individuals also declined by 0.2% to 68.16 million. The non-seasonally adjusted labour force participation rate stood at 63.2% in February. The jobs-to-applications ratio fell to 1.24 in the month under study from 1.26 in the previous month.
  • Euro: The unemployment rate in the Euro Area decreased to a new low of 6.1% in February compared to market consensus and January`s reading of 6.2%. The number of unemployed individuals decreased by 70,000 MoM to 10.5 million.

Inflation readings

  • US: The inflation rate in the US edged down to 2.8% YoY in February from 3% in January. It was lower than the consensus estimates of 2.9%. The decline is attributed to the fall in energy costs (0.2% YoY) led by lower gasoline and fuel oil prices. Moreover, inflation for shelter, used cars and trucks, and transportation slowed down during the month Annual core inflation declined to 3.1% (compared to 3.3% in the previous month), which is the lowest since April 2021.

  • Eurozone: The consumer price inflation in the Euro Area fell to 2.3% YoY in February from 2.5% in January and below the market forecast of 2.4%. Factors that contributed to the decrease include services (3.7% vs. 3.9% in January) and energy (0.2% vs. 1.9%). Moreover, core inflation, which excludes volatile food and energy prices, eased to 2.6%, its lowest level since January 2022.
  • UK: The annual inflation rate in the UK eased to 2.8% YoY in February from 3% in January and lower than the expectations of 2.9%. The largest contributor towards this decline came from prices of clothing that fell for the first time since October 2021. Core inflation, which excludes volatile energy, food, alcohol, and tobacco prices, fell to 3.5% YoY in February from 3.7% in January.
  • China: China recorded a deflation of 0.7% YoY exceeding market estimate of a 0.5% deflation and reversing January`s inflation of 0.5%. This is the first deflation since January 2024 amid fading seasonal effects from the Spring Festival in late January. Food prices, mainly pork, and fresh vegetables fell sharply. Core inflation dropped 0.1% in February compared to a 0.6% rise in January.
  • Japan: Japan’s annual inflation shrank to 3.7% YoY in February from a 2-year high of 4% in January. The fall is led by the sharp decline in prices of electricity and gas. Furthermore, inflation softened for healthcare, recreation, and miscellaneous items. The core inflation rate fell to 3.0% in February from January’s 3.2%.

Consumer confidence

  • US: The consumer confidence dimmed further to 92.9 in March 2025 from 98.3 in February and came in lower than the forecast of 94.2. This 7.2-point contraction marks the 4th consecutive month of decline. In February, consumer views about the future business conditions and income fell to the lowest level. Moreover, the index that measures future expectations dropped 9.6 points to 65.2, the lowest reading in 12 years below the 80-level, indicating possibility of a recession ahead.
  • UK: The GfK consumer confidence index in the UK grew by 1 point to -19 in March 2025, making it the second consecutive monthly increase. While the improvement in the consumer confidence exceeded market expectations of -21, it remained in the negative area reflecting caution by the consumers.
  • Euro: The consumer confidence in the Euro Area declined by 0.9 points to -14.5 in March 2025, the lowest in 3 months and in line with the initial estimates. This decline is fuelled by pessimism about future economic and financial situation while there was a slight improvement in consumers intent to make major purchases.

Balance of Trade

  • US: The US reported an all-time high trade deficit of US$131.4 billion in January 2025 from US$98.1 billion in December 2024 (revised), surpassing the forecast of US$127.4 billion. Imports grew 10% to a record high of US$401.2 billion in anticipation of upcoming tariffs while exports increased 1.2% to US$269.8 billion.
  • UK: The UK’s trade deficit fell to £0.60 billion in January 2025 from £3.18 billion in December. It is the smallest trade gap since September. Exports grew 3.6% MoM to a 5-month high of £75.68 billion while imports were up 0.1% MoM to £76.28 billion.
  • Japan: Japan’s trade balance shifted to a surplus of JPY 584.5 billion in February compared to a deficit of JPY 415.43 billion in January, falling short of market estimates of a JPY 722.8 billion surplus. This reversal is driven by 11% YoY increase in exports to JPY 9,191.14 billion, while imports fell 0.7% YoY to JPY 8,606.63 billion.
  • China: China`s trade surplus increased to US$170.52 billion in January-February 2025 period from US$104.84 billion in December. This sharp increase was driven by imports that fell 8.4% YoY, while the exports grew 2.3% YoY.


Disclaimer: The information provided in this article is for general informational purposes only and is not an investment, financial, legal or tax advice. While every effort has been made to ensure the accuracy and reliability of the content, the author or publisher does not guarantee the completeness, accuracy, or timeliness of the information. Readers are advised to verify any information before making decisions based on it. The opinions expressed are solely those of the author and do not necessarily reflect the views or opinions of any organization or entity mentioned.

DATE
March 6, 2025
PLACE
Mumbai
READING TIME
10 mins

The Pulse – A monthly digest of key macroeconomic events (February 2025)

“There is no change in RBI’s approach. It does not look at any price level or band. It is our endeavour to curb excessive volatility. We should not be looking at daily movement or exchange rate.” – Sanjay Malhotra, RBI Governor on the depreciation of INR


Executive Summary

Last month saw risk-off moves and a relief rally in US treasuries, with the US 10-year treasury down by about 50 basis points (bps) from the highs in January this year. A weaker set of data points including soft consumer confidence surveys aided the move lower in yields. US curves echo the bleaker outlook developing around the US economy with tariffs still in play, however, with tariffs still in play higher inflation cannot be ruled out. For now, a weaker economic outlook is weighing on the yield curves.

On the domestic front, the Reserve Bank of India (RBI) Monetary Policy Committee reduced rates unanimously by 25 bps as was widely expected, maintaining a ‘Neutral’ stance and no specific liquidity measures. On the currency front, RBI maintained that the central bank is committed to smoothening the excessive volatility and does not target any specific levels. Later, through the month, the chatter of heavy intervention in the currency market saw some respite to the otherwise unidirectional upward movement in INR this year. A weaker Balance of Payment outlook with relentless FPI outflow continues to weigh on currency at the moment.

Domestic Updates

India’s retail inflation moderates to 5-month low, wholesale inflation abates

The retail inflation, measured by the change in the Consumer Price Index (CPI), fell to a 5-month low of 4.31% YoY in January 2025 from 5.22% YoY in December. This is attributable to food inflation that hit a record low of 6.02% YoY in January since August. Vegetable inflation more than halved to 11.35% YoY in January from 26.56% YoY in December contributing majorly towards the declaration of food inflation.

Inflation based on the wholesale price index (WPI) marginally declined to 2.31% YoY in January 2025 from 2.37% YoY in December because of a correction in inflation for primary articles along with fuel and power. Inflation for primary articles went down to 4.69% YoY in January from 6.02% YoY in December as food prices dropped while the inflation for fuel and power slowed to 2.78% YoY in January from 3.79% YoY in December.

Meanwhile, retail inflation for farm and rural workers softened further to 4.61% YoY and 4.73% in January 2025, respectively, from 5.01% YoY and 5.05% in the previous month. The retail inflation for farm and rural workers in January 2025 is the lowest since November 2021.
The retail inflation for industrial workers (IW) measured by the CPI-IW, eased slightly to 3.53% in December from 3.88% in November.
India’s industrial output growth slows to a 3-month low

The growth in India’s industrial output, as measured by the Index of Industrial Production (IIP), slowed to a 3-month low of 3.2% in December from 5% in November. The manufacturing sector output (largest in the IIP basket) grew 3% in December compared to 5.5% in November. The mining and electricity output grew 2.6% and 6.2%, respectively, in December.

RBI cuts repo rate for the first time in nearly 5 years

The RBI cut its repo rate, the rate at which the central bank lends to other banks, by 25 basis points (bps) to 6.25% for the first time in nearly 5 years (since May 2020). The earlier rate has been kept unchanged for 11 straight policy meetings. The last time the RBI cut rate was during the Covid-19 pandemic by 40 bps to 4%. In the latest meeting, all six members of the monetary policy committee (MPC) voted to cut the rate and maintain the monetary policy stance at “neutral” considering the easing of inflation towards the medium-term target of 4% and the need to support the sluggish economy. India’s real GDP growth declined to a 7-quarter low of 5.4% in July-September against RBI’s projection of 7%. The Economic Survey 2025 estimated a growth of 6.4% in FY25, 20 bps lower than the RBI projection in its previous policy.

Following are the revisions in real GDP growth and Inflation forecasts announced by the MPC:
India records highest GST collections since April 2024

India’s GST collection grew 12.3% YoY to INR 1.96 lakh crore in January 2025. This number marks the highest GST revenue since April 2024. The top five states by collection remained the same, compared to the prior month, with Maharashtra recording the highest collection (INR 32,335 crore) followed by Karnataka (INR 14,353 crore), Gujarat (INR 12,135 crore), Tamil Nadu (INR 11,496 crore), and Haryana (INR 10,284 crore). Net GST revenue grew 10.9% YoY to 1.72 lakh crore in January 2025.

India’s real GDP growth rebounds in Q3 FY25

India’s real GDP grew 6.2% in Q3 FY25, recovering from the 7-quarter low of 5.6% YoY in Q2 FY25. However, the growth is lower than the RBI’s estimate of 6.8%. The uptick was driven by an increase in government and private consumption along with a sharp increase in exports during the quarter. Moreover, the growth in the gross value added (GVA) of the agricultural sector stood at a 6-quarter high of 5.6% due to strong kharif harvest and better rabi sowing trends. The industrial sector recorded slower growth with mining, manufacturing, and construction growing at 1.4%, 3.5%, and 7%, respectively. The services sector remained a key driver of growth with trade, hotels, transport, and communication services rising by 6.7% and public administration, defence, and other services growing by 8.8%.

India’s trade deficit widens

India’s merchandise trade deficit, the gap between imports and exports, increased moderately to US$22.9 billion in January 2025 from US$21.9 billion in December. Merchandise exports fell 2.4% YoY to US$36.43 billion while imports surged 10.3% to US$59.42 billion. In the April 2024 – January 2025 period, imports rose 7.4% YoY while exports grew 1.4% YoY.

India’s unemployment rate improves

The unemployment rate in India fell to 8.1% in January 2025 from 8.3% in December, according to the survey by the Centre for Monitoring Indian Economy (CMIE). In January 2025, rural unemployment was at 7.7% while urban unemployment stood at 8.4%.

India’s forex reserves jump to a 2-month high

India’s foreign exchange reserves rose by US$4.76 billion to a 2-month high of US$640.48 billion as of February 21. The contributor to this growth is Foreign Currency Assets (FCAs), a major component of the forex reserves, which grew by US$4.25 billion to US$543.84 billion. Moreover, in the reported week, gold reserves went up by US$426 million to US$74.58 billion, as per RBI.

Cotton production expects to dip

The Cotton Association of India (CAI) forecasted that the cotton output for the 2024-25 season would decline by 7.8% to 301.75 lakh bales from 327.45 lakh bales in the previous season due to lower yields in Gujarat, Punjab, and Haryana. Cotton exports in the current season are estimated to decline 40% to 17 lakh bales against 28.36 lakh bales estimated for the 2023-24 season.

India’s direct tax collection slows down

The growth in India’s net direct tax collection decelerated to 14.69% YoY (to INR 17.8 lakh crore) in February 2025 from 15.88% as of January, according to the latest data released by the income tax department. The gross direct tax collections went up 19.06% to INR 21.88 lakh crore in 11M FY25 from INR 20.64 lakh crore in 11M FY24. During the same period, corporate tax collection was at INR 7.8 lakh crore, while Securities Transaction Tax (STT) collection, a component of direct tax, stood at INR 49,201 crore (65% growth YoY).

Passenger vehicle sales surge

Total passenger vehicle (PV) sales in India rose 15.5% YoY to 465,920 units in January 2025 from 293,465 units in December, as per the data from the Federation of Automobile Dealers Association (FADA). The auto dealers attribute this surge to buyers postponing their purchases until January 2025 to take advantage of new models with upgraded features, better pricing, and other potential incentives in the new year. The other categories began the year on a promising note too – 2-wheeler sales were up 4.2% YoY, the 3-wheeler segment grew 6.6%, commercial vehicle sales increased 8.2%, and the tractor segment increased 5% YoY in January.

Global Update Roundups

Monetary Policies

  • UK: The Bank of England (BoE) MPC announced a 25-bps cut in its benchmark rate to 4.5% in a 7-2 majority vote. This is the third time since 2020, that the central bank cut its benchmark rates in an effort to boost the sluggish economy despite elevated inflation levels. This marks the third rate cut since the easing cycle began in August 2024. In the fourth quarter ended December 2024, UK’s consumer price inflation stood at 2.5%, above the central bank target of 2% mainly due to higher fuel prices. Investors are pricing at least three quarter-point cuts by the end of 2025.
  • Australia: The Reserve Bank of Australia (RBA) announced its first rate cut since the pandemic joining central banks of other developed countries like the US and UK in the rate cut cycle. It has reduced interest rates by 25 bps to 4.1%. The RBA Governor Michele Bullock attributed the cut to subsiding inflation (last reported at 3.2%) and to support “subdued growth in private demand”.

Trump raised import tariffs on steel and aluminium

US President Donald Trump announced raising import tariffs on steel and aluminium to a flat 25% “without exceptions or exemptions”. It will apply to imports from Canada, Brazil, Mexico, South Korea, and other countries that had been entering the U.S. duty-free. As per White House officials, the tariff will be effective from the beginning of March. The US president stated that it will impose reciprocal tariffs on all countries that impose duties on U.S. goods, and he is also looking at tariffs on cars, semiconductors, and pharmaceuticals.

GDP growth

  • US: The second estimate of the Bureau of Economic Analysis suggested growth in the US economy at an annualised rate of 2.3% in the fourth calendar quarter of 2024, which is lower than the previous quarter’s growth of 3.1%. The slowdown in growth is expected to be caused by the weakening of exports and a slowdown in business investments. In 2024, the US GDP growth is pegged at 2.8%, slightly lower than 2.9% in 2023.

  • Japan: Japan’s economy grew 0.7% quarter-on-quarter in the fourth quarter of calendar year 2024 versus the previous quarter’s 0.4%, exceeding market expectations of 0.3%. This translated into an annualized growth of 2.8%, up from 1.7% in the previous quarter. The improvement is led by growth in private consumption, which recorded a QoQ growth of 0.1% against the expectations of a 0.3% contraction.

Unemployment

  • US: Unemployment rate in the US eased to 4% in January 2025 from 4.1% in December 2024, reaching its lowest level since May 2024 and below market expectations of 4.1%. This happened as the number of unemployed individuals declined by 37,000 to 6.85 million, while employment increased by 2,234 to 163.9 million. The labour force participation rate also rose to 62.6%.

  • UK: The unemployment rate in the United Kingdom remained steady at 4.4% in December 2024 compared to the prior month. With this, unemployment remained at the highest level in the full-year 2024 due to an increase in individuals unemployed for up to 12 months. It is also attributed to the economic activity rate that went down to 21.5% from 21.6% in the preceding period.

  • Canada: The unemployment rate in Canada eased to a 3-month low of 6.6% in January 2025 from 6.7% in December 2024 and came in below market expectations of 6.8%. The number of unemployed remained nearly unchanged from the previous month at 1.5 million. Net job additions were 76,000 during the month.

Inflation readings

  • US: The inflation rate in the US hardened to 3% YoY in January 2025 2.9% in December 2024 and exceeded the consensus estimates of 2.9%. The increase is attributed to the rise in energy costs (1% YoY) for the first time in 6 months led by higher gasoline, fuel oil, and natural gas prices. Increased prices of used cars and trucks and transportation also led to the rise.

  • Eurozone: The consumer price inflation in the Euro Area rose to a 6-month high of 2.5% YoY in January 2025. Factors that contributed to the increase include services (up 1.77 percentage points), food, alcohol & tobacco (up 0.45 pp), energy (up 0.18 pp), and non-energy industrial goods (up 0.12 pp).
  • UK: The annual inflation rate in the UK rose sharply to 3% YoY in January 2025 from 2.5% in December and surpassed expectations of 2.8%. Higher costs of food, non-alcoholic drinks, and air fares led to the rise. Core inflation, which excludes volatile energy, food, alcohol, and tobacco prices, increased 3.7% YoY in January from 3.2% in the previous month.
  • China: China’s annual inflation rate escalated to a 5-month high of 0.5% YoY in January 2025 from 0.1% in December, exceeding market expectations of 0.4%. The spike was driven by seasonal effects from the Lunar New Year. Food prices, mainly pork, and fresh vegetables, rose, while non-food prices, mainly housing, healthcare, and education quickened.
  • Japan: Japan’s annual inflation climbed to a 2-year high of 4.0% YoY in January 2025 from 3.6% in the previous month. The spike is led by the steepest rise in food prices in 15 months, elevated prices of electricity and gas, as well as upward pressure from housing, clothing, transport, furniture and household items, healthcare, recreation, and miscellaneous items.

Consumer confidence

  • US: Consumer confidence dropped sharply to 98.3 in February 2025 from a revised 105.3 in January and came in lower than the forecast of 102.7. This 7-point MoM drop is the biggest since August 2021. The decline is fuelled by pessimism about the future employment prospects, which worsened and reached a 10-month high followed by less optimism about future business conditions and income.
  • Japan: Japan’s consumer confidence index unpredictably fell to 35.0 in February 2025 from 35.2 in January and came in below the consensus of 35.7. It is the lowest reading since March 2023. The fall was driven by the weakened sentiment of almost all indicators – overall livelihood (31.9 vs. 32.2), income growth (39.7 vs. 39.9), and willingness to buy durable goods (27.2 vs. 27.5) while employment marginally grew 41.1 in February from 41.0 in January.
  • UK: The GfK consumer confidence index in the UK rose by 2 points to -20 in February 2025. The slight improvement is a result of optimism among the household about their personal finances and the broader economic outlook. All the five key measures that make the consumer confidence index, which is the relative level of past and future economic conditions including personal financial situation, the situation for major purchases, overall economic situation, and savings level, showed an uptick in February.
  • Euro: Consumer confidence in the Euro Area grew by 0.6 points to -13.6 in February 2025, the highest in 4 months and in line with the initial estimates. Consumers are more intent on making major purchases and their expectations from the economy have improved marginally.

Balance of Trade

  • US: The US trade deficit widened to US$98.4 billion in December 2024 from US$78.9 billion in November (revised), surpassing the forecast of US$96.6 billion. It’s the highest trade deficit reported since March 2022. Imports rose 3.5% to US$364.9 billion while exports declined 2.6% to US$266.5 billion. The goods deficit increased to US$123 billion while the services surplus declined to US$24.5 billion in December.
  • UK: The UK’s trade deficit declined to £2.82 billion in December from a downwardly revised £4.35 billion in November. It is the smallest trade deficit since September. Imports fell by 1.5% MoM to a 3-month low of £71.88 billion, while exports grew 0.7% to a 4-month high of £69.06 billion.
  • Japan: Japan reported a trade deficit of JPY 2,758.78 billion in January 2025 in sharp contrast to a trade surplus of JPY 130.94 billion in December, exceeding the market estimate of a JPY 2,100 billion deficit. Imports grew 16.7% YoY to JPY 10,622.52 billion, while exports rose 7.2% YoY to JPY 7,863.75 billion.


Disclaimer:

The details mentioned above are for information purposes only. The information provided is the basis of our understanding of the applicable laws and is not legal, tax, financial advice, or opinion and the same subject to change from time to time without intimation to the reader. The reader should independently seek advice from their lawyers/tax advisors in this regard. All liability with respect to actions taken or not taken based on the contents of this site are hereby expressly disclaimed.

DATE
February 6, 2025
PLACE
Mumbai
READING TIME
10 mins

The Pulse – A monthly digest of key macroeconomic events (January 2025)

“Interest rates are to asset prices what gravity is to the apple” – Warren Buffett


Executive Summary

The year 2025 had a volatile start with President Trump’s inauguration and tariffs in play. While tariffs weren’t levied on the first day as widely anticipated, they did eventually find their way through the month, though not by the same magnitude as part of his poll promises. Meanwhile, the US Fed stayed the course in the first meeting of the year, keeping rates unchanged. However, the central bank’s tone was perceived to be marginally on the hawkish side. The CPI reading was comforting for markets with headline in line with expectations and core CPI a tad softer. Treasuries rallied across the curve on the back of this from intra-month highs, and the dollar index also showed marginal retracement. Elsewhere, the European Central Bank (ECB) continued its rate cut path while the Indonesian Central Bank surprised with a cut with a focus on growth and Japan hiked. With uncertainty around US policies, markets will likely remain volatile in the near future.

On the domestic front, the Reserve Bank of India (RBI) came up with measures to ease the system liquidity deficit, including Open Market Operations, FX Swaps, and VRR auctions. The consumer price inflation (CPI) moderated, while Index of Industrial Production (IIP) data came in stronger, with improvements across segments. On the currency side, strong depreciation pressures on INR were noted after an extended period of calm earlier in 2024, stemming from stronger USD, weaker balance of payments (BoP), with stress on capital account balance on the back of non-stop foreign portfolio investors (FPI) withdrawals from the equity segment. A large part of the pressure on the currency is on account of the stronger USD, with INR finally catching up to its emerging market peers. The new RBI regime also seems to be more comfortable with some volatility in the currency pair as opposed to the previous regime which kept the pair in a tight range with a weaker BoP position and continued strength in the dollar index.

Domestic Updates

India’s retail inflation abates to 4-month low, wholesale inflation rises

The retail inflation in India, measured as a change in the Consumer Price Index (CPI), moderated to a 4-month low of 5.22% YoY in December from 5.48% YoY in November. This is attributable to food inflation that declined to a 4-month low of 8.39% YoY in December from 9.04% YoY in November. Vegetable inflation, that contributes significantly to the food inflation, also fell to 26.56% in December from 29.33% YoY in November.

Inflation based on the wholesale price index (WPI) rose to a 6-month high of 2.37% YoY in December from 1.89% YoY in November. The rise is attributed to higher inflation for primary articles (which includes food articles, non-food articles, and minerals) to 6.02% in December from 5.49% in November, while inflation for the manufacturing segment edged up 2.14% in December from 2% in November.

Meanwhile, retail inflation for farm and rural workers softened further to 5.01% YoY and 5.05% in December, respectively, from 5.35% YoY and 5.47% in the previous month.
The retail inflation for industrial workers (IW), measured by the CPI-IW, fell to 3.88% in November from 4.41% in October.
India’s industrial output growth accelerates to a 6-month high

India’s industrial output, as measured by the Index of Industrial Production (IIP), rose to a 6-month high of 5.2% in November from 3.5% in October. All three sectors in the IIP basket Manufacturing, Mining and Electricity contributed towards this growth. Manufacturing sector output grew 5.8%, while mining, and electricity output witnessed a growth of 1.9% and 4.4% respectively in November.

Centre’s GST collections shrink

India’s GST collections in December declined to a 3-month low of INR 1.77 lakh crore but increased 7.3% YoY. Among the states, Maharashtra recorded the highest collection (INR 29,260 crore) followed by Karnataka (INR 12,526 crore), Tamil Nadu (INR 10,956 crore), Gujarat (INR 10,279 crore), and Haryana (INR 10,403 crore). Net GST collections grew by 3.3% to INR 1.54 lakh crore in December 2024 from INR 1.49 lakh crore in December 2023.

NSO expects slowdown in India’s GDP growth

Indian economy is estimated to grow at 6.4% in FY25, significantly lower than 8.2% in FY24 as per the first advance estimate by the National Statistics Office (NSO) and Ministry of Statistics & Programme Implementation (MoSPI). The expected slowdown in the economy could be attributed to stagnation in investments and moderation in manufacturing. This estimate is lower than the RBI`s projection of 6.6% for FY25. Despite the 7-quarter low GDP growth of 5.4% in the July-September quarter, the government expects agricultural and industrial growth to pick up along with an increase in rural demand to achieve the targeted growth by FY25.

Unified Pension Scheme – an improvement over existing National Pension System

The central government of India has launched a Unified Pension Scheme (UPS) for central government employees covered under the National Pension System (NPS) effective from April 1, 2025. The employees have an option to choose UPS or stay with the existing NPS, however, once they opt for UPS, they won’t be able to switch back. UPS is designed to provide financial stability to government employees after their retirement with a guaranteed pension and an inflation cover.

No GST on penalties imposed by banks and NBFCs

The Central Board of Indirect Taxes and Customs (CBIC) stated that non-compliance charges levied by banks and NBFCs are to prevent breaches and not compensation against the loss. Hence, penal charges imposed by banks and NBFCs on non-compliance by borrowers fall outside the scope of taxable services and will not be taxed at 18% GST.

India’s trade deficit abates

India’s merchandise trade deficit narrowed to a 3-month low of US$21.9 billion in December 2024 from US$32.8 billion in November driven by ~50% drop in gold imports. Merchandise exports contracted by 1% YoY to US$38.01 billion while imports grew 4.9% YoY to US$59.95 billion. In April-December 2024, imports rose 5.1% YoY while exports grew 1.6%.

India’s unemployment rate worsens but not unusual for December

The unemployment rate in India increased to 8.3% in December from 8% in November, according to the survey by the Centre for Monitoring Indian Economy (CMIE). The rise is not unusual as unemployment rises every December due to a lean period. However, the rate in December 2024 is lower compared to December 2023. Moreover, urban unemployment has decreased to 6.4% in Q2 FY25 from 6.6% in Q2 FY24 while both the Labour Force Participation Rate (LFPR) and Worker-to-Population Ratio (WPR) have increased during this time, as per the 2023-24 annual Periodic Labour Force Survey (PLFS) report.

India’s forex reserves spike

India’s foreign exchange reserves increased to US$629.55 billion as of 24th January following a 7-week decline, as the rupee strengthened by 0.5% due to forex market interventions by the Reserve Bank of India. The surge in reserves by US$5.5 billion during the week marks the highest in the last 4 months. The primary contributor towards this growth is the foreign currency assets (FCAs) that grew US$4.7 billion to US$$537.89 billion in the period. Moreover, in the reported week, gold reserves went up by US$704 million to US$69.65 billion, as per RBI data.

India’s direct tax collection surges in FY25

During the April 1, 2024 — January 12, 2025, India’s net direct tax collection grew 16% to INR 16.9 lakh crore, according to the latest data from the Central Board of Direct Taxes. The gross direct tax collections were up by 20% to INR 20.64 lakh crore from INR 17.21 lakh crore. Corporate tax collection stood at INR 7.7 lakh crore in the same period, while Securities Transaction Tax (STT) collection, a component of direct tax, stood at INR 44,500 crore (75% growth YoY).

Passenger vehicle sales declines

Total passenger vehicle sales in India fell 2% YoY to 293,465 units in December 2024 from 321,943 units in November, as per the data from the Federation of Automobile Dealers Association (FADA). The decline is attributed to limited launches and deferment of purchases by buyers to January. All other categories witnessed a slowdown – 2-wheeler sales declined 17.6% YoY, 3-wheeler fell 4.5%, and commercial vehicles decreased 5.2%, except the tractor segment which registered a growth of 25.7% YoY.

Global Update Roundups

Monetary Policies

  • US: The US Federal Reserve held its key interest rates steady pausing its rate-cutting cycle after three consecutive reductions in 2024. The overnight borrowing rate is kept unchanged in a range between 4.25%-4.5%, which is in line with expectations. In the post-meeting comment, the Fed justified the stance with an optimistic view on the labour market while avoiding the key reference of inflation progressing towards the central bank’s 2% goal. The Fed Chair Jerome Powell said, “We feel like we don’t need to be in a hurry to make any adjustments,” adding that decisions will remain data-driven.
  • Euro zone: The European Central Bank (ECB) cut its key interest rate by 25 bps to 2.75%, in line with the expectations, amid an uncertain economic outlook. This marks the fourth consecutive cut to the eurozone deposit rate in a unanimous decision. In its press release, ECB said, “The disinflation process is well on track. Inflation has continued to develop broadly in line with the staff projections and is set to return to the governing council’s 2% medium-term target in the course of this year”.
  • Japan: The Bank of Japan (BoJ) raised its key short-term interest rate by 25 bps to 0.5%. The hike is in line with expectations but took the rate to the highest level in 17 years.  This was the 3rd rate hike by the central bank after ending the negative interest rate regime in March 2024. The move is led by momentum in wage hikes and steady progress in inflation.
  • Canada: The Bank of Canada cut its benchmark interest rates by 25 bps to 3%, which was in line with expectations. With this, the cumulative reduction was 200 bps since the start of the rate cut cycle in June 2024. This happens as the central bank saw inflation converging to the 2% target in recent months, a trend that is expected to continue for the next 2 years.
  • Indonesia: The Bank of Indonesia cut its benchmark interest rates by 25 bps to 5.75% in an unexpected move as it defied market expectations of a pause. The decision is backed by central bank’s commitment to control inflation in the target range of 2.5±1% for 2025 and 2026, stabilizing the domestic currency, and supporting economic growth amid global uncertainty.

GDP growth

  • US: The economic growth decelerated to an annualised rate of 2.3% in the fourth calendar quarter of 2024, down from the previous quarter’s growth of 3.1% and 2.6%, the advance estimate of the Bureau of Economic Analysis. While consumer spending increased for both goods (6.6% vs 5.6%) and services (3.1% vs 2.8%), there was a contraction in both exports (-0.8% vs 9.6%) and imports (-0.8% vs 10.7%). Government expenditure also had a sluggish growth of 2.5% vs 5.1% in the previous quarter.

  • China: The GDP growth accelerated to 5.4% YoY in Q4 2024 from 4.6% in Q3 2024, surpassing market estimates of 5%. This has been the strongest annual growth in 1.5 years driven by a series of measures implemented by the government since September to boost economic recovery. In December, exports grew double digits as businesses rushed to complete their shipment in anticipation of high tariffs under the Trump administration, while imports increased to a 27-month high.

IMF’s global growth prediction remains steady

The International Monetary Fund (IMF) kept their global growth projection for both FY25 and FY26 steady at 3.3% compared to their October 2024 World Economic Outlook (WEO) forecast. The estimate is lower than the historical (2000–19) average of 3.7%. The prediction for 2025 remained unchanged as the upward revision in US GDP offset the downward revision in other major economies. IMF expects global headline inflation to slow down to 4.2% in 2025 and 3.5% in 2026, due to faster disinflation with easing of supply-side pressures and restrictive monetary policies.

Unemployment

  • US: Unemployment rate in the US eased to 4.1% in December 2024 from 4.2% in the previous month and came in below the market expectations of 4.2%. The number of unemployed individuals decreased to 6.8 million in December from 7.1 million in the previous month. The labour force participation rate was steady at 62.5% in the month.

  • UK: The unemployment rate inched up to 4.4% in November from 4.3% in October and came in above the market estimate of 4.3%. This is the highest unemployment rate for three months as the number of individuals that were unemployed for up to 12 months increased to 1.77 million in November. On the other hand, employed individuals grew by 35,000 to 33.78 million driven by growth in full-time employment and self-employed workers.

  • Canada: The unemployment rate in Canada eased to 6.7% in December from the record high of 6.8% in November, defying the consensus estimates of 6.9%. The number of unemployed population declined by 24,200 to 1,492,100 while the joblessness among youth rose (+17,600 to 462,200) in December. The labour force participation rate remained unchanged at a 4-month high of 65.1%.
  • China: The unemployment rate in China increased to a 3-month high of 5.1% in December 2024 from market estimates and November’s reading of 5%. The jobless rate for local registered residents rose 0.1 percentage points (pp) to 5.3%, non-local registrants to 4.6%, and non-local agricultural registrants to 4.5%.
  • Japan: The unemployment rate softened to 2.4% in December 2024 compared to the market consensus and November’s readings of 2.5%. The number of unemployed individuals stood at 1.7 million in December. The non-seasonally adjusted labour force participation rate increased to 63.4% in December 2024 from 62.8% in December 2023. The jobs-to-applications ratio was steady at 1.25 in the month under study.
  • Euro: The unemployment rate in the Euro Area edged up to 6.3% in December (in line with market forecast) from a record low of 6.2% in November. The number of unemployed increased by 96,000 MoM to 10.8 million.

Inflation readings

  • US: Consumer price inflation in the US accelerated for the third consecutive month to 2.9% YoY in December from 2.7% in November. The inflation was in line with market expectations. The rise is attributable to low base effects owing to a lesser decline in energy costs (-0.5% vs -3.2% in November) and acceleration in inflation for food (2.5% vs 2.4%), transportation (7.3% vs 7.1%), and lesser fall in prices of new vehicles (-0.4% vs -0.7%).

  • Eurozone: The inflation rate in the Euro Area rose to a 5-month high of 2.4% YoY in December from 2.2% in November in line with both market expectations and preliminary estimates but decelerated from 2.9% in December 2023. Segment-wise contributors to inflation are services (4% in December vs 3.9% in November) and processed food, alcohol, and tobacco (2.9% vs 2.8%) which was offset by unprocessed food (1.6% vs 2.3%). Core inflation, which excludes prices for energy, food, alcohol & tobacco remained the same at 2.7%.
  • UK: The inflation rate in the UK unexpectedly moderated to 2.5% YoY in December from 2.6% in November, below the consensus estimates of 2.6%. The downward pressure majorly came from restaurants and hotels, recreation and communication, services, transport, and air fares. On the other hand, upward pressure on inflation mostly came from motor fuels, and housing and utilities. Inflation for food and non-alcoholic beverages remained unchanged.
  • China: China’s consumer inflation rate edged down to 0.1% YoY in December from 0.2% in November in line with the market estimates. This marked the lowest level since March 2024. The decline in food prices after rising consequently for the past 4 months is attributed to the fall in inflation.
  • Japan: The annual inflation rate in Japan escalated to 3.6% YoY in December, the highest reading since January 2023, from 2.9% in November. This hike was majorly driven by food prices (6.4% vs 4.8% in November) with vegetables and fresh food being the main contributor. Additional upward pressure came from electricity prices (18.7% vs 9.9%) and gas cost (5.6% vs 3.5%) as the subsidies have been discontinued since May.

Consumer confidence

  • US: The consumer confidence fell to a 4-month low of 104.1 in January 2025 from a revised 109.5 in December and came in lower than the forecast of 105.7. This decline is fuelled by pessimism on current and future business conditions. Moreover, consumers are feeling less optimism on labour market and employment.
  • Japan: Japan’s consumer confidence index marginally dropped to 35.2 in January 2025 from 36.2 in the previous month, below market expectations of 36.6. This is the lowest reading since September 2023. All sentiment indicators witnessed a decline – overall livelihood (32.2 vs 34.1), income growth (39.9 vs 40.2), employment (41.0 vs 41.2), and willingness to buy durable goods (27.5 vs 29.4).
  • UK: The GfK consumer confidence index in the UK fell by 5 points to -22 in January 2025, marking its lowest reading since November 2023. The decline is a sign of growing economic concerns as all the measures such as Personal Financial Situation in the last 12 months and the next 12 months, General Economic Situation in the last 12 months and the next 12 months, and Major Purchase Index that make up the Overall Index Score dropped compared to previous month. The government`s decision to raise taxes also impacted the reading.
  • Euro: The consumer confidence in the Euro Area rose by 0.3 points to -14.2 in January 2025, in line with the initial estimates. While the consumer confidence and their intention to make major purchases remained unchanged, their expectations from the economy improved marginally.

Balance of Trade

  • China: China’s trade surplus surged to US$104.84 billion in December from US$97.44 billion in November, surpassing expectations of US$99.80 billion. It’s the largest trade surplus reported since February 2024. Exports jumped 10.7% YoY, surpassing the estimate of 7.3% in anticipation of tariffs from the upcoming US administration. Imports also rose unexpectedly by 1% YoY in December recovering from a 3.9% fall in November.
  • UK: The UK’s trade deficit dropped to £4.76 billion in November from an upwardly revised £5.01 billion in October. Imports grew 0.6% MoM to a 5-month high of £72.79 billion, while exports grew 1% to a 4-month high of £68.03 billion.
  • Japan: Japan reported a trade surplus rose of JPY 130.94 billion in December compared to a deficit of JPY 110.3 billion in November, beating the forecast of a JPY 55 billion deficit. It’s the first trade surplus reported since June 2024 driven by an increase in exports compared to imports. Exports rose to a record high of JPY 9,910.60 billion, while imports increased to a 5-month high of JPY 9,779.67 billion.


Disclaimer:

The details mentioned above are for information purposes only. The information provided is the basis of our understanding of the applicable laws and is not legal, tax, financial advice, or opinion and the same subject to change from time to time without intimation to the reader. The reader should independently seek advice from their lawyers/tax advisors in this regard. All liability with respect to actions taken or not taken based on the contents of this site are hereby expressly disclaimed.

DATE
January 9, 2025
PLACE
Mumbai
READING TIME
10 mins

The Pulse – A monthly digest of key macroeconomic events (December 2024)

“In the last few years, we have traversed one of the most difficult periods in the history of the Indian economy and, perhaps, in the global economy…It was a period of relentless turbulence and jolts, and as a country we can derive satisfaction that the Indian economy has just not navigated this period of trials successfully but has emerged stronger.” — Shaktikanta Das, Former RBI Governor


Executive Summary

The US Fed delivered a hawkish 25 basis points (bps) cut this month, with the median dot plot rising by 50 bps for both 2025 and 2026, implying Fed members see lower rate cuts in the next two years. Chairman Powell’s tone was also hawkish during the press conference, with statements like “we are significantly closer to neutral” while saying that they would be cautious about further cuts. However, he also simultaneously noted that the policy is still sufficiently restrictive. Markets reacted with a steeper rate curve and stronger dollar index, with emerging market economies facing depreciation pressures as well. All eyes are on Trump resuming office this month, with markets anticipating tariff actions very soon. Uncertainty around policies will keep markets on edge and volatility is likely to continue. Elsewhere, the European Central Bank cut benchmark rates by another 25 bps while Japan maintained the status quo. With the slower rate cut expectations in the US in 2025 amidst a relatively stronger economy, interest rate differentials along with Trump’s expected policy measures will continue to favour stronger dollar trade.

On the domestic front, RBI MPC kept rates on hold with a 4-2 vote and maintained a Neutral stance. The MPC acknowledged the tightening liquidity conditions and cut the CRR rate by 50 bps to 4% to infuse INR 1.16 lakh crore liquidity into the banking system. MPC minutes showed increasing concerns about growth and with the regime change, markets are now expecting rate cuts starting February. On the forex front, INR saw depreciation pressures, largely on the back of a stronger dollar with most Asian currencies facing the heat. The central bank continued to smoothen the move. The forex reserves are down about 10% from the peak US$705 billion, a majority of which was spent to smoothen INR depreciation. Despite the drawdown, the currency buffer still remains strong and will help the central bank in containing volatility.

Domestic Updates

India’s retail inflation moderates closer to RBI’s upper band, wholesale inflation shrinks

The retail inflation in India, measured as a change in the Consumer Price Index (CPI), eased to a 3-month low of 5.48% YoY in November, returning to the RBI`s target band of 2-6% from 6.21% YoY in October 2024. The softening is attributed to food inflation, which accounts for ~40% of the overall basket and fell to a 3-month low of 9.04% YoY in November from 10.87% YoY in October. The significant decline in vegetable inflation from 42.18% YoY in October to 29.33% YoY in November mainly contributed to the declaration of food inflation.

Inflation based on the wholesale price index (WPI) slightly dropped to 1.89% YoY in November from a 3-month high of 2.36% in October. Inflation for primary articles softened to 5.49% in November from 8.09% in October, while inflation for the manufacturing segment further increased to 2% in November from 1.5% in October.

Meanwhile, retail inflation for farm and rural workers dipped to 5.35% YoY and 5.47% in November 2024, respectively, from 5.96% YoY and 6.00% in the previous month.
India’s industrial output rises led by manufacturing

India’s industrial output, as measured by the Index of Industrial Production (IIP), edged up to 3.5% in October from 3.1% in September. This increase was driven by the manufacturing sector output, which grew by 4.1% in October compared to 3.9% in September. The other core industries output, including mining and electricity, witnessed a moderate growth of 0.9% and 2%, respectively.

RBI MPC maintains status quo, cuts CRR

The Reserve Bank of India (RBI) kept the repo rate unchanged at 6.5% in its 5th bi-monthly monetary policy committee (MPC) meeting of FY25 with a 4:2 majority. With this, the benchmark rate has been kept unchanged for the 11th straight meeting. The MPC maintained its policy stance at ‘Neutral’, which allows flexibility to track the progress of inflation and growth and take appropriate actions when necessary.

The cash reserve ratio (CRR) was cut by 50 bps to 4% in response to ongoing liquidity stress in the banking system. The CRR reduction is expected to release INR 1.16 lakh crore into the banking system in 2 tranches and support credit growth and economic activity.

Following are the revisions in GDP growth and Inflation forecasts announced by the MPC:

RBI enhances limit for collateral free loan for farmers

In another move, the RBI has enhanced the collateral-free loan limit for farmers from INR 1.6 lakh to INR 2 lakh, effective January 1, 2025, in an effort to support small and marginal farmers amid rising input costs. As per RBI directives, banks across the country are asked to waive collateral and margin requirements for agricultural and allied activity loans up to INR 2 lakh per borrower.

Indian household debt surge, RBI FSR

According to the RBI’s Financial Stability Report (FSR), the debt of Indian households increased to 42.9% of GDP (at current market prices) in the second quarter of 2024 from 42.7% of GDP in the first quarter of 2024. However, as per RBI, it indicates a positive trend as the surge is primarily driven by an increase in the number of borrowers rather than a rise in average indebtedness per individual. As of March 2024, borrowing by individuals accounted for 91% of total household financial liabilities. Three main factors are identified for household borrowing: Consumption (personal loans, credit card debt, and loans for consumer durables), asset creation, and productive activities.

GST collections grew substantially

India’s GST collection grew 8.5% YoY to INR 1.82 lakh crore in November 2024. Among the states, Maharashtra had the top collection (INR 29,948 crore) followed by Karnataka (INR 13,722 crore), Gujarat (INR 12,192 crore), Tamil Nadu (INR 11,096 crore), and Haryana (INR 9,900 crore). For the April-November period, tax collections increased by 9.3% YoY to INR 14.57 lakh crore in FY25.

Finance Ministry of India, ADB projects India’s FY25 GDP growth at 6.5%

The Asian Development Bank (ADB) has revised India’s GDP growth forecast lower to 6.5% from its previous estimate of 7% due to lower-than-anticipated growth in private investment and housing demand. As per the multilateral development bank, changes in US trade, fiscal, and immigration policies could adversely impact growth and inflation in developing Asia and the Pacific.

The Finance Ministry of India in their Monthly Economic Review has projected economic growth at 6.5% in FY25 after a decline in growth from 6.7% in the April-June quarter to 5.4% in the July-September quarter, driven by gains in agricultural and industrial activities. The ministry’s outlook is also based on a favourable demand outlook in rural and urban areas in the initial months of H2FY25.

The Organisation for Economic Co-operation and Development (OECD) upgraded its growth forecast to 6.8% from its earlier estimate of 6.6% due to growth in investments and recovery in the agricultural sector.

India’s trade deficit reaches record high

India’s merchandise trade deficit rose to an all-time high of US$37.8 billion in November widening sharply from US$20.6 billion in November 2023. This was driven by a contraction in merchandise exports by 4.8% YoY to US$32.11 billion and a 27% YoY rise in imports to US$69.95 billion, which is an all-time high.

India’s unemployment rate abates

The unemployment rate in India fell from 8.7% in October to 8% in November, according to the survey by the Centre for Monitoring Indian Economy (CMIE). The labour force participation rate (LPR), which is measured as a percentage of the working-age population, fell from 41.2% in October to 40.8% in November suggesting that fewer people were actively looking for a job.

India’s forex reserves continue to decline

India’s foreign exchange reserves dropped by US$4.1 billion to a 3-month low of US$640.28 billion as of December 27. The major contributor to this decline is US$4.6 billion decline in Foreign Currency Assets (FCAs) to US$551.92 billion. This reduction in reserves is attributed to RBI’s efforts aimed at stabilising the depreciation of the Rupee.

Passenger vehicle sales nosedive

Total passenger vehicle sales in India decreased ~14% YoY to 321,943 units in November from 483,159 units in October, as per the data from the Federation of Automobile Dealers Association (FADA). The auto dealers attribute the decline to the shift of festive demand to October, weak market sentiment, and limited new launches. However, 2-wheeler sales grew 15.8% YoY due to rural demand and year-end offers while 3-wheeler sales witnessed a comparatively modest growth of 4.2% YoY in November.

Global Update Roundups

Monetary policies  

  • US: The US Federal Reserve cut the benchmark interest rate by a quarter percentage point, as expected while cautioning about additional cuts in 2025 that will depend on the progress in lowering stubbornly high inflation. The overnight borrowing rate has been reduced to a target range of 4.25%-4.5%, which is back to the level of December 2022. The dot plot matrix suggested that there could be only two more cuts in 2025. Over the longer term, the Federal Open Market Committee (FOMC) sees the “neutral” funds rate at 3%. The FOMC raised its GDP growth forecast for full-year 2024 by half a percentage point to 2.5%. However, the FOMC officials expect GDP growth to decelerate to 1.8% in the long term. Expectations for headline and core inflation were pegged at 2.4% and 2.8%, respectively, slightly higher than September estimates and above the Fed’s 2% target. The projection for the unemployment rate is lowered to 4.2% for 2024.
  • ECB: The European Central Bank (ECB) lowered the three key interest rates — deposit facility, the main refinancing operations, and the marginal lending facility — by 25 bps to 3%, 3.15%, and 3.4%, respectively, with effect from 18 December 2024. The rate cut, the fourth one in 2024, is based on the revised outlook on inflation trajectory and its dynamics as well as the strength of monetary policy transmission. Headline inflation averaged 2.4% in 2024 and is expected to be 2.1% in 2025, 1.9% in 2026, and 2.1% in 2027. The ECB expects inflation to settle near the Governing Council’s 2% medium-term target on a sustained basis. Secondly, financial conditions are easing with the gradual transmission of rate cuts making debt cheaper for firms and households. However, the transmission is yet to run its full course making the debt market still tight.
  • UK: The Bank of England’s Monetary Policy Committee (MPC) kept the benchmark bank rate unchanged at 4.75% in its December meeting in a majority vote of 6:3. This happens as the MPC adopts a medium-term outlook with a forward-looking approach to achieve the 2% inflation target on a sustainable basis. Since the previous meeting, the 12-month consumer price inflation rose to 2.6% in November from 1.7% in September, mainly driven by stronger inflation in core goods and food.
  • China: The People’s Bank of China kept the one-year medium-term lending facility (MLF) rate steady at 2% as it aims to stabilize the domestic currency that has come under pressure following Donald Trump’s victory. The offshore yuan has lost more than 2% since the U.S. presidential election on November 5 and roughly 3.3% against the USD since Sep 24 when Beijing started the initial round of stimulus announcements.
  • Japan: The Bank of Japan kept its benchmark interest rate unchanged at 0.25% in order to take more time to assess the impact of financial and foreign exchange markets on Japan’s economy. The decision was based on a majority decision vote of 8:1. “In particular, with firms’ behaviour shifting more toward raising wages and prices recently, exchange rate developments are, compared to the past, more likely to affect prices,” the bank added.

GDP growth

  • US: The GDP grew at an annualized rate of 3.1% in Q3CY24, surpassing the second estimate of 2.8% growth and the previous quarter growth of 3% growth recorded. The growth is driven by an acceleration in the pace of personal spending growth (3.7% vs 3.5% in the second estimate) driven by a robust increase in consumption of goods (5.6%) and spending on services (2.8%).

  • Japan: The growth in the economy decelerated to 1.2% YoY in Q3CY24 from 2.2% in Q2. However, the growth was higher than the consensus estimates of 0.9%. The sluggish growth is attributable to moderation in capex due to rising interest rates and softer government spending.
  • Euro Area: The GDP growth accelerated to 0.4% on a seasonally adjusted QoQ basis in Q3CY24 from 0.2% in Q2 and to 0.9% in Q3 from 0.5% rise in Q2 on an annual basis, marking the strongest growth since Q1CY23. The uptick was driven by a boost in private consumption (0.7% in Q3 vs no growth in Q2) aided by softer price pressure and a rebound in fixed investment (2% in Q3 vs -2.4% in Q2)
  • UK: The pace of growth in the British UK economy quickened to 0.9% YoY in Q3CY24 from 0.7% YoY in Q2CY24, marking the highest growth since Q1CY23. The improvement is led by household spending and gross fixed capital formation partially offset by a slower than expected rise in government spending.

Unemployment

  • US: The unemployment rate inched up to 4.2% in November from 4.1% in October and 3.7% in November 2023. The number of unemployed individuals stood at 7.1 million in the month, up from 6.3 million a year earlier. The labour force participation rate, which indicates the percentage of working-age individuals who are employed or actively looking for work, declined to 62.5% in the month.

  • Canada: The unemployment rate in Canada rose to the highest level since September 2021 at 6.8% in November from 6.5% in October and surpassed the market consensus of 6.6%. In absolute terms, the number of unemployed increased substantially by 87,300 to 1,516,300 in the month as joblessness rose among the youth, the core aged population, and the older population. The labour force participation rate rose to a 3-month high of 65.1%.
  • China: Unemployment in China remained unchanged at 5%, which is a 5-month low, meeting market expectations. The jobless rate for local registered residents rose 0.1 percentage points (pp) to 5.2%, non-local registrants to 4.6%, and non-local agricultural registrants to 4.4%.
  • Japan: Japan’s unemployment rate was 2.5% in November 2024, remaining steady for the second consecutive month. The non-seasonally adjusted labour force participation rate increased to 63.5% in November from 63.1% in November 2023. The jobs-to-applications ratio remained at its highest level in 6 months at 1.25 for the second consecutive month.
  • Euro: The unemployment rate remain unchanged at 6.3% in November for the second consecutive month. The number of unemployed decreased by 39,000 MoM and 333,000 YoY to 10.8 million.

Inflation readings

  • US: The inflation rate accelerated for the second month to 2.7% YoY in November 2024 from 2.6% in October. The persistent rise in wages leading to higher consumer spending is one of the main contributing factors to the rise in inflation. The core inflation, which excludes volatile food and energy costs, rose 3.3% YoY, the same as in the previous month. Over the past three months, the core CPI averaged 3.7% at an annualized rate. Segment-wise, food, energy, medical care, and recreation indices increased during the month.

  • Eurozone: The inflation rate accelerated to 2.2% YoY in November from 2% in October but decelerated from 2.4% in November 2023. Segment-wise, the largest contributors to inflation are services (+1.74 pp), food, alcohol & tobacco (+0.53 pp), non-energy industrial goods (+0.17 pp), and energy (-0.19 pp).
  • UK: The inflation rate in the UK accelerated for the second month to 2.6% in November from 2.3% in October, moving further beyond the central bank’s target (2%) but meeting the consensus estimates. It’s the highest inflation recorded in 8 months led by a faster pace of price rises of recreation and culture (3.6% vs 3% in October), housing and utilities (3% vs 2.9%), and food and non-alcoholic beverages (2% vs 1.9%).
  • China: China’s inflation slowed to 0.2% YoY in November from 0.3% in October, marking it the lowest level since June and the consensus estimates of 0.5%. The fall in inflation is attributed to a slowdown in food prices at 0.1% YoY. Non-food inflation bounced to 0% after two months of YoY deflation.
  • Japan: The inflation rate rose to the highest level since October 2023 at 2.9% YoY in November. It rose from 2.3% in October led by a steep rise in food prices (4.8% vs 3.5% in October). Also, it was led by an acceleration in prices of electricity (9.9% vs 4.0%) and gas prices (5.6% vs 3.5%) due to the absence of energy subsidies since May.

Consumer confidence

  • US: The consumer confidence index fell to 104.7 in December from an upwardly revised 112.8 in November reflecting pessimism on current business conditions. This decline is further fuelled by negative sentiments on labour market, particularly on job opportunities. Moreover, consumers were also less optimistic about the future business conditions.
  • Japan: The Japan’s consumer confidence index dropped to 36.2 in December from 36.4 in November, below the market forecast of 36.6. This was driven by a marginal decline in sentiment to buy durable goods (29.4 vs. 29.9 in November) and a weaker outlook on overall livelihood (34.1 vs. 34.3), partially offset by higher optimism about employment (41.2 vs. 41.0) and steady confidence in income growth (at 40.2).
  • UK: The GfK Consumer Confidence Index in the UK shows a minor improvement of 1 point from -18 in November to -17 in December, showing growth momentum for the second month in a row. However, the consumer sentiment on the UK`s economic outlook is still gloomy.
  • Euro: The consumer confidence fell 0.8 points to -14.5 in December from -13.7 in November, below the market expectations of -14. This marked the lowest reading since April 2024.

Balance of Trade

  • US: In November 2024, the trade deficit broadened to US$78.2 billion from US$73.6 billion in October (revised). Exports increased 2.7%, reaching a new high of US$273.4 billion, driven by vehicle sales, and sale of crude oils and petroleum products, among others. Imports grew 3.4% to US$351.6 billion in November driven by the purchase of semiconductors, food, beverages, crude oil, and gold, among others.
  • China: China’s trade surplus grew 40% to US$97.44 billion in November 2024 from US$69.45 billion in November 2023, surpassing the forecast of US$95 billion. Exports surged 6.7% YoY, below the estimate of 8.5% and slowing from October’s increase of 12.7% as manufacturers placed orders in advance in anticipation of higher tariffs from the US. Imports fell 3.9% YoY, falling further from 2.3% in October due to slower domestic demand.
  • UK: The UK’s trade deficit rose 7.5% to £3.72 billion in October from £3.46 billion in September. Imports grew 1.3% MoM to £72.60 billion, while exports grew 1.0% to £68.88 billion.


Disclaimer:

The details mentioned above are for information purposes only. The information provided is the basis of our understanding of the applicable laws and is not legal, tax, financial advice, or opinion and the same subject to change from time to time without intimation to the reader. The reader should independently seek advice from their lawyers/tax advisors in this regard. All liability with respect to actions taken or not taken based on the contents of this site are hereby expressly disclaimed.

DATE
December 5, 2024
PLACE
Mumbai
READING TIME
10 mins

The Pulse – A monthly digest of key macroeconomic events (November 2024)

“The economy is not sending any signals that we need to be in a hurry to lower rates.”— Jerome Powell, Federal Reserve Chair


Executive Summary

November saw Trump regain the US presidency in a Republican sweep while the Fed continued the rate-cut trajectory reducing interest rates by another 25 basis points (bps) after the 50-bps trim in September. Markets were relatively well braced this time for a Trump victory with US10-year treasury selling off by almost 70 bps ahead of the elections. Increased tariffs, and corporate tax cuts amongst other Trump’s election promises, if implemented, would certainly prove to be inflationary making it hard for the US Fed to keep cutting rates. Markets reduced rate cut expectations by about 100 bps and priced in the significant term premium. Currency markets saw sharp movements as well, with the dollar index rising almost 2% on election results. While US yields and the dollar index cooled off from intra-month highs, uncertainty for markets remains given Trump’s unpredictability and volatile temperament, as seen during his last presidential tenure. We have already started seeing tweets and rhetoric throughout the month and markets now await Trump’s inauguration and specific policies that he will implement and their likely spillovers to the rest of the world. Till then, speculation and volatility will remain the norm in the market. Elsewhere, the Bank of England reduced rates by 25 bps and ECB is expected to reduce by another 25 bps later this month.

On the domestic front, a couple of weak data prints puts RBI in a delicate situation. Inflation came in higher than expected at 6.2%, with the core inflation at sub-4%. On the growth front, headline GDP sharply fell to a two-year low of 5.4% versus expectations of a north of 6%. Elevated inflation, weaker growth, and a fragile global backdrop make the next policy decision tougher for RBI. Given the focus on inflation from the RBI governor that we have seen over the last couple of months, it seems that the central bank will stick to a status quo on rates. Liquidity conditions have tightened as well of late, largely on the back of aggressive foreign exchange (FX) intervention, and on that front, we might see some support from RBI’s MPC meeting. On the FX front, the Indian currency (INR) has performed significantly better than its peers, largely on the back of central bank intervention. FX reserves are down ~$48bn from the peak, a majority of which was utilized for smoothening INR depreciation. While domestic fundamentals still remain strong, INR will not remain aloof from the EM complex and any sharp deterioration there on the back of US policies will have a follow-on impact on INR, though may not by the same magnitude. Despite the drawdown, the currency chest still remains strong, and central bank will continue to smoothen any sharp depreciation pressures on it.

Domestic Updates

India’s retail inflation breaches the RBI`s tolerance band, wholesale inflation rises to a 4-month high

The retail inflation in India, which measures a change in the Consumer Price Index (CPI), rose to a 14-month high of 6.21% YoY in October 2024 from 5.49% YoY in September and 4.87% YoY in October 2023. The rise in retail inflation is attributable to food inflation which grew at a double-digit rate of 10.87% in October compared to 9.27% in September. Vegetable inflation (42.2% YoY in Oct vs. 36% YoY in Sep) and Oils and fats inflation (9.51% YoY in Oct vs. 2.47% YoY in Sep) have contributed majorly towards the spike in food inflation in October.

As the rise in retail inflation remains a concern, RBI Governor Shaktikanta Das stated that the shift in neutral monetary policy stance does not signal a potential rate cut. He further added that there are ‘significant upside risks to inflation’ and that a rate cut would only be considered if inflation is sustainably closer to the RBI’s medium-term target of 4%.

Meanwhile, the Finance Ministry’s Monthly Economic Review highlighted that, despite existing pressures on select food items, food inflation is expected to ease with the agriculture sector likely to benefit from strong kharif harvest, increase in minimum support prices, adequate inputs, and favourable monsoons in the coming months. However, India`s economic outlook could still be impacted by geopolitical factors.

Inflation based on the wholesale price index (WPI) jumped to a 4-month high of 2.36% YoY in October from 1.84% YoY in September due to an increase in two out of three major segments of WPI – Primary Articles, Fuel and Power, and Manufactured Products. Inflation for primary articles increased to 8.09% in October from 6.59% in September driven by an increase in food prices while the inflation for the manufacturing segment slightly moved up to 1.5% in October from 1% in September.

India’s industrial output shows renewed momentum

India’s industrial output, as measured by the Index of Industrial Production (IIP), returns to its upward trajectory at 3.1% in September after declining by 0.1% in August. The manufacturing sector (the largest in the IIP basket) is the main growth driver with an increase of 3.9% YoY. Electricity generation grew 0.5% YoY, while mining output increased 0.2% YoY.

India’s real GDP growth slips to 7-quarter low

India’s economic growth slowed to a two-year low at 5.4% YoY in Q2FY25 against 8.1% YoY in Q2FY24. Despite the fall, India remains the fastest-growing economy (China’s GDP growth in the July-September quarter was recorded at 4.6%). Gross Value Added (GVA) also moderated to 5.6% in Q2 from 6.8% in Q1.

Inflation played a significant role in the slowdown of India`s real GDP growth. The surge in retail food inflation reduced the capacity of consumer spending. The deceleration is also attributed to the slowdown in all sectors except agriculture which stood at a 5-quarter high of 3.5%. Consumption and investment demand slowed down in the second quarter of FY25. However, consumption is expected to have picked up with the festive rural spending and upcoming wedding season in the third quarter of the fiscal year.

Gross FDI inflows grew 43% YoY in Q2FY25

Gross Foreign direct investment (FDI) in India surged 43% YoY to US$13.6 billion in July-September 2024 from US$9.52 billion in July-September 2023. Total FDI including equity inflows, reinvested earnings and other capital grew 28% YoY to US$42.1 billion in H1FY25. However, net FDI moderated to US$3.6 billion in H1FY25 from US$3.9 billion in H1FY24. In the July-September quarter, about 50% of inwards investments came from Singapore.

India’s trade deficit narrows

India’s merchandise trade deficit rose to a 2-month high of US$27.1 billion in October but narrowed on a year-over-year basis from US$30.4 billion in October 2023. This happened as the merchandise trade exports grew 17.3% YoY to US$39.2 billion while Imports rose ~4% YoY to $66.34 billion, which is an all-time high.

Unemployment rate surpasses 10% for first time in over 2 years

The unemployment rate surged to 10.1% in October from 7.1% in September, according to the survey by the Centre for Monitoring Indian Economy (CMIE). It’s the first time in 29 months the rate has surpassed 10%. As per CMIE, the rate generally remains high in October but it’s significantly high this year, which is attributable to a spike in rural unemployment from 6.2% in September to 10.8% in October. Urban employment went down to 8.4% in the month.

India’s forex reserves dip to 2-month low

India’s foreign exchange reserves dropped by US$2.7 billion to a 2-month low of US$682.13 billion on November 1. It was the fifth consecutive week of decline taking the previous four weeks’ decline to US$20.1 billion. The decline is attributed to RBI’s support to rupee amid foreign capital outflows amid geopolitical tensions and rise in demand for Chinese assets after Beijing’s stimulus measures.

New credit guarantee scheme for MSMEs

The Centre launched a new credit guarantee scheme for MSMEs, offering collateral-free loans of up to Rs 100 crore. Under the scheme, banks would use their own credit assessments instead of seeking third-party guarantees. The move is led by long-standing challenges to secure finances by MSMEs, mainly for term loans to purchase plant and machinery. The Centre also announced plans to open branches of the Small Industries Development Bank of India (SIDBI) in every MSME cluster across India in 2-3 years, with ~25 branches coming up this financial year.

Passenger Vehicle sales surge to highest-ever October print

Total passenger vehicle (PV) sales in India rose 0.9% YoY to its highest-ever October sales of 393,238 units, as per data from the Society of Indian Automobile Manufacturers (SIAM). This growth is fuelled by strong consumer demand during the festive season.

According to data from the Federation of Automobile Dealers Association (FADA), which shows actual retail sales from showrooms versus the SIAM, which puts out dispatches to dealers from auto factories, passenger vehicle sales grew by 32.4% YoY in October to 483,159 units. The growth is mainly driven by the rural market, especially in 2-wheeler and PV segments, supported by higher Minimum Support Price (MSP) for rabi crops. Two-wheelers saw an impressive growth of 36.3% YoY while 3-wheelers witnessed a comparatively modest growth of 11.5% YoY in October. In the 2-wheeler segment, good crop yields, favourable rural sentiments, and the upcoming wedding season are expected to drive demand, as per FADA.

Global Update Roundups

Monetary policies 

  • US: The Federal Reserve cut the benchmark overnight borrowing rate by 25 basis points (bps) to a target range of 4.50%-4.75%, as widely expected by the market, in a unanimous vote. This followed the Fed’s more aggressive 50 bps cut announced this September for the first time since 2020. The overnight rate affects consumer debt instruments such as mortgages, credit cards, and auto loans. The rate cuts are a result of inflation drifting back to the central bank’s 2% target and labour market showing indications of softening. It’s a “recalibrating” policy back to a state where it no longer needs to be restrictive as Fed Chair Jerome Powell has earlier mentioned.
  • UK: The Bank of England (BoE) cut its benchmark interest rates for the second time since 2020, lowering them by 25 bps to 4.75%. However, the central bank indicated that the future reductions would be gradual (investors believe it could be slower than the European Central Bank) due to the new government’s first budget which is likely to have an upside impact on inflation causing it to take more time than expected to reach the central bank target of 2%.
  • Japan: The Bank of Japan (BoJ) retained the short-term interest rates steady at 0.25% as widely expected. However, the central bank indicated that interest rates may rise given the subsiding risks in the US economy. It projected inflation to hover around its 2% target in coming years.

GDP growth

  • US: The US GDP grew at an annualized pace of 2.8% in the third quarter of the calendar year, the second estimate of the Bureau of Economic Analysis revealed. The final estimate is due on December 19. The growth is said to be driven by strong growth in consumer spending (3.5%), which accounts for ~70% of US economic activity, and a 7.5% surge in exports, which is the most in 2 years.

  • UK: The UK GDP grew 0.1% QoQ as per the preliminary estimate. It is the smallest growth rate in three quarters, indicating a slowdown in the economy. The service sector growth came in at only 0.1%, while the production sector declined by 0.2% due to a 2.7% decline in electricity, gas, steam, and air conditioning supply. The UK economy expanded 1% YoY in Q32024, as per preliminary estimates, above 0.7% in Q22024.

Unemployment

  • US: The unemployment rate remained unchanged at the 3-month low of 4.1% in October compared to the previous month after declining from the 12-month peak of 4.3% in July 2024. The number of unemployed individuals was unchanged at 7 million while permanent job losers rose slightly to 1.8 million.

  • Canada: The unemployment rate in Canada remained unchanged at 6.5% in October compared to the prior month and hovered around the 12-month high of 6.6% recorded in August 2024. The unemployed population increased by 900 people to 1,429,000 while joblessness dipped steeply for the youth (-20,800 to 403,400). The labour force participation rate eased by 0.1 percentage points MoM to 64.8%.
  • China: Unemployment in China declined to a 4-month low of 5% in October (below market estimates of 5.1%) from 5.1% in September. The jobless rate for locally registered residents declined by 0.1 percentage point to 5.1% in the month while the same for non-local registrants and non-local agricultural registrants was 4.8% and 4.7%, respectively.
  • Japan: The unemployment rate rose 0.1 percentage point to 2.5% in October, worsening for the first time in 3 months as more people chose to stay in employment after reaching their retirement age. It is up from September’s 8-month low of 2.4%, meeting market expectations. The number of people who voluntarily left their jobs fell 5.4% to 700,000 while people who reached retirement age increased by 5.4% to 390,000.

Inflation readings

  • US: The inflation rate rose to 2.6% YoY in October 2024 from 2.4% in September due to a rise in shelter and food prices (4.9% and 2.1%, respectively) partially offset by a fall in energy prices (4.9%). The inflation was in line with market expectations. The core inflation was 3.3% YoY, which is the same compared to September. Meanwhile, the U.S. core PCE price index, the Federal Reserve’s key inflation metrics, rose by 2.8% YoY in October 2024, which is the highest in 6 months and in line with market estimates.

  • Eurozone: The inflation rate accelerated to 2% YoY in October from 1.7% in September. The biggest contributor to the inflation rate came from services (+1.77 percentage points), followed by food, alcohol & tobacco (+0.56 pp), and non-energy industrial goods (+0.13 pp).
  • UK: The inflation rate in the UK sharply accelerated beyond the central bank’s target (2%) to 2.3% in October from 1.7% in September and surpassed the consensus estimates of 2.2%. The uptick is attributed to an increase in the regulator-set energy price cap that took effect in October leading to high energy bills and price hikes in the dominant service sector.
  • China: The annual inflation rate declined to a 4-month low of 0.3% after peaking at 0.7% in February this year over the last 12 months. This happened as non-food prices continued to decline (-0.3% vs -0.2% in September), largely driven by further declines in the cost of transport (-4.8% vs -4.1%) and housing (-0.1% vs -0.1%).
  • Japan: The inflation rate dipped to 2.3% in October 2024 from 2.5% in the previous month, hitting its lowest level since January. The deceleration is attributed to prices of electricity (up 4.0% vs 15.2% in September), gas (3.5% vs 7.7%), furniture and household utensils (4.4% vs. 4.8%), culture (4.3% vs. 4.8%), and communication (-3.5% vs -2.6%) and education (-1.0% vs. -1.0%).

Consumer confidence

  • US: The consumer confidence index continued to improve and reached 111.7 in November compared with 109.6 in October. The monthly rise is driven by optimism about the labour market, particularly with respect to future job availability, which reached its highest level in nearly 3 years. However, consumers’ expectations about future business conditions were unchanged and they were slightly less optimistic about future income.
  • Japan: The consumer confidence index rose to 36.4 in November from October’s 5-month low of 36.2 and in line with market forecasts. This happened as household sentiment improved for income growth (40.2 vs 39.4 in September), willingness to buy durable goods (29.9 vs 29.7), and overall livelihood (34.3 vs 34.2).
  • UK: The GfK consumer confidence in the UK rose 3 points to -18 in November 2024, marking its first improvement in 3 months. The improvement is driven by lower interest rates, rising wages, and reduced concerns about tax hikes. The new government budget which unveiled a significant rise in spending, taxes, and borrowing also impacted the reading.
  • Euro: The consumer confidence in the Euro Area dipped 1.2 points to -13.7 in November. It came in below the long-term average and surpassed market expectations of -12.4.

Balance of Trade

  • US: The US trade deficit widened from US$70.8 billion in August (revised) to US$84.4 billion in September, surpassing the consensus estimates of US$84.1 billion. This happened as exports of goods and services fell US$3.2 billion, or 1.2%, and imports of goods and services increased US$10.3 billion, or 3%. The goods deficit increased from US$14.2 billion to US$109 billion while the services surplus rose US$600 million to US$24.6 billion.
  • China: China continued to report a trade surplus, which surged to US$95.3 billion in October 2024 from US$56.1 billion in the same period a year earlier. It’s the largest trade surplus reported since June this year. Exports jumped ~13% YoY as manufacturers began front-loading orders in anticipation of further tariffs from the US and the EU. Imports slipped 2.3% YoY due to weak domestic demand.
  • UK: The UK’s trade deficit widened to £3.46 billion in September from an upwardly revised £2.02 billion in August due to higher declines in exports than imports. Exports fell 5.8% MoM to a 28-month low of £68.20 billion while imports declined 3.7% MoM to a six-month low of £71.67 billion.


Disclaimer:

The details mentioned above are for information purposes only. The information provided is the basis of our understanding of the applicable laws and is not legal, tax, financial advice, or opinion and the same subject to change from time to time without intimation to the reader. The reader should independently seek advice from their lawyers/tax advisors in this regard. All liability with respect to actions taken or not taken based on the contents of this site are hereby expressly disclaimed.

DATE
November 7, 2024
PLACE
Mumbai
READING TIME
10 mins

The Pulse – A monthly digest of key macroeconomic events (October 2024)


“Change creates opportunities to grow, but it also creates opportunities to slip.”— Philip Fisher


Executive Summary

After the larger-than-expected rate cut of 50 basis points (bps) by the US Fed, markets braced for election impact as the yields corrected significantly throughout October ahead of the event risk and a stronger set of macro data prints. The US 10-year treasury moved up by ~75 bps from September lows as markets increasingly scaled down rate cut expectations from the Fed going forward. Elsewhere, ECB reduced rates for the third time in October with markets expectation of another cut this calendar year.

On the domestic front, RBI maintained the status quo on policy rates accompanied by a change in stance to neutral. The RBI Governor reiterated the focus on the 4% inflation target on a durable basis. Geo-political risks, particularly, tensions in the Middle East, need to be closely watched in case the fallout leads to any significant surge in crude prices.

Domestic Updates

India’s retail inflation rises closer to the upper RBI band, wholesale inflation accelerates

The retail inflation, measured as a change in the Consumer Price Index (CPI), rose to a 9-month high of 5.49% YoY in September from 3.65% in August but remained within the RBI’s target range of 2-6%. The increase is attributable to a spike in food inflation to a 3-month high at 9.24% in September from 5.66% in August. Due to persistent unfavourable weather conditions, vegetable inflation rose to a 14-month high at 36% YoY in September from 10.71% in August.

Inflation based on the wholesale price index (WPI) moved slightly upwards to 1.84% YoY in September from 1.31% in August, after two consecutive months of decline. WPI is divided into three groups — Primary Articles (22.6% of total weight); Fuel and Power (13.2%); and Manufactured Products (64.2%). The acceleration in wholesale inflation was mainly caused by the rise in inflation for primary articles from 2.42% in August to 6.59% in September due to a sharp rise in the prices of food articles.

Meanwhile, retail inflation for farm and rural workers rose to 6.36% YoY and 6.39% in September 2024, respectively, from 5.96% YoY and 6.08% in the previous month.
Mining and electricity drag India’s industrial output

India’s industrial output, as measured by the Index of Industrial Production (IIP), declined 0.1% YoY in August against a growth of 4.8% in July due to contraction in two out of three major components of IIP – mining, manufacturing, and electricity. Mining and electricity output declined 4.2% and 3.7% YoY, respectively while manufacturing output grew only 1% during the month.

RBI maintains status quo in the repo rate but changes its policy stance

The Reserve Bank of India (RBI) keeps the benchmark repo rate (the rate at which RBI lends money to commercial banks in exchange for securities) unchanged at 6.5% for the 10th consecutive time in its 4th bi-monthly Monetary Policy Committee (MPC) meeting for FY25. The central bank committee mentioned that it is prudent to maintain greater flexibility and optionality, given the present circumstances. Other key rates such as Standing Deposit Facility (SDF), Marginal Standing Facility (MSF), and Bank Rate have been kept unchanged at 6.25%, 6.75%, and 6.75%, respectively. The significant diversion in the current MPC was the change in policy stance unanimously from ‘withdrawal of accommodation’ to ‘Neutral’, which means that the central bank can either raise or reduce benchmark rates based on how the key economic indicators like inflation and GDP are panning out.

Net FDI to India doubles

Net foreign direct investment (FDI) in India more than doubled to US$6.62 billion in April–August 2024 from US$3.26 billion in April–August 2023, as per RBI. Gross inward FDI rose ~32% YoY to US$36.1 billion in April–August 2024. About two-thirds of the gross FDI inflows went to manufacturing, financial services, communication services, electricity, and other energy sectors. Nearly 75% of the inflow came from Singapore, Mauritius, the UAE, the Netherlands, and the US.

India’s trade deficit abates

India’s merchandise trade deficit narrowed to US$20.8 billion in September, which is the lowest in the last 5 months, from US$29.7 billion in August and US$23.5 billion in July. In September, merchandise exports slightly dropped to US$34.58 billion from US$34.71 billion in August, while imports fell drastically to US$55.36 billion from US$64.36 billion in August.

China is India’s largest source of imports

According to the Commerce Ministry, China became the largest source of imports during April-September 2024 with inbound shipments rising 11.5% to US$56.3 billion. It is followed by Russia, the UAE, the US, Iraq, Saudi Arabia, Indonesia, Korea, Switzerland and Singapore. On the other hand, the US became the top export destination for India in the same period with outbound shipments increasing 5.6% to US$40.4 billion.

Unemployment rate dips to 4-month low

The unemployment rate in India dipped to a 4-month low at 7.8% in September from 8.5% in August, according to the survey by the Centre for Monitoring Indian Economy (CMIE). However, there were fewer people actively looking for jobs as depicted in the fall in labour participation rate from 41.6% to 41% in September 2024.

India’s personal income tax collections growth surpasses corporates

India’s personal income tax collections grew at a pace that is double the pace of corporate tax collections over the past decade, according to data revealed by the Central Board of Direct Taxes. The personal income tax collection surged 294.3% to INR 10.45 lakh crore between FY15 to FY24 while the corporate tax collections jumped 112.9% to INR 9.11 lakh crore in the same period. The total number of taxpayers increased from 5.7 crore in FY15 to 10.4 crore in FY24 while the number of tax returns more than doubled from 4 crore in FY15 to 8.6 crore in 2024. With this, the tax-to-GDP ratio increased from 5.6% in FY15 to 6.6% in FY25. Maharashtra, Karnataka, Delhi, Tamil Nadu, and Gujarat contributed over 72% of net direct tax collections.

Passenger vehicle sales recover after 2 months of decline

Total passenger vehicle sales in India increased ~1.1% YoY to 356,752 units in September from 352,921 units in August, as per data from the Society of Indian Automobile Manufacturers (SIAM). According to data from the Federation of Automobile Dealers Association (FADA), which shows actual retail sales from showrooms, versus the SIAM, which puts out dispatches to dealers from auto factories, passenger vehicle sales fell 9.3% YoY in September. Two-wheelers and commercial vehicle sales declined 8.5% and 10.5% YoY, respectively while sales of tractors grew 14.7% YoY.

World Bank upgrades India’s growth forecast

The World Bank upped its real GDP growth forecast for India from 6.6% (projected in April 2024) to 7% for the fiscal year 2025 ending March 2025. As per the international financial institution, recovery in agricultural output and strong private consumption led by employment growth are expected to auger well for the domestic economy. The revised forecast is in line with the IMF, which has retained India’s growth forecast at 7% for FY25.

Global Update Roundups

Monetary policies

  • ECB: The European Central Bank cut its deposit rate for the third time in 2024 by 25 bps to 3.25% in an effort to boost economic growth amid softening labour market and moderation in inflation. The European Union has been struggling with poor consumer spending and weak economic indicators, and the subdued growth resulted in lower inflation, which came in at 1.7% in September, its lowest level in 3 years. More cuts are likely; however, the ECB did not provide any direction for its next move.
  • People’s Bank of China: The People’s Bank of China has cut its benchmark lending rates by 25 bps in an expected move to boost the economy. The 1-year loan prime rate (LPR), which affects corporate loans and most household loans, has been cut to 3.1%, while the 5-year LPR, which serves as a benchmark for mortgage rate, has been reduced to 3.6%.

GDP growth

  • Global growth: The International Monetary Fund (IMF) in its October World Economic Outlook has kept the global growth unchanged at 3.2% in 2024 and 2025 stating that the “global economy remained unusually resilient throughout the disinflationary process”. The UN agency expects global headline inflation to decline from an annual average of 6.7% in 2023 to 5.8% in 2024 and 4.3% in 2025. It foresees advanced economies to return to their inflation targets earlier than emerging market and developing economies.
  • China: China witnessed a slowdown in the economy as GDP growth declined from 4.7% in the second quarter of 2024 to 4.6% in the third quarter reflecting the need for additional stimulus. The Chinese government already announced interest rate cuts and policy measures to support the property and equity market. Chinese lawmakers are now expected to approve additional budget or debt sales to fund public spending as part of the promised fiscal support.

Unemployment

  • US: The unemployment rate eased to 4.1% in September, the lowest in three months, from 4.2% in August, exceeding market expectations of an unchanged rate. This happened as the number of unemployed individuals declined by 281,000 to 6.8 million, while employment levels rose by 430,000 to 161.8 million. The labour force participation rate was steady at 62.7% in the month.

  • Canada: The labour market recovered as the unemployment rate declined to 6.5% in September, after consecutive increases since January 2024, from the 34-month high of 6.6% in August, defying the consensus estimates of 6.7%. The number of unemployed decreased by 30,800 from the prior month to ~1.43 million due to a decline in unemployment for the youth.
  • China: Unemployment in China declined to a 3-month low of 5.1% in September (below market estimates of 5.3%) from 5.3% in August. The jobless rate for locally registered residents declined to 5.2% in the month.
  • Japan: Japan’s unemployment rate declined to the lowest level since January at 2.4% in September from 2.5% in August. It came down from July’s 11-month peak of 2.7% and less than market forecasts of 2.5%.

Inflation readings

US: The inflation rate in the US decelerated for a sixth consecutive month to 2.4% YoY in September from 2.5% in August but came in above the Dow Jones estimate. It’s the lowest inflation recorded since February 2021 and supports the US Fed’s confidence of inflation coming back towards the 2% goal. Core inflation increased 10 bps MoM to 3.3% in September. A fall in energy prices (-6.8% in September vs -4% in August) is one of the primary factors behind the fall in inflation.

  • Eurozone: The annual inflation rate in the Eurozone declined to 1.8% in September, the lowest since April 2021, compared to 2.2% in August, but came in below the consensus estimates of 1.9%. However, it is below the 2% target set by the European Central Bank. This happened as energy prices fell (-6% vs -3%) and inflation for services decelerated (4% vs 4.1%).
  • UK: The annual inflation rate declined to 1.7% in September, which is the lowest point since April 2021 and compared to 2.2% in each of the previous two months. Transport costs (-2.2% vs 1.3%) is the largest contributing factor to the fall in inflation rate due to lower prices of airfares and motor fuels.
  • China: The annual inflation softened to 0.4% in September from 0.6% in August, indicating a slowdown in the economy. It missed the consensus estimates of 0.6%.
  • Japan: The annual inflation declined to the lowest level since April at 2.5% in September from 3% in August. The deceleration in prices of electricity and gas and moderation in prices of food, furniture/household utensils, transport, and culture contributed to the fall in inflation.

Consumer confidence

  • US: The consumer confidence index improved to 108.7 in October from a revised 99.2 reading in September. It is the biggest jump in confidence since March 2021. This happened as people expressed optimism about the job market. Many noticed a fall in grocery prices though overall inflation remained a concern.
  • Japan: The consumer confidence index declined to 36.2 in October from 36.9 in August, which was the 5-month high. This happened as households’ sentiment in the country weakened for income growth, employment, willingness to buy durable goods, and overall livelihood.
  • UK: Consumer Confidence indicator hit the lowest level in the year at -21 in October compared to -20 in September. Concerns on potential tax increases in the Budget weighed on household and business sentiments.
  • Euro: Consumer confidence in the Euro Area increased by 40 bps to -12.5 in October from -12.9 points in September. The improvement was led by consumers’ enhanced outlook on their household financial situation.

Balance of Trade

  • US: The trade deficit surged 15% to two-and-half-year high of US$108.2 billion in September from US$94.2 billion in the prior month. US imports rose ~4% to US$282.4 billion in the month ahead of the holiday shopping season while exports fell 2% to US$174.2 billion.
  • China: China continued to report a trade surplus, but it narrowed to US$81.7 billion in September from US$91.02 billion in the same period a year earlier. This is attributed to a fall in manufacturing activity with new export orders declining to their worst in 7 months.
  • Japan: Japan’s trade deficit narrowed to JPY 294.34 billion in September from JPY 695.3 billion in September 2023. The reported figure was much higher than the market forecast of a deficit of JPY 237.6 billion. Exports declined unexpectedly by 1.7% to JPY 9,038.20 billion, the first dip since November 2023, while imports rose 2.1% to JPY 9,332.55 billion.

Disclaimer: 

The details mentioned above are for information purposes only. The information provided is the basis of our understanding of the applicable laws and is not legal, tax, financial advice, or opinion and the same subject to change from time to time without intimation to the reader. The reader should independently seek advice from their lawyers/tax advisors in this regard. All liability with respect to actions taken or not taken based on the contents of this site are hereby expressly disclaimed. 

DATE
October 9, 2024
PLACE
Mumbai
READING TIME
10 mins

The Pulse – A monthly digest of key macroeconomic events (September 2024)

“There have been three great inventions since the beginning of time: fire, the wheel, and central banking.” – Will Rogers


Executive Summary

The much anticipated and telegraphed US Fed rate cut finally took place in September. However, the Fed surprised most economists by delivering a larger 50 basis points (bps) cut than the median forecast of 25 bps, calling it an “appropriate recalibration” of the monetary policy stance. The post-meeting press conference saw Chair Powell emphasizing that the upside risk to inflation has diminished, while the downside risk to employment has increased. While noting that economic growth is still robust, Powell outlined the support to the labour market as the basis for a larger upfront cut. The Fed dot plot indicated another 50-bps cut this year and another 100-bps next year, however, the markets have priced in much higher cuts by the first half of 2025. Elsewhere, the European Central Bank reduced rates while England and Japanese central banks kept it on hold. China saw significant stimulus, in a boost to risk assets, with a sharp rally in currency and local equity markets. Geo-political tensions, particularly in Middle East is the key risk to watch out for, as any sharp upshoot in commodity prices will have a negative effect on inflation prints.

On the domestic front, RBI’s Monetary Policy Committee (MPC) begins this week, where we expect status quo on rates. We believe RBI will lag the Fed both in terms of timing and magnitude, as it is expected to be a shallow rate cut cycle, with domestic data prints supporting the stance. On the data front, CPI remained below 4% for another month (base effect in play with reversal expected in the next quarter). India’s current account deficit in Q1FY25 widened to 1.1%, led by a widening of merchandise trade deficit, while the capital account surplus moderated to US$14.4bn, on account of a slowdown in foreign portfolio inflows. Overall, the balance of payments (BoP) surplus eased to US$5.2bn vs US$30.8bn in the previous quarter. On government finance, the fiscal deficit for April-August 2024 was 27% of the budgeted deficit with a weaker pace of capital expenditure, thereby increasing the chances of a lower than budgeted fiscal deficit, as receipts hold up.

Domestic Updates

India’s retail inflation still within RBI band, wholesale inflation eases further

The retail inflation in India, which is measured as a change in the Consumer Price Index (CPI) moves slightly upwards to 3.65% YoY in August from 3.54% YoY in July and 6.83% in August 2023. It’s the second time in nearly 5 years that retail inflation came in below the RBI’s medium-term target of 4%. The food inflation, which accounts for nearly half of the overall basket, rose to 5.66% in August from 5.42% in July 2024. Vegetable inflation increased to 10.71% in August from 6.83% in July due to uneven rainfall that impacted crop yields.

Inflation based on the wholesale price index (WPI) eased further to 1.31% YoY in August 2024 from 2.04% YoY in July due to deceleration in food inflation and deflation in fuel prices. Food inflation came down to 3.26% from 3.55% in July while fuel and power recorded a deflation of 0.67% compared with a 1.72% rise in July.

Meanwhile, retail inflation for farm and rural workers softened to 5.96% YoY and 6.08% in August 2024, respectively, from 6.17% YoY and 6.20% in the previous month.
India’s industrial output growth turns around

The growth in India’s industrial output, as measured by the Index of Industrial Production (IIP), improved to 4.8% in July from 4.2% in June as manufacturing activity as well as investments started gaining traction post-elections. The growth in the manufacturing sector (the largest in the IIP basket) accelerated to 4.6% YoY in July 2024 from a 7-month low of 3.2% in June 2024. However, the acceleration is somewhat offset by deceleration in mining (3.7%) and electricity (7.9%), which are 5-month and 4-month lows, respectively.

World Bank, ADB projects India’s FY25 GDP growth at 7%

World Bank has revised India’s real GDP growth forecast for FY25 from 6.6% to 7% despite subdued global growth. Due to strong revenue growth and continued fiscal consolidation, the international financial institution projected India’s debt-to-GDP ratio to decline from 83.9% in FY24 to 82% by FY27. However, it noted that India needs to diversify its export basket and leverage global value chains to reach the goal of US$1 trillion in merchandise exports by 2030.

On the other hand, the Asian Development Bank maintained India’s GDP growth at 7% for FY25 and 7.2% for FY26. ADB Country Director for India Mio Oka said, “India’s economy has shown remarkable resilience in the face of global geopolitical challenges and is poised for steady growth. Agricultural improvements will enhance rural spending, which will complement the effects of robust performance of the industry and services sectors.” Owing to fiscal consolidation, it expects India’s government debt to decline from 58.2% of GDP in FY24 to 56.8% in FY25. The general government deficit, which includes state governments, is expected to reduce below 8% of GDP in FY25.

SEBI launches FPI-dedicated cell

The Securities and Exchange Board of India (SEBI) established a dedicated foreign portfolio investor (FPI) outreach cell to assist FPIs looking to enter in the Indian markets. The cell will facilitate a bridge between FPIs and the Indian securities market by providing them guidance and support throughout their engagement, from pre-application to post-registration. As per SEBI, about INR 3.4 lakh crore of foreign portfolio investor inflows were recorded during FY24, of which, INR 2.08 lakh crore were invested in equities and INR 1.2 lakh crore in the debt market. This underlined the importance of creating a framework for foreign investors.

Loan growth of rated finance companies expects to moderate

S&P Global Ratings stated that loan growth of rated finance companies in India may decline from 20% in FY24 to 18% in FY25 due to the cumulative impact of RBI actions. The rating agency commented that “recent actions by RBI will curtail lenders’ over-exuberance, enhance compliance, and safeguard customers”.

Loan growth to MSME improves in current fiscal – RBI

As per a recent RBI report, loans to micro and small enterprises grew 13.3% YoY and medium enterprises rose 17.2% so far in the current fiscal year. This is higher than the growth registered for both the segments in FY24 due to several factors including renewed focus on MSME, deepening of the Account Aggregator framework, etc. The launch of the RBI’s end-to-end digital platform, Unified Lending Interface (ULI), which is expected to revolutionise access to credit, is expected to provide further impetus to growth. In FY24, the loan growth of micro-small and medium enterprises was recorded at 10.2% and 9.7%, respectively, compared with 28.3% and 36.8% in FY23.

FDI in equity jumps nearly 50% in 1Q FY25

Foreign direct investments (FDI) equity inflows in India rose steeply by 47.8% to US$16.2 billion in April-June 2024 driven by services, computer, telecom, and pharma. The major countries contributing to equity inflows include Mauritius, Singapore, the US, the Netherlands, the UAE, the Cayman Islands, and Cyprus. Total FDI, including equity inflows, reinvested earnings, and other capital, rose 28% to US$22.5 billion in the same period. The growth in FDI is expected to accelerate further due to the potential impact of the US Federal Reserve interest rate cut and favourable economic conditions in India.

India’s trade deficit expands further

India’s merchandise trade deficit expanded further to US$29.7 billion in August 2024, which is the highest in 10 months, from US$23.5 billion in July 2024 and US$21 billion in June 2024. Rising shipping costs and slowdown in China are adversely affecting India’s exports, which declined 9.3% YoY to US$34.7 billion in August. Imports rose 3.3% YoY to US$64.4 billion, which is the highest since October 2023.

Unemployment rate worsens 

The unemployment rate in India worsened to 8.5% in August from 7.9% in July, according to the survey by the Centre for Monitoring Indian Economy (CMIE). However, the month witnessed a large portion of working-age population actively looking for jobs as depicted by the sharp rise in labour participation rate. As per CMIE, the unemployment rate rose as some left the job market due to a lack of opportunities. 

Sales of passenger vehicles skid for the second month 

Total passenger vehicle sales in India slid 1.8% YoY to 352,921 units in August, after falling 1.9% in July, as per data from the Society of Indian Automobile Manufacturers (SIAM) revealed. The fall can be attributed to customers postponing their purchases for the festive season. According to data from the Federation of Automobile Dealers Association (FADA), which shows actual retail sales from showrooms, versus the SIAM, which puts out dispatches to dealers from auto factories, passenger vehicle sales fell 4.5% YoY in August.  Sales of 2-wheelers recorded a 6.3% rise while sales of tractors and commercial vehicles declined 11% and 6% YoY, respectively, during the month. 

Global Update Roundups 

Monetary policies  

  • The US Federal Reserve, in a historic move, cut its benchmark interest rate by 50 bps the first time since 2020. The federal funds rate now stands at 4.75%-5%, down from the 22-year high target range of 5.25%-5.5%. The rate cut followed a spate of 11 rate hikes since March 2022 (including four in 2023) to combat inflation. The policymakers indicated more rate cuts are likely by the end of this year. As per the median of new economic projections published at the end of the policy meeting, interest rates could be lowered to a range of 4.25%-4.5% by 2024-end as inflation nears the 2% goal and unemployment spikes. This implies that an additional 50 bps cut might take place this year. 
  • The Bank of Canada trimmed its benchmark interest rate by 25 bps to 4.25% for the 3rd consecutive time in its September meeting, after keeping the rate at a two-decade high of 5% for a year until June this year. The cut was executed with the intent to boost the economy and consider continued easing in inflationary pressures. In August, consumer inflation in Canada softened to 2% (the lowest level since February 2021) from a 40-month low of 2.5% in July, thereby reaching the central bank’s target. 

GDP growth 

  • US: The growth in real GDP came in at an annualized rate of 3% in Q2 (Apr-Jun) of calendar year 2024 (CY24), up from the sluggish growth of 1.6% (revised) in Q1CY24. The growth is driven by resilience in consumer spending (which accounts for about 70% of domestic economic activity) and business investment. Consumer spending grew 2.9% at an annual rate while business investment rose 7.5%, led by a 10.8% increase in investment in equipment. 

  • Japan: The economy grew at an annualized rate of 3.1% in Q2CY24, which is higher than the average estimate of a 2.3% rise and degrowth of 2.3% in the first quarter of the year. The recovery in growth is attributed to higher consumption of automobiles and other durable goods. 

Unemployment  

  • US: The unemployment rate eased to 4.1% in September, the lowest in three months, from 4.2% in August, exceeding market expectations of an unchanged rate. This happened as the number of unemployed individuals declined by 281,000 to 6.8 million, while employment levels rose by 430,000 to 161.8 million. The labour force participation rate was steady at 62.7% in the month. 

  • UK: The unemployment rate declined to 4.1% from May to July 2024 from 4.2% for three months till June, meeting market expectations. The unemployment rate is the lowest for three months ending January this year as the number of unemployed individuals decreased by 74,000 to 1.44 million. On the other hand, the number of employed individuals rose by 265,000, the highest increase in over a year and a half, reaching 33.2 million, led by a rise in full-time employment. 

  • Canada: The labour market continues to soften as the unemployment rate rose further to 6.6% in August from the 30-month high of 6.4% in July and exceeded market expectations of 6.5%. The number of unemployed increased by 60,400 from the prior month to ~1.5 million due to a rise in unemployment for the core working age (to 5.7%) and the older population (to 5.5%). 

Inflation readings 

  • US: Consumer price inflation decelerated for a 5th consecutive month to 2.5% in July, the lowest reading since February 2021, from 2.9% in July. The reading is below the consensus estimate of 2.6%. This happened as energy costs fell (-4% vs 1.1% in July) and the inflation for food (2.1% vs 2.2%) and transportation (7.9% vs 8.8%) softened during the month. 

  • Eurozone: The annual inflation rate in the Eurozone declined to 1.8% in September, the lowest since April 2021, compared to 2.2% in August, but came in below the consensus estimates of 1.9%. However, it is below the 2% target set by the European Central Bank. This happened as energy prices fell (-6% vs -3%) and inflation for services decelerated (4% vs 4.1%). 
  • UK: The annual inflation rate remained unchanged at 2.2% in August compared to July after remaining steady at 2% for consecutive two months earlier, which is also the central bank target. It came in line with the consensus estimates. The upward pressure on inflation mostly came from air fares, recreation and culture, and transport. On the other hand, the downward pressure mostly came from motor fuels, and restaurants and hotels. 
  • China: The annual inflation rate rose to 0.6% YoY in August from 0.5% in July, coming below the market forecasts of 0.7%. Food prices increased for the first time since June 2023 (2.8% vs flat reading in July) due to fresh vegetables while non-food prices rose 0.2% YoY. 
  • Japan: The annual inflation rate rose to 3% in August after remaining steady at 2.8% for the third straight month in July and touched its highest level since October 2023. It’s driven by elevated prices of electricity that increased the most since March 1981 (26.2% vs 22.3% in July), and gas (11.1% vs 7.4%), food (3.6% vs 2.9%), housing (0.7% vs 0.6%), furniture & household utensils (5.2% vs 3.7%), clothes (2.3% vs 2.2%), and culture (4.8% vs 4.4%). 

 Consumer confidence 

  • US: The University of Michigan consumer sentiment rose to a 5-month high of 70.1 in September from 67.9 in August and exceeded market expectations of 69.3. This happened as the economic conditions gauge was revised higher to 63.3 and inflation expectations for the year declined to 2.7%. 
  • Japan: The consumer confidence index rose to 36.9 in September from 36.7 in August but came in below market forecasts of 37.1. Households’ sentiment in the country improved for income growth, employment, and willingness to buy durable goods. 
  • UK: Consumer Confidence indicator declined to a 6-month low of -20 in September 2024 from -13 in consecutive two months. This deterioration can be attributed to uncertainties before the next month’s autumn Budget.  

Balance of Trade  

  • US: The trade deficit widened to ~US$79 billion in July compared to US$73 billion in June and was in line with the consensus estimates. It’s the biggest deficit since June 2022 as imports rose 2.1% to US$345.4 billion, the highest value since March 2022, driven by purchases of computer accessories, non-monetary gold, etc., while exports increased 0.5% to a record high of US$266.6 billion, led by semiconductors, government goods, and financial services. 
  • China: The trade surplus jumped to US$91 billion in August from US$67.8 billion in the same month the prior year. Exports grew nearly 9% (fastest pace since March 2023) to a 23-month high of US$308.65 billion while imports rose 0.5%, down sharply from 7.2% in July. 


Disclaimer: 

The details mentioned above are for information purposes only. The information provided is the basis of our understanding of the applicable laws and is not legal, tax, financial advice, or opinion and the same subject to change from time to time without intimation to the reader. The reader should independently seek advice from their lawyers/tax advisors in this regard. All liability with respect to actions taken or not taken based on the contents of this site are hereby expressly disclaimed. 

DATE
September 10, 2024
PLACE
Mumbai
READING TIME
10 mins

The Pulse – A monthly digest of key macroeconomic events (August 2024)

Executive Summary

The month started quite volatile with weaker global financial sentiments spooking markets as yields plunged, and stocks tanked. However, fears of a hard landing in the US have so far proven to be unfounded, and the asset markets regained stability through the month with a stronger set of data points (GDP, retail sales, etc). Markets perceived Fed Chair Powell’s comments at Jackson Hole as dovish and were quick to price in imminent rate cuts beginning September. While markets are pricing aggressive rate cuts, the Fed might choose to go slow and steady with rate cuts, ensuring data points throughout the year support sustained rate cuts.

Back at home, global volatility spilled onto domestic markets, however, it was short-lived. On the policy front, RBI kept rates on hold and indicated continued progress on inflation without hurting growth, as evident from their forecasts. On the data front, CPI came in softer, while PMIs continued to hold up. Headline GDP though softer, GVA growth surprised to the upside vs consensus expectations, led by the services sector. Private consumption showed signs of recovery after a lacklustre FY24.

Many factors that could have kept risk aversion elevated have failed to do so. Tensions in the Middle East escalated but their impact on energy prices was limited. Concerns around China’s slowdown persist, but pressure on Chinese currency eased this month on the back of a broader weakening in USD.

Domestic Updates

India’s retail inflation dips below RBI target for first time in ~5 years

The retail inflation in India, which is measured as a change in the Consumer Price Index (CPI) softened to 3.54% YoY in July from 5.08% in June and 7.44% in July 2023. It’s the lowest reading in the last 59 months. It’s the first time in nearly 5 years that retail inflation came in below the RBI’s medium-term target of 4%. This is attributable to the food inflation that reached its lowest level since June 2023 as well as the high base effect of last year.

Wholesale price inflation decelerates for first time in 3 months

Inflation based on the wholesale price index (WPI) declined to 2.04% YoY in July from 3.36% in June coming in below market forecasts of a 2.39% rise. This happened as Primary Articles (food particles, minerals, and vegetables) and Food Index rose at a softer pace in July vs. June (3.08% vs 8.80% and 3.55% vs 8.68%, respectively) while vegetable (-8.93% vs 38.76%) and paddy (10.98% vs 12.07%) inflation fell.

Retail inflation for farm and rural workers softens

Retail inflation for farm and rural workers softened to 6.17% YoY and 6.20% in July 2024, respectively, from 7.02% and 7.04%, respectively due to lower prices of certain food items.

India’s industrial output growth moderates

The growth in India’s industrial output, as measured by the Index of Industrial Production (IIP), moderated to 4.2% in June from 6.2% in May due to sluggish growth in manufacturing and electricity output. The growth in manufacturing output decelerated to a 7-month low of 2.6% in June from 5% in May while the same in electricity slowed to a 3-month low of 8.6% from 13.7% in May. However, the growth in mining output rose to an 8-month high of 10.3% in June from 6.6% in May.

India’s real GDP growth slips to 15-month low

The growth in India’s real GDP slipped to a 15-month low in the first quarter of FY25 at 6.7% YoY compared with 7.8% in the previous quarter. Despite the fall, India still remains the world’s fastest major economy (China’s GDP growth in the April-June quarter is recorded at 4.7%). The slowdown in India’s real GDP growth has been attributed to lower-than-expected consumer spending (although consumer demand remained strong growing 7.44% YoY in Q1FY25 compared with 4% in Q4FY24) and subdued government spending (declined 0.24% YoY) as well as election-related disruptions and extreme heat due to summer impacting economic activities.

The primary sector (comprising agriculture, livestock, forestry, fishing, and mining & quarrying) witnessed a degrowth of 2.7% YoY against a growth of 4.2% in the same quarter of FY24. The secondary sector (comprising manufacturing, electricity, gas, water supply & other utility services, and construction) depicted a YoY growth of 8.4% compared with 5.9% in the year-ago quarter. The tertiary sector (services) growth declined to 7.2% YoY compared with 10.7% in Q1FY24.

Despite a slowdown in India’s GDP growth, growth in Gross Value Added (GVA) surprisingly accelerated to 6.8% in Q1FY25 from 6.3% in Q1FY24 and was higher than expected. This was mainly led by construction, public administration, defence and other services, and agriculture segments.

Fiscal deficit stands at 8.1% of FY estimates

India’s fiscal deficit, the gap between govt. expenditure and revenue, came in at INR 1.36 lakh crore for the first quarter of FY25, which is 8.1% of the full-year estimate of INR 16.85 lakh crore, set in the interim budget. However, the govt. reduced the fiscal deficit projection for FY25 to INR 16.13 lakh crore in the annual budget presented in July.

“We are seeing good amount of convergence between market expectations and RBI policies”, Shaktikanta Das

The Reserve Bank of India’s Monetary Policy Committee (MPC) keeps the repo rate unchanged at 6.5% for the 9th time in a row at its bi-monthly meeting with a majority of 4:2. The committee also retained the stance of ‘withdrawal of accommodation’. Governor Shaktikanta Das said, “We are seeing a good amount of convergence between market expectations and RBI policies, they are well aligned.” The central bank retained the inflation forecast at 4.5% raising concerns about food price trajectory and geopolitical tensions. Quarterly forecasts of inflation are revised as follows:

The GDP growth projection was kept unchanged for FY25 (at 7.2%) as well as for Q2FY25, Q3FY25 and Q4FY25. However, the GDP growth forecast for Q1FY25 has been lowered from 7.3% to 7.1%.

India is on fast track in terms of FDI inflows in manufacturing

The foreign direct investment (FDI) inflows in the manufacturing sector jumped 69% to US$165.1 billion in the last 10 years (2014-24), revealed Jitin Prasada, the Minister of State for Commerce and Industry. In Apr-Jun 2024, FDI to India rose by 26.4% to US$22.4 billion, marking the fastest expansion in nearly 5 quarters.

India’s trade deficit continues to expand

India’s trade deficit continues to expand due to declining exports and rising imports. In July 2024, it stood at US$23.5 billion compared with US$20.98 billion in June. Merchandise exports fell 1.4% YoY to US$33.98 billion while merchandise imports increased 7.5% YoY to US$57.48 billion in July.

Unemployment rate declines from 8-month high

The unemployment rate in India dipped to 7.9% in July from the 8-month high of 9.2% in June, revealed the Centre for Monitoring Indian Economy (CMIE) based on their Consumer Pyramids Household Survey. In July, unemployment was higher in urban areas at 8.5% compared to rural areas at 7.5%. In absolute terms, the number of unemployed declined to ~3.5 crore in July from 4.1 crore in June.

Growth in passenger vehicle sales decelerates

Total passenger vehicle sales in India slipped 1.9% YoY to 296,785 units in July in stark contrast to a 5% growth in June, data from the Society of Indian Automobile Manufacturers (SIAM) revealed. However, SIAM believes growth to improve in the short term due to above-average rainfall and the upcoming festive season.

Global Update Roundups

Monetary policies 

  • The US Federal Reserve kept the federal funds rate unchanged at a 23-year high of 5.25%-5.50% for the eighth consecutive meeting. However, Federal Reserve Chairman Jerome Powell, at the Jackson Hole Economic Symposium, clearly indicated that the central bank will cut its interest rate in the September meeting if inflation aligns with expectations. Powell noted the cooling off job market and a downward revision to payrolls and expressed confidence in inflation nearing the central bank’s 2% target.
  • The Bank of England cut its benchmark bank rate by 25 basis points to 5% after maintaining it at 16-year highs for a full year. The move aligned with market expectations. However, the bank intends to tread cautiously in loosening the monetary policy by closely monitoring the inflation trajectory.
  • The People’s Bank of China left its key lending rates – 1-year (the benchmark for business and household loans) and 5-year Loan Prime Rates (mortgages) unchanged at 3.35% and 3.85%, respectively, after cutting them to new record lows in July. The move reflects China’s ongoing efforts to boost its economy and achieve the target growth of 5% in 2024.

GDP growth

  • Japan: The GDP rose 0.8% QoQ in Apr-Jun 2024 in sharp contrast to a decline of 0.6% in the first quarter of the calendar year, as per preliminary reading. It was the strongest quarterly growth since the first quarter of 2023 led by a rise in private consumption (accounts for more than half of the economy) for the first time in five quarters (1.0% vs. -0.6% in Q1CY23)
  • China: The growth in the Chinese economy decelerated to 4.7% YoY in Q2CY24 from 5.3% growth in Q1CY24, missing the consensus of a 5.1% growth. The sluggish growth is attributed to a continued weakness in the country’s real estate market, sluggish domestic demand, falling currency, and trade frictions with the West.

 Unemployment data 

  • US: The unemployment rate rose to 4.3% in July, the highest level since October 2021, from 4.1% in June, adding to concerns of a broader downturn. In July, the US added 114,000 jobs, which is down from 206,000 in June falling short of expectations.

  • UK: The unemployment rate declined to 4.2% in Jun 2024 from 4.4% in May, which was a two-and-a-half-year high. It came in below market forecasts of 4.5%. In absolute terms, the number of unemployed decreased by 51,000 to 1.44 million due to a fall in a number of people unemployed for up to 6 months.

  • Canada: The unemployment rate remained unchanged at the 30-month high of 6.4% in July and came in below expectations of 6.5%. The Canadian economy lost 2,800 jobs in the month. The increase in full-time workers was offset by losses in part-time jobs. The labour participation rate in Canada dipped to a 26-year low of 65% in July (sans the pandemic year).

Inflation readings

  • US: Consumer price inflation in the US decelerated for a 4th consecutive month to 2.9% in July, the lowest reading since March 2021, from 3% in June. The reading is below the consensus of 3%. Prices for essentials, meat, poultry, fish, and milk recorded a marginal rise. Meanwhile, categories like used cars, airfares, and gasoline are getting cheaper.

  • Eurozone: The annual inflation rate rose to 2.6% in July from 2.5% in June. It was above initial market expectations of 2.4%. Countries with the highest annual inflation rates included Romania, Belgium, and Hungary and those with the lowest rates included Finland, Latvia, and Denmark.
  • China: The annual inflation rate rose to 0.5% in July from 0.2% in June, surpassing market expectations of 0.3%. It was the highest inflation reading since February. Food inflation was flat compared to a deflation of 2.1% in June while non-food prices continued to rise driven by clothing, housing, health, and education.
  • Japan: The annual inflation rate held steady at 2.8% for the third straight month in July and remained at its highest level since February. It’s driven by elevated prices of electricity (rose the most since March 1981 at 22.3% vs. 13.4% in June), gas (7.4% vs. 2.4%), food (2.9% vs. 3.6%), housing (0.6% vs. 0.6%), transport (1.2% vs. 2.5%), furniture & household utensils (3.7% vs. 3.7%), clothes (2.2% vs. 2.2%), healthcare (1.5% vs 1.4%), and culture (4.4% vs. 5.6%).
  • UK: The annual inflation rate edged up to 2.2% in July after remaining steady at 2% for consecutive two months earlier, which is also the central bank target. However, it came in below the consensus estimates of 2.3%. Categories that recorded faster price increases include housing and household services (3.7% vs 2.3%), clothing and footwear (2.1% vs 1.6%), communication (4.5% vs 2.9%), and miscellaneous goods and services (3.5% vs 2.9%).

Consumer confidence

  • US: Consumer confidence rose to a six-month high of 103.3 in August from an upwardly revised 101.9 in July reflecting improved perceptions of business conditions. However, the citizens are concerned about the labour market after the unemployment reading jumped in July.
  • Japan: Consumer confidence index remained steady at 7 in July compared with a month-ago reading but came in below the consensus of 36.9. Households’ sentiment in the country improved while the sentiment for income growth and employment deteriorated.
  • UK: Consumer Confidence indicator remained steady at -13 in August for consecutive two months and defied expectations of a minor improvement to -12 due to concerns about the economy. However, the indicator reading remains at the highest level since September 2021.

Balance of Trade

  • US: The US recorded a trade deficit that narrowed to US$73.1 billion in June from the revised US$75 billion in May, which is a 20-month high. Exports increased 1.5% to US$266 billion driven by higher sales of civilian aircraft, automotive vehicles, and energy commodities, including natural gas, petroleum products, and fuel oil.
  • China: China recorded witnessed a trade surplus that widened to US$84.65 billion in July from US$80.22 billion in July 2023 but came in below the consensus estimates of US$99 billion. Exports increased 7% YoY while imports rose 7.2%, reversing from a 2.3% fall in the previous month and depicting the strongest growth since April.
  • Japan: Japan recorded a trade deficit that expanded to JPY 621.84 billion in July from JPY 61.33 billion in July 2023, missing market expectations of a shortfall of JPY 330.7 billion. Imports increased 16.6% YoY, the highest since January 2023, to a 19-month high while exports rose for the eighth straight month by 10.3%.


Disclaimer:

The details mentioned above are for information purposes only. The information provided is the basis of our understanding of the applicable laws and is not legal, tax, financial advice, or opinion and the same subject to change from time to time without intimation to the reader. The reader should independently seek advice from their lawyers/tax advisors in this regard. All liability with respect to actions taken or not taken based on the contents of this site are hereby expressly disclaimed.

DATE
July 10, 2024
PLACE
Mumbai
READING TIME
10 mins

THE PULSE – A monthly digest of key macroeconomic events, June 2024

“There are decades where nothing happens; and there are weeks where decades happen.” – Vladimir Ilyich Lenin


Domestic Updates

India’s retail inflation soothes but wholesale inflation continues to rise

The retail inflation based on the Consumer Price Index (CPI) rate for May dropped to a 12-month low of 4.75% YoY, which was below expectations and saw a marginal decline from 4.83% in April. The downward trend is attributed to all contributors to the headline inflation either softening or remaining steady on a mom basis except a few like pulses. Vegetable inflation continues to be a concern (rose 27.3% YoY in May vs. 27.8% in April) due to the impact of heatwaves across the country. Core inflation, which strips out food and fuel, remained steady at 3.1% YoY in the month. This is the 9th consecutive month the retail inflation remained within RBI’s tolerance band of 2 percentage points within 4%. On the other hand, wholesale price inflation jumped to 2.61% YoY in May from 1.26% in April driven by rising prices of food and primary articles. Food inflation surged to 9.82% in May from 7.74% in April due to higher prices of cereals, wheat, pulses, vegetables, and fruits.

India’s industrial output growth moderates to 3-month low

The growth in India’s industrial output, as measured by the Index of Industrial Production (IIP), moderated to 5% YoY in April from an upwardly revised 5.4% last month, mainly driven by performance in the mining (6.7% YoY) and power (10.2% YoY) sectors. Manufacturing sector output grew 3.9% driven by basic metals, coke and refined petroleum products, and motor vehicles, trailers & semi-trailers.

RBI not in for any rate cut

In its second meeting of the financial year 2024-25, the Reserve Bank of India (RBI) kept the repo rate unchanged at 6.5% for the eighth consecutive time, which was in line with market expectations. RBI Governor Das said, “These decisions are in consonance with the objective of achieving the medium-term target for consumer price index inflation of 4% within a band of +/- 2% while supporting growth”. However, the central bank committee has revised India’s GDP growth forecast upwards from 7% to 7.2% for FY2024-25. It remained focused on the withdrawal of accommodation to ensure that inflation does not go up while supporting growth.

India to remain the fastest-growing major economy!

The World Bank in its recent report predicted that India will remain the fastest-growing major economy, with an average growth rate of 6.7% over the next three years, including the current financial year. However, it mentioned that the growth rate is expected to moderate due to a slowdown in investment from a high base. In April’s report, the global agency raised India’s growth forecast by 20 basis points to 6.6% for FY25. For FY26 and FY27, the growth forecasts are 6.7% and 6.8%, respectively.

2 -wheeler & 3-wheeler growth on a fast lane!

The automotive industry witnessed a robust performance in May. Passenger vehicle sales in the domestic market rose 3.9% YoY due to a high base while two-wheeler and three-wheeler segments recorded double-digit growth of 10.1% and 14.7% respectively in May due to higher demand.

RBI report indicates domestic resilience in India’s financial system

RBI’s Financial Stability Report reflected robustness and resilience in the Indian financial system despite global economic challenges like prolonged geopolitical tensions, rising public debt, and the sluggish pace of disinflation. The gross non-performing assets (GNPA) of scheduled commercial banks (SCB) declined to a multi-year low of 2.8% and the net non-performing assets (NNPA) ratio stood at 0.6% at March 2024-end. The financial condition of the non-banking financial companies (NBFCs) remained healthy with a Capital to Risk-weighted Assets Ratio (CRAR) of 26.6%, GNPA ratio of 4% and, return on assets (RoA) of 3.3%, respectively, as of March 2024-end.


Global Updates

US unemployment worsens

The unemployment rate in the US rose to 4% in May, the highest since January 2022, which is higher than 3.9% in April. The market expected the unemployment rates to be unchanged. The labour force participation rate declined to 62.5% in May from 62.7% in April.

Japan’s economic contraction turns narrower

The GDP growth in Japan contracted at a narrower pace of 1.8% YoY in Jan-Mar 2024 compared to estimates. The preliminary reading was a 2.0% decline, and a median forecast was a 1.9% fall.

Roundups

Monetary Policies 

The US Federal Reserve in its Federal Open Market Committee (FOMC) meeting left the benchmark interest rates unchanged at 5.25-5.50% for the 7th straight meeting, in line with Wall Street estimates, on a unanimous vote. The US Fed retained the GDP growth projections for 2024 but raised the inflation forecast for the year by 20 basis points (bps) in addition to a 10-bps hike in 2025. With this, the central bank kept the policy rate unchanged since July 2023 after hiking the rates by 5.25 percentage points since March 2022 to tame inflation down consistently toward the 2% target range.

Other central bank actions: The Bank of Canada reduced its key interest rate by 25 basis points (bps) to 4.75%, marking its first rate cut since March 2020. This happened as Canada’s inflation rate moved closer to the central bank target of 2% in recent months (recorded at 2.7% in April) while GDP growth rate (1.7%) came in weaker than expected in the first quarter of calendar year 2024. The Bank of Canada last announced a hike in interest rates to 5% in July 2023 and held it there. The central bank Governor Tiff Macklem said “We’ve come a long way in the fight against inflation. And our confidence that inflation will continue to move closer to the 2% target has increased over recent months”. The European Central Bank announced its first interest rate cut since 2019 by 25 bps to 3.75% from a record-high level of 4% citing progress in controlling inflation. However, the bank said its efforts to combat inflation are far from over. The central bank now expects inflation to be 2.2% on average in 2025, up from the previous estimate of 2%. The Bank of England’s Monetary Policy Committee decided to keep the Bank Rate unchanged at 5.25% during its June meeting, which was in line with the market expectations. The central bank, which set the target inflation at 2%, saw inflation falling to 2% in May from 2.3% in April and 3.2% in March. The Bank of Japan kept its key short-term interest rate at around 0% to 0.1% at its June meeting by a unanimous vote, as widely expected. The central bank will reveal its tapering plan for the next 1 to 2 years at the July meeting. It will continue buying government bonds at the current pace of US$38 billion per month but start trimming in the future. The People’s Bank of China left their benchmark loan prime lending rates unchanged in the June meeting. By consensus, the central bank kept the 1-year loan prime rate (LPR) at 3.45% and the 5-year LPR at 3.95%. This happened as China’s real estate sector continues to remain under pressure.

Inflation readings

The annual inflation rate in the US slowed marginally to 3.3% in May, the lowest in three months, from 3.4% in April, due to cheaper gasoline. Despite falling from the peak of 9.1% in June 2022, inflation continues to remain above the central bank target of 2%. In the Eurozone, annual inflation eased to 2.5% in June from 2.6% in May as per preliminary forecasts. Thanks to softer pace of rise in prices of food, alcohol and tobacco, and energy. Inflation was steady for non-energy industrial goods and services. In the UK, the annual inflation rate reached the central bank’s target level of 2% in May, which is the lowest since July 2021. Inflation declined from 2.3% in April led by led by a sluggish pace of increase in prices of food (1.7% vs 2.9%, the lowest since October 2021), namely bread and cereals, vegetables, etc. Prices also eased for restaurants and hotels (5.8% vs 6%) and recreation and culture (3.9% vs 4.4%). The annual inflation rate in Japan accelerated to 2.8% in May 2024 from 2.5% in April, pointing to the highest reading since February. There was a steep upswing in electricity prices as energy subsidies fully ended (14.7% vs -1.1% in April), reversing declines in the prior 15 months. At the same time, prices rose further for food (4.1% vs 4.3%), housing (0.6% vs 0.6%), transport (2.3% vs 2.7%), furniture & household utensils (2.9% vs 2.5%), clothes (2.2% vs 2.2%), healthcare (1.1% vs 1.2%), culture (5.2% vs 6.2%), miscellaneous (1.2% vs 1.1%), and communication (0.4% vs 1.0%). The annual inflation rate in China was unchanged at 0.3% in May for the second straight month in a row which is lower than market forecasts of 0.4%. Food prices declined 2% while non-food prices rose 0.8% in the month.

Disclaimer:

The details mentioned above are for information purposes only. The information provided is the basis of our understanding of the applicable laws and is not legal, tax, financial advice, or opinion and the same subject to change from time to time without intimation to the reader. The reader should independently seek advice from their lawyers/tax advisors in this regard. All liability with respect to actions taken or not taken based on the contents of this site are hereby expressly disclaimed.

DATE
June 7, 2024
PLACE
Mumbai
READING TIME
10 mins

The Month That Was – Macroeconomic takeaways from the month of May 2024

Domestic Economic Updates

  • India’s real GDP growth was recorded at 7.8% YoY in the March 2024 quarter, which translated into a growth of 8.2% for FY24 which exceeded the central government’s second advance estimate of 7.6% for the year. The key drivers of growth are private consumption and investment. The growth in the primary sector (agriculture and mining) was recorded at 2.1%, with agriculture at 1.4% and mining at 7.4%. The secondary sector (manufacturing, electricity, construction) grew 9.7%, with manufacturing and construction sectors recording growth of 9.9% and electricity at 7.5%. As per RBI, India’s real GDP growth for FY25 is expected to be 7% with risks evenly balanced.

  • India’s core sector growth slowed to 5.2% in March from 7.1% (upwardly revised) in February. In the entire fiscal year 2023-24, the core sector’s output grew at a 3-year low of 7.5% compared to 7.8% in FY23. This March, fertilizers and petroleum refinery products dragged down the index while steel, electricity, and coal drove up the core sector activity.

  • India’s GST collection became the highest ever in April at INR 2.1 lakh crore, reflecting a YoY increase of 12% from INR 1.87 lakh crore in April 2023 (previous high). The increase was led by a “strong increase in domestic transactions (up 13.4%) and imports (up 8.3%),” the Finance Ministry stated. Among the states, Maharashtra had the top collection (INR 37,671 crore) followed by Karnataka (INR 15,978 crore), Gujarat (INR 13,301 crore), Uttar Pradesh (INR 12,290 crore), and Tamil Nadu (INR 12,210 crore).

  • India’s manufacturing sector started the new fiscal year on a high note as the HSBC India Manufacturing Purchasing Managers’ Index (PMI) came in at 58.8 (revised lower) in April, which is the second highest pace in three and half years driven by buoyant demand. The April print was lower than 59.1 in March, but it was well above the neutral level of 50 and its long-run average of 53.9. Meanwhile, India’s service sector activity remained resilient as the HSBC India Services PMI came in at 60.8 in April compared with 61.2 in March and 60.6 in February.
  • The overall gross capital formation (GCF), which represents the total value of physical assets including fixed assets, inventories, and valuables, in India grew by 6.9% in FY23 to INR 55.3 lakh crore at constant prices. The moderate growth is attributable to a decline in investments in manufacturing, construction, and mining sectors mainly due to a fall in export demand and low private consumption amidst a high interest rate scenario.

  • Retail inflation based on the consumer price index (CPI) softened to an 11-month low of 4.83% YoY in April from 4.85% in March driven by falling prices in the fuel and light segment and easing pressure in prices of clothing and footwear, pan, tobacco, etc. However, food prices remained elevated at 8.7% in April versus 8.52% in March due to a rise in prices of cereals, meat/fish, and fruit. The inflation print remained above the central bank’s target of 4% but stayed within the tolerance band of 2-6%. Meanwhile, inflation based on wholesale prices accelerated to a 13-month high of 1.26% in April from 0.53% in March driven mainly by food articles as rice, pulses, and vegetables continued to post double-digit inflation.

  • The growth in India’s industrial output, as measured by the Index of Industrial Production (IIP), decelerated to 4.9% YoY in March from 5.6% in February due to a slowdown in output growth in mining and infrastructure/construction goods. For the full year FY24, the IIP growth quickened to 5.8% YoY from 5.2% in the previous year driven by a pickup in manufacturing and construction goods output.

  • India’s merchandise trade deficit stood at a 4-month high of US$19.1 billion in April due to a surge in gold and oil imports and a marginal rise in exports. It rose sharply from the 11-month low of US$15.6 billion in March. Exports during the month were affected by seasonal factors.
  • Passenger vehicle sales in the domestic market grew 1.3% YoY to 3,35,629 units in April, data from the Society of Indian Automobile Manufacturers (SIAM) revealed. Sales in the passenger car segment dipped by 23.4% while that in the two-wheeler segment grew sharply by 31% during the month.
  • Net foreign direct investment (FDI) into India plummeted over 62% in FY24 to US$10.6 billion due to increased repatriation of capital and Indian companies’ investments abroad, revealed RBI data. On a gross basis, FDI stood at US$70.9 billion, of which, US$44.4 billion was repatriated through dividends, share sales, or disinvestment while US$15.96 billion was invested overseas by Indian entities. Over 60% of FDI equity flows went to sectors including manufacturing, electricity, computer services, financial services, and retail and wholesale trade. Most of them came from Singapore, Mauritius, the US, the Netherlands, Japan, and the UAE.

Growth forecasts

  • As per the May Bulletin of the Reserve Bank of India (RBI), India’s GDP growth is likely to be 7.5% in the June 2024 quarter driven by rising aggregate demand and non-food spending in the rural economy. It also noted that retail inflation eased last month to 4.8% from 4.9% in March but indicated an uneven pace of alignment with RBI’s target. The alignment has been sluggish as the prices of vegetables, cereals, pulses, meat, and fish may keep the headline inflation elevated and closer to 5% in the near term. This is likely to delay the rate-cut cycle to kick in. The bulletin mentioned that the alignment with the 4% target may begin in the second half of the fiscal year.

Global Economic Updates

 Central bank policy actions

  • The US Federal Reserve maintained the status quo by keeping the federal funds rate target range at 5.25%-5.50% for the 6th consecutive time in its May meeting, citing “a lack of further progress toward the committee’s 2% inflation objective”. Although the Fed is moving towards eventual reductions in the target range it is concerned about recent inflation prints that have been dissatisfactory.
  • The Reserve Bank of Australia maintained the status quo by keeping the policy rate steady at 4.35% following the view that inflation was going down more slowly than expected. The central bank mentioned that there is still excess demand while labour market conditions are tighter. The Bank of England maintained its key bank rate at a 16-year high (since 2008) of 5.25%, in line with expectations. The decision came on the back of inflation that remains elevated despite coming down. However, the governor indicated a rate cut later this year as inflationary pressures ease further.

Inflation readings 

  • Annual inflation rate in the US softened to 3.4% in April (and 0.3% MoM), in line with expectations, from 3.5% in March, which was the highest level since September. The core inflation, which excludes volatile food and energy prices, was 0.3% on a monthly (smallest since December 2023) and 3.6% on an annual basis (lowest since April 2021). Producer price inflation came in at 0.5% MoM, higher than the consensus of 0.3%, and 2.2% YoY in April. Prices for services rose 0.6% MoM, the most since July 2023.

  • Consumer inflation in China accelerated to 0.3% YoY in April 2024 from 0.1% in March. Food inflation continued to decelerate (-2.7% vs -2.7% in March) while non-food inflation accelerated (0.9% vs 0.7% in March) in April.
  • Other Inflation readings: In the Euro zone, inflation slightly eased to 2.4% in April from 2.6% in the previous month. Core inflation, which strips out food and energy prices, eased to 2.7% in April from 2.9% in March. Services recorded the highest inflation (3.7%) followed by food, alcohol & tobacco (2.8%), and non-energy industrial goods (0.9%). Among the member states, Belgium recorded the highest inflation followed by Croatia, Austria, and Spain. In Canada, retail inflation softened to 2.7% in April from 2.9% in March. The inflation rate is the lowest since March 2021. In the UK, inflation cooled off to 2.3% from 3.2% in March and is approaching closer to the central bank target marking its lowest level in nearly three years. In Japan, inflation softened to 2.5% in April from 2.7% in March as food prices rose the least in 19 months and prices of furniture & household utensils, healthcare, etc., eased.

Other economic indicators

  • The consumer sentiment in the US, estimated as an index by the University of Michigan, fell from 79.4 in March (the highest level since July 2021) to 77.2 in April, which was lower than the consensus estimates of 77.9. The fall is attributed to consumers’ uncertainty about the future trajectory of the economy due to the impending election. Economic sentiment indicator in the Euro Area unexpectedly dropped 0.6 points to 95.6 in April 2024 (expectation was 96.9) due to a sharp decline in confidence among manufacturers, which reached its lowest level since July 2020 (-10.5 vs -8.9 in March). The sentiment also deteriorated among service providers (6.0 vs 6.4), retailers (-6.8 vs -6.0), and constructors (-6.0 vs -5.6). Consumer confidence in Japan dipped from 39.5 in March (the highest reading since April 2019) to 38.3 in April and came in below the consensus of 39.7. This happened as the households’ sentiments weakened towards factors like the income growth, employment, willingness to buy durable goods, and overall livelihood.
  • The business activity in the US manufacturing sector contracted as reflected in the ISM Manufacturing PMI which fell from 50.3 in March to 49.2 in April, which is below market expectations. This happened as the new orders index declined to 49.1 from 51.4 in March.
  • The U.S. economy added 175,000 jobs in April 2024, which is the slowest pace of additions in 6 months and came in much below the market consensus of an increase of 243,000. With this, the unemployment rate rose from 3.8% to 3.9% in the month. This might give some confidence to the US Fed officials about the inflation restoring to its 2% target over time.
  • The unemployment rate in the Eurozone stood at a record low of 6.5% in March, the same as in every month since November 2023, and came in line with market expectations. The youth unemployment rate (people under 25 years of age seeking employment) declined from 14.4% in February to 14.1% in March. 
  • UK’s unemployment rate deteriorated to 4.3% in the Jan-Mar quarter from 4.2% in the December quarter, in line with market expectations. Meanwhile, the UK economy grew 0.6% quarter over quarter in Jan-Mar 2024, above forecasts of 0.4%, preliminary estimates revealed.
  • Services Purchasing Manager’s Index (PMI) readings: The ISM Services PMI in the US plunged to 49.4 in April from 51.4 in March, which is the lowest reading since December 2022, and missed market expectations of 52. Services PMI in the Eurozone rose to 53.3 in April from 51.5 in March, marking the strongest growth in nearly a year and exceeding the initial estimate of 52.9. The services PMI in Japan was revised lower to 54.3 (from a preliminary estimate of 54.6) in April compared with 54.1 in March. The Services PMI in India declined to 60.8 in April from 61.2 in March but marked the 33rd straight month of expansion in services activity.


 Disclaimer:

The details mentioned above are for information purposes only. The information provided is the basis of our understanding of the applicable laws and is not legal, tax, financial advice, or opinion and the same subject to change from time to time without intimation to the reader. The reader should independently seek advice from their lawyers/tax advisors in this regard. All liability with respect to actions taken or not taken based on the contents of this site are hereby expressly disclaimed.

DATE
May 6, 2024
PLACE
Mumbai
READING TIME
10 mins

The Month That Was – Macroeconomic takeaways from the month of April 2024

Domestic Economic Updates

  • The Reserve Bank of India in the first Monetary Policy Committee (MPC) meeting of FY2024-25 kept the repo rate unchanged at 6.5%. It was the 7th consecutive time the key policy rate has been kept at the same level. The 6-member committee also maintained the policy stance at ‘withdrawal of accommodation’. FY25 GDP growth forecast has been kept unchanged at 7% while the inflation forecast based on the consumer price index (CPI) has remained unchanged at 4.5% for the fiscal year.
  • The Centre’s GST collection in March became the second highest in FY24 at INR 1.8 lakh crore despite the adverse impact of a weaker integrated GST (IGST) on imports of goods. With this, GST collection for the full fiscal year stood at INR 20.2 lakh crore, depicting a YoY growth of 11.7%. Domestic transactions contributed the most to GST collection in March as gross receipts from such transactions grew by 17.6%.

  • India’s retail inflation based on the Consumer Price Index (CPI) eased to a 10-month low of 4.85% in March from 5.09% in February. The inflation was broadly in line with expectations and remained within the Reserve Bank of India’s (RBI) medium-term tolerance band of 2-6%. The decline in inflation can be attributed to a fall in inflation in categories like food (8.52% in March vs 8.66% in February), fuel and light (-3.24% vs -0.77%), and housing (2.77% vs 2.88%). The wholesale inflation accelerated to a 3-month high of 0.53% in March from 0.2% in February driven by primary articles (food and non-food items like oil seeds, minerals, and crude), fuel and power, and manufactured products. The annual rate of inflation for primary articles rose to 4.51% in March from 4.49% in February; fuel and power increased to -0.77% in March from -1.59% in February; manufactured products rose to -0.85% in March from -1.27% in February.

  • The growth in India’s Index of Industrial production reached a 4-month high of 5.7% in February from 3.8% in January driven by a broad-based rise in mining, manufacturing, and electricity output. Following are the growth in index components:

  • India’s merchandise trade deficit narrowed to US$15.6 billion in March from US$18.71 billion in February, and US$16.02 billion in January. It is the lowest deficit in 11 months. The previous low was US$14.44 billion in April 2023. India’s goods exports slipped 0.7% YoY to US$41.7 billion in March, led by lower oil exports even though non-oil exports remain strong. On the other hand, goods imports declined 6% YoY to US$57.3 billion, due to lower gold imports. Meanwhile, net services exports declined 6.2% YoY to US$12.7 billion
  • India’s net direct tax collections rose ~18% YoY to INR 19.58 lakh crore in FY24. It surpassed the annual budget estimates by INR 1.35 lakh crore and the revised estimates by INR 13,000 crore. This will aid the fiscal deficit target achievement for the fiscal year, which is 5.8% (lowered from 5.9% earlier).
  • India’s net foreign direct investment (FDI) plunged 45.5% YoY in the first 11 months of FY24 (April 2023 to February 2024) to US$14.6 billion. Repatriation/disinvestment by those who made direct investments in India rose ~41% to US$38.3 billion in the period from US$27.2 billion in the same period a year ago.

Growth forecasts

  • The World Bank has revised its FY24 GDP growth projection for the Indian economy from 6.3% to 7.5% due to robust growth in the December 2023 quarter. However, the global agency’s growth projection for FY25 has been moderate as it raised the estimate by 20 basis points to 6.6%. It expects a slowdown in growth between FY24 and FY25 due to a “deceleration in investment from its elevated pace in the previous year”.
  • The Asian Development Bank has revised India’s GDP growth forecast for FY25 to 7% from the earlier projection of 6.7%, stating that the growth will be driven by strong public and private sector investment demand as well as gradual improvement in consumer demand. However, the projection is lower than the 7.6% it had earlier projected for FY23. For FY26, ADB has projected India’s growth at 7.2%.
  • The International Monetary Fund (IMF) revised India’s FY25 GDP growth projection upwards by 30 basis points (bps) to 6.8% due to buoyant domestic demand and rising working-age population. However, the estimate is below the 7% growth estimate for FY25 by RBI. In its January report, the IMF raised India’s GDP growth forecast for FY24 by 110 bps to 7.8%, which is higher than the estimate of 7.6% by the National Statistical Office. For FY26, the IMF expects the growth to slow down slightly to 6.5%.

Global Economic Updates

 Central bank policy actions

  • The European Central Bank (ECB) kept its interest rates unchanged at record-high levels of 4.5% for a 5th consecutive time. The deposit facility rate is kept unchanged at 4%, which is the highest level since the introduction of the single currency in 1999. The refinancing and marginal lending facility rates are fixed at 4.50% and 4.75%, respectively.
  • The People’s Bank of China kept the key rates unchanged —the 1-year loan prime rate (LPR) at 3.45% and the 5-year LPR at 3.95% — following a record reduction of 25 basis points (bps) in February. This happened after the GDP growth in the country came in at 5.3% YoY in the first quarter significantly beating market expectations.
  • The Bank of Japan kept its short-term interest rate unchanged at around 0% to 0.1%, as widely expected. This happened after the central bank announced its first rate hike since 2007 in March. The status quo indicates that inflation is on track to durably hit its target of 2% in coming years.
  • The Central Bank of Indonesia raised the 7-day reverse repurchase rate by 25 bps to 6.25% in a surprise move which is explained by the Governor as an “anticipatory, forward-looking, and pre-emptive” policy response to the rise in global crude oil prices and the depreciation in Indonesian rupiah. It is the highest rate since the bank made the instrument its main policy rate in 2016.

Inflation readings

  • Consumer price inflation in the US accelerated for a second straight month to the highest level since September at 3.5% YoY in March. This was compared to 3.2% in February and a consensus of 3.4%. Producer prices in the US rose 2.1% YoY, which is the highest in 11 months.

  • Consumer price inflation in the UK declined to its lowest level in two and a half years at 3.2% in March from 3.4% in February due to the softening of food prices. However, the inflation was below the consensus estimates of 3.1% and remained above the Bank of England’s target of 2%. However, given the direction of movement, economists believe inflation is likely to fall further in April.
  • Consumer price inflation in the Euro Area slipped to a 4-month low of 2.4% in March from 2.6% in February but still exceeded the European Central Bank’s target of 2%. Inflation for food, alcohol, and tobacco went down in March compared to February.
  • Consumer price inflation in Japan declined to 2.7% in March from February’s 3-month peak of 2.8% and met the consensus estimates. Prices reduced in categories like transport (2.9% in March vs 3% in February), clothes (2% vs 2.6%), furniture & household utensils (3.2% vs 5.1%), healthcare (1.5% vs 1.8%), communication (0.2% vs 1.4%), and culture & recreation (7.2% vs 7.3%).
  • Consumer price inflation in China decelerated to 0.1% YoY in March compared to 0.7% in February and consensus estimates of 0.4%. The deceleration is attributed to a seasonal decrease in demand for food and travel services after the Spring Festival holidays. Meanwhile, producer prices in the country declined 2.8% YoY in March compared to 2.7% in February. It is in line with consensus estimates.

Other economic indicators

  • The US economy started 2024 with a slower quarterly growth due to a decline in private inventory, a rise in imports, and sluggish growth in private consumption at 2.5% compared with a 3.3% growth in Q42023. Fixed investment and government spending at the state and local level remained solid contributing positively to the GDP growth. The Q12024 annualised growth of 1.6%, when adjusted for seasonality and inflation, is lower than the consensus estimates of 2.4%

  • Purchasing Managers’ Index (PMI) readings: The manufacturing PMI reading for March by the Institute for Supply Management (ISM) for the US indicated a rebound in the sector after one and half years (since September 2022) due to a sharp pick up in production and new orders. It increased to 50.3 (above 50 indicates expansion) in March 2023 from 47.8 (below 50 indicates contraction) in February and surpassed the consensus estimates of 48.4. The HCOB Eurozone Manufacturing PMI came in at 46.1 in March 2024 versus 46.5 in February. The March reading is a 3-month low due to changes in suppliers’ delivery times and stocks of purchases. The Caixin General Manufacturing PMI for China increased to 51.1 in March from 50.9 in February driven by higher output and a rise in input purchases by Chinese manufacturers. The au Jibun Bank Japan Manufacturing PMI came in at 48.2 in March 2024 versus 47.2 in February. It was the 10th straight month of contraction in factory activity, but the softest contraction since November 2023, amid a lower reduction in output and new orders. The HSBC India Manufacturing PMI jumped to a 16-year high at 59.1 in March from 56.9 in February. This happened as India’s manufacturing output grew for the 33rd consecutive month driven by the momentum in consumer, intermediate, and investment goods sectors. The J.P. Morgan Global Manufacturing PMI increased marginally to 50.6 in March from 50.3 in February, making its highest reading since July 2022. This happened due to an acceleration in manufacturing output growth in the US and China while India led the rankings. There are some improvements in Euro zone despite being an overall lag. JP Morgan noted a steep downturn in Germany and Austria, further contraction in France, and a fresh decline in Ireland.


  • Services PMI: The ISM Services PMI in the US declined to 51.4 in March from 52.6 in February and came in below the consensus estimate of 52.7. The decline is led by sluggish growth in new orders and a contraction in employment. The S&P Global UK Services PMI slipped to 53.1 in March from 53.8 in February. Despite the moderation, the expansion continued with resilient business and consumer spending reported by companies. The au Jibun Bank Japan Services PMI revised lower to a 7-month high of 54.1 in March versus 52.9 in February, indicating a 19th straight month of expansion in the service sector, led by higher demand and growing customer base.
  • Retail sales in the US increased more than expected by 0.7% MoM in March compared to a forecast of 0.3%. Sales growth in February has been revised upwards from 0.6% to 0.9% MoM. The sales growth is driven by a strong rise in receipts at online retailers.
  • Industrial production in the Euro Area and the European Union fell 6.4% and 5.4% YoY in February. In Euro zone, it extended the 6.6% contraction in January. Among the EU member states, the highest monthly gain in industrial output was recorded in Ireland (3.8%), Hungary (3.5%), and Slovenia (3.3%) whereas the largest declines were observed in Croatia (4.6%), Lithuania (3%), and Belgium (2.7%).
  • The Chinese economy grew better than expected in the first quarter of CY2024 at 5.3%, higher than the consensus estimates of 4.6%. The growth is attributed to improvements in high-tech manufacturing. It also marked an acceleration in growth from 5.2% in the previous quarter.


Disclaimer:

The details mentioned above are for information purposes only. The information provided is the basis of our understanding of the applicable laws and is not legal, tax, financial advice, or opinion and the same subject to change from time to time without intimation to the reader. The reader should independently seek advice from their lawyers/tax advisors in this regard. All liability with respect to actions taken or not taken based on the contents of this site are hereby expressly disclaimed.

DATE
April 5, 2024
PLACE
Mumbai
READING TIME
10 mins

The Month That Was – Macroeconomic takeaways from the month of March 2024

Domestic Economic Updates

  • Purchasing Managers’ Index (PMI) readings: India’s manufacturing sector activity grew at the fastest pace in 5 months as reflected in the HSBC India Manufacturing PMI reading. The index rose to 56.9 in February (revised upwards) from 56.5 in January driven by a rise in factory production and sales. Meanwhile, India’s services sector activity continued to expand although the momentum eased due to a slowdown in new orders and output. HSBC Services PMI came in at 60.6 in February (lower than the flash estimate of 62) compared to 61.8 in January.
  • India’s unemployment scenario has been improving since the COVID-19 pandemic driven by a pickup in economic activity after gradual unlocking. According to the report by National Sample Survey Organisation (NSSO), the unemployment rate for individuals aged 15 and above (defined as the percentage of unemployed individuals in the labour force) came down to 3.1% in 2023 from 3.6% in 2022. Similar positive trend has been witnessed in unemployment among males and females.

  • India’s consumer price/retail inflation (CPI) went down marginally to 5.09% YoY in February from 5.1% YoY in January thereby easing to a 4-month low and remaining within the RBI’s tolerance band of 2-6%. The headline inflation kept steady on a sequential basis due to a rise in prices of certain food items (like cereals and fish) offset by a decline in prices of other food items (like spices, eggs, and edible oil). Overall food inflation rose to 8.66% in February from 8.3% in January. The vegetable inflation increased to 30.25% in February from 27.03% in January. The fuel and light inflation declined further to -0.77% in February from -0.60% in January.
  • India’s wholesale price inflation (WPI) eased to a 4-month low of 0.20% YoY in February from 0.27% in January coming in below the consensus estimates of 0.25%. The moderation in WPI is attributed to a sharp fall in prices of manufactured products (-1.27% vs. -1.13% in January) and power (-1.59% vs. -0.51% in January). Food inflation rose to 4.09% YoY in February from 3.79% in January while prices of primary articles (food particles, minerals, and vegetables) went up 4.49% YoY vs. 3.84% in January.

  • India’s industrial output, as depicted by the Index of Industrial Production (IIP), increased by 3.8% YoY in January 2024, decelerating from 4.2% YoY in December 2023 (revised from 3.8%). The slowdown is caused by the declaration in the growth of manufacturing output (which accounts for over 77% of the overall industrial output) to 3.2% in January from 4.5% in December 2023. This more than offset the growth in mining and electricity production (5.9% and 5.6% vs. 5.2% and 1.2%, respectively in December 2023).

  • India’s merchandise trade deficit widened to US$18.71 billion in February from US$17.49 billion in January. This happened as imports rose 12.2% YoY at US$60.1 billion while exports increased 11.9% YoY to US$41.4 billion, led by higher shipments of engineering goods, electronic items, and pharma products. Total exports are the highest in the current fiscal year. Gold imports during the month surged ~134% to US$6.15 billion.

  • India’s current account deficit (CAD), which is the excess of imports of goods and services over exports of goods and services, narrowed both MoM and YoY bases in the third quarter of FY24 ended December 2023. The CAD reduced to US$10.5 billion or 1.2% of GDP in Q3FY24 from US$11.4 billion or 1.3% of GDP in the September quarter/Q2FY24 and US$16.8 billion or 2% of GDP in Q3FY23. The decline is attributed to higher net services exports (driven by software, business, and travel services) at US$45 billion and remittances at US$29 billion (see chart).

Growth forecasts

  • Global rating agency Moody’s upgraded India’s CY2024 GDP growth forecast from 6.1% earlier to 6.8% based on “stronger-than-expected” economic data and mentioned that the country will remain the fastest growing among G20 nations. In Oct-Dec 2023, India’s economy grew 8.4% surpassing analysts’ expectations of 6.6%, which Moody’s attributed to the government’s capital spending and vigorous manufacturing activity.
  • Fitch Ratings revised the GDP growth forecast for India upwards by 0.5 percentage points (ppt) to 7% in FY25, expecting strong expansion in the economy to continue. The rating agency believes domestic demand, particularly investment, will be the main catalyst of growth in the country, supported by sustained levels of business and consumer confidence. The agency also raised the global growth forecast by 0.3 ppt to 2.4% for 2024. The growth forecast for the US has been upgraded to 2.1% from 1.2% for the year. However, the forecast for China has been trimmed to 4.5% from 4.6% for 2024 due to a weaker outlook on the real estate market and rising evidence of deflationary pressures.
  • The US-based market intelligence and credit rating provider S&P Global raised India’s GDP growth forecast by 0.4 percentage points to 6.8% for FY25 on the back of robust domestic demand and recovery in exports. However, the forecast is lower than the Centre’s official estimate of 7.6%. It also expects the Reserve Bank of India (RBI) to cut repo rate by 75 basis points in FY25 as consumer inflation is expected to decline further.

Global Economic Updates

 Central bank policy actions

  • The US Federal Reserve kept the federal funds rate steady at a 23-year high of 5.25%-5.5% for a 5th consecutive time, which is in line with market expectations. However, most members of the Federal Open Market Committee (FOMC) are still projecting three rate cuts later in 2024, according to the Fed’s Summary of Economic Conditions. The US policymakers revealed that while inflation is coming down, it “does not expect it will be appropriate” to cut rates until the bank is confident about inflation moving towards its 2% target.
  • The Bank of Japan (BOJ) officially ended its negative interest rate policy by increasing its key interest rates for the first time in 17 years from -0.1% to a range of 0- 0.1%. Economists believe the next rate hike might occur in the second half of 2025. In 2016, Japan cut the interest rate below zero in order to stimulate the country’s stagnating economy and encourage people to spend their money rather than depositing in a bank. BOJ also announced that it would abandon its yield curve control (YCC) policy, also introduced in 2016, which saw it buying Japanese government bonds to control interest rates. BOJ Governor Kazuo Ueda stated that the decision to end negative interest rates is the wage arbitration that is currently taking place between employers and unions and major corporations hiking wages for their workers.
  • The Reserve Bank of Australia (RBA) decided to keep the cash rate target unchanged at 4.35% and the interest rate paid on Exchange Settlement balances steady at 4.25%. The RBA noted that inflation continues to moderate, in line with its recent forecasts driven by moderating goods inflation. However, services inflation remains elevated and has been moderating at a more gradual pace. Despite encouraging signs of moderating inflation, RBA is of the view that the economic outlook remains uncertain.
  • People’s Bank of China left its 1-year loan prime rate (LPR) steady at 3.45%, while the 5-year LPR was kept unchanged at 3.95%. This is in line with market expectations after the central bank kept its key policy rate steady last week. China has forecasted an economic growth target of ~5% for 2024 while it needs to revive its struggling property sector. Most new and outstanding loans in China are based on the 1-year LPR, while the 5-year rate influences the pricing of mortgages.
  • China’s central bank left a key policy rate unchanged at 2.5% for its 387-billion-yuan (US$54 billion) worth of one-year medium-term lending facility (MLF) loans to some financial institutions. The status quo was in line with expectations. With 481-billion-yuan (US$67 billion) worth of MLF loans set to expire this month, the operation resulted in a net 94-billion-yuan (US$13 billion) fund withdrawal from the banking system.
  • The Bank of Canada (BoC) kept its key overnight rate at 5% as part of its continued efforts to bring inflation down to its target level of 2%. In January 2024, inflation dipped to 2.9% but remained above the target level. BoC hiked the rate to 5% in July 2023, marking the first time since April 2001 that the rate had hit the 5% mark.

 Inflation readings 

  • Consumer price inflation in the US edged up to 3.2% YoY in February from 3.1% YoY in January and came in above the consensus estimates of 3.1%. The rise is attributed to a rise in shelter and gasoline price indices, which contributes over 60% to the monthly rise in the overall index. Although the inflation is off the mid-2022 peak, it is still above the Fed’s target level of 2%.

  • Consumer price inflation in the UK dropped to the lowest level since September 2021 at 3.4% in February from 4% in January. The softness is attributed to a slowdown in prices of food and restaurants. However, the inflation is still above the Bank of England’s target of 2% fuelling the speculation that the central bank might hold on to the interest rates at the same level in the next meeting.

  • Consumer price inflation in the Euro zone declined to 2.6% YoY in February from 2.8% in January. However, it remained above the consensus estimates of 2.5%. The decline is attributable to a fall in food and drink costs (rose 4% in February vs. 5.6% in January) and energy prices (fell 3.7% in February). Core inflation, which excludes volatile energy, food, alcohol, and tobacco prices, declined to 3.1% in February from 3.3% in January.
  • The annual inflation in Japan rose to 2.8% in February from 2.2% in January, hitting the highest level since last December 2023. The inflation accelerated as energy subsidies introduced by the government in February 2023 started losing their effect. The core inflation surged to a 4-month high of 2.8% from 2% in January and came in above the central bank’s target of 2% for 23 straight months.

Other economic indicators

  • PMI readings: The ISM Manufacturing PMI in the US declined to 47.8 in February from 49.1 in January and came in below the consensus estimates of 49.5. The further contraction in the manufacturing activity is attributed to declines in the new orders index from 52.5 in January to 49.2 in February and the production index from 50.4 to 48.4, the lowest level since July 2023. The ISM Services PMI in the US declined to 52.6 in February from 53.4 in January depicting continued expansion in the sector for the 14th consecutive month. The S&P Global UK Manufacturing PMI rose to 47.5 in February (revised upwards) from 47 in January. Despite the rise, PMI data indicated a contraction in the manufacturing sector for the 19th consecutive month due to disruptions in production and vendor delivery schedules led by the crisis in the Red Sea. The Caixin China General Service PMI declined further for the second straight month to 52.5 in February from 52.7 in January and 52.9 in December 2023. Despite being in the expansionary zone for the 14th straight month, the subsequent decline in the index is led by a subdued rise in new orders compared to the average recorded in 2023. The au Jibun Bank Japan Services PMI rose to 52.9 (revised higher from 52.5) in February from January’s 4-month peak of 51.5 driven by domestic demand in the sector. It marks the 18th straight month of expansion in the sector (above the 50 threshold) driven by an uptick in new businesses amid tourism demand and product launches. The J.P. Morgan Global Composite Output Index rose to 52.1 in February from 49.7 in January indicating a transition from contraction to expansion in global economic activity and new orders. The recovery is led by the services sector and the first expansion of manufacturing output since July 2023.
  • The unemployment rate in the US inched up to 3.9% in February from 3.7% in January. The February rate was the highest since January 2022 and exceeded market expectations of 3.7%. The labor force participation rate was 62.5% in February for the third consecutive month.

Disclaimer:

The details mentioned above are for information purposes only. The information provided is the basis of our understanding of the applicable laws and is not legal, tax, financial advice, or opinion and the same subject to change from time to time without intimation to the reader. The reader should independently seek advice from their lawyers/tax advisors in this regard. All liability with respect to actions taken or not taken based on the contents of this site are hereby expressly disclaimed.

DATE
March 8, 2024
PLACE
Mumbai
READING TIME
10 mins

The Month That Was – Macroeconomic takeaways from the month of February 2024

Global Economic Updates

 Central bank policy actions

  • The Federal Open Market Committee (FOMC) kept the benchmark interest rates unchanged at 5.25%-5.50% for the 4th consecutive time as expected by the Street. Since March 2022, the US Federal Reserve hiked rates 11 times to combat inflation. As per the previous FOMC meeting, rate cuts are likely to happen in 2024. However, the Fed’s recent policy statement cast doubt on the prospect of a rate hike on the immediate horizon.
  • The European Central Bank (ECB) maintained the status quo on its benchmark interest rates at the record high level of 4% in order to make sure inflation is firmly under control before any rate cut decision, which is expected later this year. ECB President Christine Lagarde said, “We need to be further along in the disinflation process before we can be sufficiently confident that inflation will actually hit the target in a timely manner”.
  • The Bank of England (BoE) maintained the status quo on its interest rates, as expected, at the 15-year high of 5.25%, which stood since August following the end of nearly 2 years of rate hikes. The decision came with a majority of 6-3. The bank is still cautious about the surge in inflation as it’s still above the target level of 2% and hovering around 4% currently.
  • The Central Bank of Philippines (BSP) kept its benchmark interest rates unchanged as the bank perceives the risks of inflation to be receded but remain tilted upward. Its 7-member monetary board kept its target reverse repurchase rate at 6.5% and held the overnight deposit and lending rates at 6% and 7%, respectively.
  • China’s central bank cut its 5-year loan prime rate for the first time since last June by 25 basis points to 3.95%. However, the bank left its 1-year rate unchanged at 3.45% to ease pressures on the troubled real estate market.
  • The Bank of Indonesia maintained the status quo on rates at 6% as widely expected to support its currency rupiah and limit imported inflation pressures. The central bank was upbeat about the 2024 global growth, driven by the US and India, and stayed positive on domestic growth prospects.

Inflation readings

  • Consumer price inflation in the US came in at 3.1% YoY in January, which is lower than 3.4% YoY in December 2023. However, it was higher than the consensus estimates of 2.9%. Core inflation, which excludes volatile food and energy prices, decelerated to 3.9% YoY in January from 3.7% in December but it came in above the market expectations of 3.7%. Despite the upward surprise caused by higher shelter and healthcare expenses, the downward trajectory in inflation following its surge in 2022 makes the situation favourable for a near-term interest cut in the US.

  • Consumer price inflation in the UK edged higher to 4% YoY in January from 3.9% in December 2023. However, it is lower than the consensus estimates of 4.2%. The upward pressure is led by housing and household services, mainly higher gas and electricity charges. Core inflation, which excludes volatile food, energy, alcohol, and tobacco prices, was 5.1% in the month, which was below the consensus estimate of 5.2%.

  • Inflation in Europe’s largest economy, Germany, dipped to its lowest level since June 2021 at 2.9% YoY in January 2024 compared with 3.7% YoY in December 2023 due to the favourable impact of falling energy prices, flash estimates revealed. However, the favourable impact of energy prices has masked the worrisome trend of monthly price increases for consumer goods and food.

 Other economic indicators

  • The US economy expanded at a sluggish rate in the final quarter of CY2023 at 3.2% compared to the earlier quarter growth of 4.9%. However, the GDP growth remained above 2% for the last 6 quarters driven by a rise in consumer and government spending, private investment, and exports defying fears of a recession in the world’s largest economy.

  • The growth in the US job market was surprisingly higher in January as nonfarm payrolls rose 353,000 in the month compared to the Dow Jones estimate of 185,000. The unemployment rate was 3.7% in the month, slightly lower than the estimate of 3.8%. The wage growth was also stronger as average hourly earnings increased 0.6%, which is 2x the monthly estimate.
  • Consumer confidence in the US recorded its third consecutive monthly rise hitting the highest level since July 2021. The University of Michigan sentiment rose to 79.6 in February from 79 in January, indicating resilience among consumers despite interest rates being at their highest level in over two decades.
  • The IMF, in its latest World Economic Outlook, raised the forecast for global growth by 0.2 percentage point (ppt) to 3.1% YoY for 2024 compared to the October forecast (the same as in 2023) due to resilience in the US and emerging economies and strong consumption-driven growth. For 2025, the growth is expected to accelerate to 3.2%. However, the UN agency is cautious about the outlook for Europe due to the impact of geopolitical conflicts, and tight monetary conditions, among other factors. It expects the growth in the block to be 0.5% in 2023 and 0.9% in 2024. The higher forecast for 2024 is attributed to stronger household consumption. For India, the IMF raised the growth forecast by 40 basis points (bps) to 6.7% for FY24 and 20 bps to 6.5% for both FY25 and FY26 due to resilience in domestic demand.
  • PMI readings: In the US, economic activity in the manufacturing sector remained in the contraction zone for the 15th consecutive month in January 2024. PMI reading by the Institute for Supply Management (ISM) came in at 49.1% in January, up 2 ppt from the seasonally adjusted 47.1% in December 2023. The slight improvement in the reading is led by a rise in new orders, fall in backlogs, and a rise in production. In China, the PMI reading for January came in at 49.2% compared with 49% in December 2023 due to higher production and a rise in orders. In India, the HSBC India Manufacturing PMI stood at 56.5 in January 2024 compared with 54.9 in December 2023. The improvement is driven by the strongest growth in the output and new orders since September and a further rise in export orders.
  • Composite PMI Readings: The J.P. Morgan Global Composite PMI, which tracks economic activity in the manufacturing and service sector across the globe, rose to 51.8 in January from 51 in December 2023. The January reading is the highest since June 2023 as service sector activity rose at the quickest pace since July 2023 and the manufacturing sector returned to the expansion territory for the first time in 8 months, driven by increased production in the consumer goods sub-industry.
  • Japan’s economy unexpectedly slipped into a recession led by sluggishness in consumption and capital expenditures. Its GDP fell at an annualised rate of 0.4% in Oct-Dec 2023 after a 3.3% decline in the prior quarter when the market expected a 1.4% rise for the quarter. With this, Japan lost the title of the world’s 3rd largest economy to Germany as the nominal GDP of the former was US$4.21 trillion compared with US$4.46 trillion for Germany in 2023.


Domestic Economic Updates

  • Union Budget: In the Interim Union Budget for FY 2024-25, Finance and Corporate Affairs Minister Nirmala Sitharaman announced the capital expenditure outlay of INR 11.1 lakh crore for the fiscal year, which is up 11.1% YoY and accounts for 3.4% of the GDP. The fiscal deficit is targeted to reduce below 4.5% of GDP by FY2025-26 (down from 5.8% as per the revised estimate for FY2023-24) from the estimated 5.1% of GDP for FY 2024-25. As per the First Advance Estimates of National Income of FY 2023-24, presented along with the Budget speech, India’s real GDP is expected to grow at 7.3%, which is closer to the RBI’s upward revision in growth projections to 7% for the fiscal year driven by strong growth in the second quarter.
  • RBI Monetary Policy: RBI’s Monetary Policy Committee (MPC) has unanimously decided to keep the repo rate unchanged at 6.5% for the sixth consecutive time. 5 out of 6 members voted to remain focused on the withdrawal of accommodation to progressively align inflation with the target (4% within a band of +/- 2%) while supporting growth. The MPC revealed optimism about the domestic economic activity which they expect to continue driven by the momentum in investment demand, positive business sentiments, and rising consumer confidence.
  • Projections: The MPC projected a 7% growth in real GDP for the next fiscal year 2024-25 (Earlier they have projected the same 7% real GDP growth for FY2023-24). However, the inflation projection has been lowered to 4.5% for FY25 from the forecast of 5.4% for FY24. (Refer to the table for the quarterly breakup of real GDP and inflation projections for the fiscal year 2024-25)

  • India’s retail inflation plunged to a 3-month low of 5.1% YoY in January after rising to a 4-month high of 5.69% YoY in December 2023. The fall is attributed to the moderation in food inflation, which softened to 8.3% in January from 9.53% in December 2023. Urban food inflation eased to 9.02% in January from 10.42% in December, while rural food inflation declined to 7.91% in January from 8.49% last December. The core inflation (excludes volatile food and fuel prices) in January declined to the 50-month low of 3.6% in January.
  • India’s wholesale inflation eased to a 3-month low of 0.27% YoY in January, which is further down from 0.73% in December 2023, led by moderation in food inflation, mainly vegetables. Wholesale food inflation declined to 6.85% in January from 9.38% in the prior month as vegetable prices softened to 19.71% in January from 26.3% in the prior month. Potatoes are in deflation while inflation in fruits, eggs, milk, fish, and milk have muted.

  • Industrial output, measured by the index of industrial production (IIP), grew 3.8% YoY in December compared with 2.4% YoY in November. The improvement is driven by a sharp uptick in manufacturing activity (up 3.9% YoY in Jan vs. 1.2% in Dec), while the mining and electricity sectors grew by 5.1% YoY and 1.2% YoY, respectively. In terms of the use-based categories, all showed improvement on a YoY basis except primary goods.

  • India is expected to become the 3rd largest economy in the next three years with a GDP of US$5 trillion, which may hit US$7 trillion by 2030 due to continued reforms, the Finance Ministry stated. Currently, India is the 5th largest economy with a GDP of US$3.7 trillion and the government has “set a higher goal of becoming a ‘developed country’ by 2047. With the journey of reforms continuing, this goal is achievable,” revealed the Ministry.
  • The growth in the output of eight core infrastructure sectors, which accounts for about 2/5th of the nation’s industrial output, dipped to a 15-month low of 3.6% YoY in January from the upwardly revised 4.9% YoY in December 2023 and the year-ago level of 9.7%. The deceleration is attributed to an unfavourable base, a fall in output in refinery products and fertilisers, and slower growth in three sectors including coal, steel, and natural gas.

  • India’s unemployment rate in urban areas dipped to 6.5% in Q3FY24 (Oct-Dec 2023) vs. 6.6% in Q2FY24, as per the Periodic Labour Force Survey. It’s the lowest reading since the start of their survey. The decline is caused by the fall in the male unemployment rate from 6% in Q2FY24 to 5.8% in Q3FY24 while the female unemployment rate remained flat at 8.6% in Q3FY24. Notably, the unemployment rate in urban areas has been falling steadily since the high of 12.6% in Q1FY22 (Apr-Jun 2021) due to Covid.
  • India’s merchandise exports escalated 3.1% YoY to US$36.9 billion in January, led by both oil and non-oil exports. Imports grew 3% YoY to US$54.4 billion led by oil and gold imports, while non-oil non-gold imports went down marginally. The merchandise trade deficit narrowed to a 9-month low of US$17.49 billion in January from US$19.8 billion in December 2023 as imports declined to US$54.41 billion in January compared with US$58.25 billion in December.

  • The HSBC India Services Purchasing Managers’ (PMI) Index, which tracks the economic activity in India’s service sector, rose to a 6-month high of 61.8 in January 2024 from 59 in December 2023 due to the fastest growth in new orders in 6 months and the highest growth in export sales (to countries like Afghanistan, Australia, Brazil, China, Europe, the UAE, and the US) in 3 months. The expansion in business volumes supported the job creation in January, which was the most pronounced in 3 months as well.

  • India’s private sector activity rose to a 7-month high as HSBC Flash India Composite PMI Output Index rose to 61.5 in February from 61.2 in January. The growth is driven by both manufacturing and service sector firms. Manufacturing activity rose to a 5-month high and services activity climbed to a 7-month high in February. Highest sales were recorded from Africa, Asia, Australia, Europe, the Americas, and the Middle East.

DATE
February 5, 2024
PLACE
Mumbai
READING TIME
10 mins

The Month That Was – Macroeconomic takeaways from the month of January 2024

Global Economic Updates

Central bank policy actions

  • The People’s Bank of China kept the benchmark lending rates unchanged for the 5th consecutive month in their recent statement. The 1-year loan prime rate (LPR) remained steady at 3.45% while the 5-year LPR is held at 4.2%. The LPRs are based on an average of the lending rates that China’s biggest banks offer their best clients.
  • The Central bank of Turkey raised its key interest rates by 250 basis points to 45% in its prolonged battle against double-digit inflation. However, the hike in the 1-week repo rate was in line with economists’ expectations. Inflation in the country rose to ~65% YoY in December 2023 from 62% YoY in November 2023 while the domestic currency Lira hit a record low against the greenback. Lira went down nearly 40% against the USD year to date and lost over 80% of its value against the same in the last 5 years.

Inflation readings 

  • Consumer price inflation in the US increased to 3.4% YoY in December 2023 from 3.1% in November 2023 and came in above the consensus estimate of 3.2%. Core inflation, which excludes volatile food and energy prices, declined to 3.9% YoY in December compared with 4% in November. Housing costs contributed over half of the overall increase in prices followed by escalating prices of energy and car insurance.

  • Consumer price inflation in the Euro Zone slightly accelerated to 2.9% YoY in December 2023 from an over 2-year low of 2.4% in November 2023, but came in below the market consensus of 3%, flash estimates revealed. The drop in energy prices eased to 6.7% YoY in December from 11.5% in November. Meanwhile, the annual rise in prices of alcohol, and tobacco continued to soften.
  • Consumer Price inflation in Australia decreased to a near 2-year low of 4.3% YoY in November 2023 from 4.9% in October and came in lower than market forecasts of 4.4%. The segments witnessing significant price rises during the month were housing (+6.6%), food and non-alcoholic beverages (+4.6%), insurance and financial services (+8.8%), and alcohol and tobacco (+6.4%).
  • Japan’s consumer price inflation in December 2023 softened to the lowest level since July 2022 at 2.6% YoY compared with 2.8% in November 2023 driven by lowest rise in food prices in 14 months. Moderation in healthcare (2.4% vs 2.5%) and communication (4.8% vs 4.9%) costs in the country also led to the softer inflation during the month.

  • Consumer price inflation in the UK rose to 4% YoY in December 2023 from 3.9% YoY in the previous month due to a rise in alcohol and tobacco prices. It’s higher than the market consensus of 3.8%. Core inflation, which excludes volatile food, energy, alcohol, and tobacco prices, remained flat at 5.1% YoY in December 2023 compared to the previous month.

PMI Readings

  • Both Institute for Supply Management (ISM) and S&P Global Purchasing Managers’ Index (PMI) data for the US indicated continued stress in the sector due to a decline in output and a faster downturn in new orders. ISM manufacturing PMI rose slightly from 46.7 in November 2023 to 47.4 in December 2023 while S&P Global manufacturing PMI declined from 49.4 in November to 47.9 in December 2023. It was the 14th consecutive month that the PMI stayed below 50, which is the contraction zone.
  • PMI readings in China indicated some resilience in the economy. The Caixin China General Manufacturing PMI rose from 50.7 in November to 50.8 in December 2023, beating the consensus estimate of 50.4. This indicated improvement in the sector health in the four out of the past five months. A strong rise in output and new orders led to the improvement in activity. PMI readings in the services sector pointed to a sustained recovery. The Caixin China General Service PMI rose from 51.5 in November to 52.9 in December 2023, beating the consensus estimate of 51.6.
  • PMI reading for the services sector in the UK indicated continued strength in the sector. The S&P Global/CIPS UK Services PMI rose from 50.9 in November to 53.4 in December 2023, which is above the initial estimates of 52.7. This marked the second consecutive month of expansion in the UK services sector in sharp contrast to the contractionary trend in the Eurozone.
  • While most economic indicators in India indicated robust growth, its manufacturing PMI reading showed a downturn despite remaining in the expansionary zone. The HSBC India Manufacturing PMI declined from 56 in November to an 18-month low of 54.9 in December 2023. Economists noted that this could indicate expected moderation in activities in the fourth quarter of FY24 despite strong momentum in the sector.
  • Global economic activity strengthened at the end of 2023 driven by better inflows of new work and a pick-up in business confidence. The J.P.Morgan Global PMI Composite index increased from 50.5 in November to 51.0 in December. Services sector activity improved for the 11th successive month in December 2023 while the slide in manufacturing activity continued for the 7th consecutive month in the month at the global level.

 Other economic indicators

  • Consumer confidence in the US improved significantly on-year due to the downward trajectory of inflation and a better outlook on general economic conditions. It was captured in the rise in University of Michigan’s consumer sentiment index to the highest level since July 2021 at 78.8 in January 2024. The reading came in above the last month’s print of 69.7 and the forecast of 70 despite the public opinion showing concerns on the nation’s economic health.
  • Recessionary conditions in Germany that began at the end of 2022 GDP in Europe’s largest economy fell 0.3% YoY in full-year 2023 due to relentless inflationary pressures, higher energy prices, and weak exports. However, compared to the pre-Covid phase, in 2019, GDP rose 0.7% in the year.
  • China’s GDP grew 5.2% YoY in the fourth quarter of 2023, which is higher than the target set by Beijing (~5%) but lower than market expectations of 5.3%. The growth was marginally higher than 4.9% in the previous quarter. In 2023, the country’s industrial production grew 4.6% YoY, retail sales of consumer goods went up 7.2% YoY and investments in fixed assets rose 3% YoY.


Domestic Economic Updates

  • The growth in India’s index of industrial production (IIP) slowed to an eight-month low of 2.4% YoY in November due to moderation in manufacturing activity (1.2%), electricity (5.8%), and mining (6.8%) sectors, and a high base effect. In the index, 17 out of the 23 manufacturing industries (includes food, textiles, leather, wood, computers, and paper among others) witnessed contraction in November.

  • Retail inflation surged to a 4-month high of 5.69% in December 2023 from 5.55% in November 2023 due to higher prices of food items such as pulses, spices, fruits, and vegetables. The inflation continued to remain within the RBI’s tolerance band of 2-6% for the last 4 months. However, the core inflation declined to 48-month low of 3.89% in December 2023, the first time in the post-pandemic period, from 4.1% in November.

  • India’s wholesale price inflation climbed up to a 9-month high of 0.73% in December 2023 from 0.26% in November 2023 driven by higher prices of food articles, machinery and equipment, other manufacturing and transport equipment, computer, electronics, and optical products. This is the second month in a row the WPI-based inflation came in the positive territory after remaining negative for seven consecutive months.

  • India’s retail inflation for Agricultural Labourers (CPI-AL) and rural labourers (CPI-RL) rose to a multi-month high of 7.71% and 7.46% YoY, respectively due to an increase in prices of food items such as rice, wheat atta, jowar, bajra, maize, pulses, milk, meat goat, sugar, garlic, among others. Food inflation for farm and rural workers hardened to 9.95% and 9.8% in December 2023 compared to 9.38% and 9.14%, respectively, in November 2023. The maximum hike in CPI-AL and CPI-RL has been recorded by Andhra Pradesh driven by higher prices of rice, jowar, bajra, ragi, fruits and vegetables (especially brinjal, lady finger, cucumber), etc.

  • Output growth in India’s 8 core infrastructure sectors — Coal, Natural Gas, Crude Oil, refinery products, fertilisers, Cement, Steel, Electricity — indicated a slowdown as it decelerated from a 12% YoY in October to a 6-month low of 7.8% YoY in November 2023. The growth was higher than the 5.7% recorded in November 2022 but it’s the slowest one recorded since May 2023, when the output of 8 core sectors grew 5.2% YoY. Sectors that showed contraction include Crude Oil at (-0.4% YoY vs. 1.3% YoY in October 23) and Cement (-3.6% YoY vs. 17.4% YoY in October) mainly due to a high base effect. Meanwhile, sectors like refinery products, steel, coal, and electricity contributed the most to the YoY increase in the month.

  • The unemployment rate in India, among persons aged 15 years and above, softened from 8.9% in November to 8.7% in December 2023, according to a survey conducted by the Centre for Monitoring Indian Economy (CMIE). Despite easing, the rate remained at the higher range of 8-10% from October to December 2023. In October 2023, the unemployment rate was 9.4%.


Disclaimer:

The details mentioned above are for information purposes only. The information provided is the basis of our understanding of the applicable laws and is not legal, tax, financial advice, or opinion and the same subject to change from time to time without intimation to the reader. The reader should independently seek advice from their lawyers/tax advisors in this regard. All liability with respect to actions taken or not taken based on the contents of this site are hereby expressly disclaimed.

DATE
January 10, 2024
PLACE
Mumbai
READING TIME
10 mins

The Month That Was – Macroeconomic takeaways from the month of December 2023

Global Economic Updates

Central bank policy actions

  • The US Federal Open Market Committee (FOMC) unanimously kept the federal funds rate steady at the 22-year high target range of 5.25%-5.5% for the third time in a row. However, the median projection for interest rates at the end of 2024 has been reduced to 4.5% and 4.75%, signalling 75 basis points (bps) of cuts from current levels. Assuming 25 bps per cut, it translates to three rate cuts in 2024.
  • The European Central Bank (ECB) kept its key interest rates unchanged — main refinancing operations at 4.5%, the marginal lending facility at 4.75%, and the deposit facility at 4%. The rates have been kept steady for the second meeting in a row, following 10 consecutive hikes from July 2022 to September 2023. ECB stated, “While inflation has dropped in recent months, it is likely to pick up again temporarily in the near term.” Inflation in the Euro zone has been declining in the last two months from 4.3% YoY in September to 2.9% in October and then to 2.4% in November.
  • The Bank of England (BoE) kept its borrowing rates unchanged at a 15-year high of 5.25% for the third time in a row. Six of the nine members of the Monetary Policy Committee voted to keep rates steady while three opted for a quarter-point hike. However, rate hikes do not look imminent due to the cutback in consumer spending that has been affecting the British economy, which shrank unexpectedly by 0.3% in October following 0.2% growth in September. BoE’s policy actions have been successful in reducing the inflation from the 4-decade high of over 11% YoY in October 2022 to 4.6% on-year in October 2023 (vs. 6.7% in September). However, it’s still above the bank’s target level of 2%.
  • The Bank of Canada retained its key overnight rate at 5% while leaving the door open to another hike due to concerns about inflation while acknowledging an economic slowdown. The central bank hiked rates by a quarter point in both June and July to a 22-year high. Inflation decelerated to 3.1% YoY in October but remained above the target level of 2%.
  • The Bank of Japan (BoJ) maintained its ultra-loose monetary policy by keeping its interest rates at -0.1% while sticking to its yield curve control policy that sets the upper limit for 10-year government bond yield at 1% as a reference. The central bank prefers to wait for a longer time to make a decision for exiting the negative rate. BOJ Governor Kazuo Ueda said, “Uncertainty over the outlook is extremely high and we have yet to foresee inflation sustainably and stably achieve our target. As such, it’s hard to show now with a high degree of certainty how we can exit”.
  • Chinese banks maintained their benchmark loan prime lending rate — 1-year rate at 3.45% and 5-year rate at 4.2% — following a similar move by the People’s Bank of China (PBOC) of keeping its medium-term lending facility unchanged recently after a cut in August. This came amid the expectations of China’s top leaders maintaining supportive monetary policy in 2024, which indicates moderate cuts in policy rates in early 2024.

Inflation readings 

  • Consumer price inflation in the US cooled off to 3.1% YoY in November from 3.2% in October led by a decline in energy costs (gasoline prices fell 6% and fuel oil was down 2.7%). Core inflation, which excludes volatile energy and food prices, came in at 4 % during the month. Shelter prices, which account for nearly one-third of the CPI, rose 6.5% on annual basis, steadily declining since peaking in early 2023.

  • The US personal consumption expenditures (PCE) price index, a gauge used by the US Federal Reserve for inflation (as it’s based on what consumers actually spend on goods and services rather than the cost of goods and services as measured in the consumers price index), approached closer to the central bank’s inflation target of 2%. The headline PCE index rose 2.6% YoY in November 2023 versus 2.9% in October 2023 after peaking over 7% in mid-2022. The core PCE index (which excludes volatile food and energy costs) increased 3.2% YoY in the month, down from 3.4% in October 2023. On a monthly basis, the headline PCE fell 0.1% in November 2023, which is the first monthly decline since April 2020. Sliding energy prices is one of the key factors that kept inflation in check.

  • Annual inflation in the Euro zone fell to its lowest level since July 2021 at 2.4% YoY in November compared to 2.9% in October but it was in line with expectations. The fall is attributed to a sharp decline in energy prices (down 11.5% in November vs. 11.2% in October). Core inflation, which excludes volatile food, energy, alcohol, and tobacco prices, also decreased to 3.6% in November from 4.2% in October.
  • Consumer price inflation in Europe’s largest economy, Germany declined to 3.2% YoY in November from 3.8% YoY in October due to falling energy prices (4.5% YoY). It’s the lowest pace of price increases since June 2021 and weaker than the consensus estimates of 3.5%.
  • Annual inflation in Canada held steady in November at 3.1% YoY, which was the same pace as in the prior month. However, it was higher than expectations of 2.9% for the month. Higher mortgage interest costs, food prices, and rent caused consumers to cut back on purchases keeping the upward pressure on prices in check.
  • Annual inflation in the UK decelerated to 3.9% in November, which is the lowest since September 2021, from 4.6% in October and came in below the consensus estimate of 4.4%. The slowdown is attributed to a fall in fuel costs and softening of food inflation.
  • Consumer price index in China fell 0.5% YoY in November, which is steeper than the 0.2% decline in October. It was the fastest pace of decline since November 2020, led by declining food and energy prices. The intensified deflationary pressure suggests weak domestic demand in the economy.
  • Annual inflation in Japan eased to the 16-month low at 2.8% YoY in November 2023 compared to 3.3% in the prior month due to the least increase in food prices in 10 months (food prices rose 7.3% YoY in November 2023 vs. 8.6% in October 2023). The core inflation also softened to a 16-month low of 2.5% in November 2023. However, both are still above the 2% target set by the Bank of Japan.

PMI Readings

  • ISM Manufacturing Purchasing Manager’s Index (PMI) in the US remained unchanged at 46.7 in November compared to the previous month. However, it came below forecasts of 47.6, indicating a contraction in the manufacturing sector. New orders and inventories dipped at slower pace while pricing stability has been witnessed due to easing energy costs.
  • Activity in China’s manufacturing sector was restored to the expansionary phase as suggested by the General Manufacturing PMI, which climbed to 50.7 in November from 49.5 in October. The PMI reading is the highest since August and beat the market forecasts of 49.8.
  • India’s Manufacturing PMI improved to 56 in November from 55.5 in October, indicating expansion for the 29th month in a row. It is led by a strong demand and better input availability while improvements in the employment scenario helped.

Other economic indicators

  • The Japanese economy contracted 0.7% QoQ in Q3CY2023, compared with a flash estimate of a 0.5% decline and a downwardly revised growth of 0.9% in Q2CY2023. The contraction in GDP is the first since Q3CY2022 led by declines in private consumption, capital expenditures, and public investment.
  • Industrial output in the US grew 0.2% MoM in November, which is less than the expected rise of 0.3%. However, it is better than the revised 0.9% decline in the previous month. Manufacturing output, which comprises 78% of overall production, rose 0.3% MoM in November vs. 0.4% expected by analysts.


Domestic Economic Updates

  • The Reserve Bank of India’s Monetary Policy Committee (MPC) unanimously opted to keep the repo rate at 6.5% at the bi-monthly policy meeting last week. Meanwhile, the MPC has upheld its stance at ‘withdrawal of accommodation,’ with a 5:1 majority. The central bank has revised the GDP growth forecast upwards to 7% from the earlier projection of 6.5% as it anticipates a stronger revised growth of 6.25% in the second half of FY24 compared to the earlier estimate of 5.85%. However, the bank has retained the inflation projections at 5.4% for FY24, expecting a gradual alignment of quarterly headline inflation towards its 4% target by the second quarter of FY25.
  • Consumer price inflation rose to 5.55% YoY in November from 4.87% in October. It came in below market expectations of 5.7% and remained within the Reserve Bank of India’s tolerance band of 2-6% for the third month in a row but above the medium-term target of 4% for 50 consecutive months. Food inflation, which accounts for ~50% of the overall consumer price basket, increased to 8.7% in November, the highest in three months, from 6.61% in October, led by cereals, vegetables, pulses, and fruits. The core inflation reduced from 4.3% YoY in October closer to the RBI’s medium-term target of 4.1% in November. Thanks to moderation in prices of housing, clothing and footwear, fuel and light, and miscellaneous categories compared to October 2023.
  • Wholesale price inflation turned positive at 0.26% YoY in November after remaining negative since April 2023 and beat market estimates of a 0.08% rise. The uptick is attributed to higher prices of “food articles, minerals, machinery & equipment, computer, electronics & optical products, motor vehicles, other transport equipment and other manufacturing, etc.,” an official statement revealed. Food inflation was 8.18% in November compared to 2.53% in October.

  • Retail inflation for agricultural labourers (AL) and rural labourers (RL) increased moderately from 7.08% and 6.92% YoY, respectively, in October, to 7.37% and 7.13%, respectively, in November. The rise is attributed to an increase in prices of certain food items like rice, wheat, atta, pulses, onion, turmeric whole, garlic, and mixed spices.

  • Industrial output in India indicated strong resilience as the Index of Industrial Production (IIP) grew 11.7% in October (beating market expectations of 10%), which is a 16-month high, compared to a decline of 4.1% a year ago. Output across industries registered a double-digit growth except for a few like intermediate and consumer non-durable goods. Manufacturing output, which accounts for over three-fourths of the IIP, increased 10.4% YoY in October 2023 compared to a contraction of 5.8% in October 2022 and a growth of 4.5% in September 2023.

  • India’s GDP growth for the second quarter of FY24 (July-September 2023) came in at 7.6% YoY, surprising positively compared to the RBI estimate of 6.5% and the consensus estimate of 6.8% for the quarter. However, the growth moderated from the 4-quarter high of 7.8% in the previous quarter due to a slowdown in private consumption (3.1% YoY in Q2FY24 vs 6% in Q1FY24). The share of private consumption in the GDP has declined, however, there is a significant increase in the share of investments as shown in the Gross Fixed Capital Formation. The growth in Gross Value Added (GVA) was 7.4% YoY in Q2FY24, which is lower than 7.8% in Q1FY24 due to a slowdown in the agricultural sector led by the erratic monsoon.

  • S&P Global Ratings revised India’s GDP growth forecast upwards by 0.4 percentage points to 6.4% for FY24. The US-based ratings agency believes a strong momentum in the domestic economy will offset headwinds from food inflation and weak exports. The agency has however cut the growth forecast for FY25 from 6.9% to 6.4% due to subdued global growth, a higher base, and the lagged impact of rate hikes. In a recent report titled ‘China Slows India Grows’, the agency estimated India’s growth in 2026 to be 7% compared with 4.6% for China expecting Asia-Pacific’s growth engine to shift from China to South and Southeast Asia.
  • Philippines-based multilateral funding entity Asian Development Bank (ADB) upgraded FY24 growth projections for India from 6.3% to 6.7% due to higher-than-expected FY24 second quarter GDP growth (7.6%). For FY25, ADB has kept its growth forecast unchanged at 6.7%. Notably, RBI recently upgraded its growth forecast for FY24 from 6.5% to 7%.
  • The growth in India’s eight core sectors, comprising coal, crude oil, steel, cement, electricity, fertilisers, refinery products, and natural gas, came in at 12.1% YoY in October versus 9.2% (revised) in September, as per the data revealed by the Ministry of Commerce and Industry. A low base and double-digit growth in electricity, natural gas, coal, steel, and cement led to higher growth in the month.
  • India’s unemployment rate dropped to 9.16% in November from a 29-month high of 10.05% in October, due to a fall in unemployment in rural areas as November is the month when harvesting of the kharif paddy crop begins, and sowing of rabi-crops picks up. The rural unemployment rate declined to 9.05% in November (vs. 10.82% earlier), while the urban unemployment rate increased to 9.39% (vs. 8.44% earlier).

  • India’s gross fiscal deficit during April-October 2023 stood at ~INR 8 lakh crores, which is ~45% of its annual budgeted estimates. The deficit slightly narrowed from 45.6% reported in the comparable period a year ago. Total receipts were recorded at INR 15.9 lakh crores, while overall expenditure in the period stood at INR 23.9 lakh crores.
  • India’s current account deficit (CAD) narrowed to 1% of GDP in the second quarter of FY24 compared to 1.1% of GDP in the previous quarter and 3.8% of GDP in the same quarter a year ago. In absolute terms, CAD declined to US$8.3 billion in the second quarter of FY24 from US$9.2 billion in the first quarter of FY24 and US$30.9 billion in the second quarter of FY23. The decline in CAD is attributed to the moderation of the merchandise trade deficit, higher inflows from services trade, and higher remittances.


Disclaimer:

The details mentioned above are for information purposes only. The information provided is the basis of our understanding of the applicable laws and is not legal, tax, financial advice, or opinion and the same subject to change from time to time without intimation to the reader. The reader should independently seek advice from their lawyers/tax advisors in this regard. All liability with respect to actions taken or not taken based on the contents of this site are hereby expressly disclaimed.

DATE
November 30, 2023
PLACE
Mumbai
READING TIME
10 mins

The Month That Was – Macroeconomic takeaways from the month of November 2023

Global Economic Updates

 Central bank policy actions

  • The US Federal Open Market Committee unanimously held on to the 22-year high federal funds rate in a target range of 5.25%-5.5% for the second time in a row after following a spate of 11 rate hikes since March 2022 (including four in 2023) to combat inflation. This happens as the US economy showed strength and the labour market remains tight, despite the string of rate hikes. 
  • The Bank of Japan (BOJ) allowed more flexibility in its yield curve control as it retained the target level of its 10-year government bond yield at 0% but loosened the ‘upper bound’ to fluctuate to 1%. In its July meeting, BOJ committed to let yields fluctuate in the range of +/- 0.5 percentage points from its 0% target level. BOJ also raised the inflation forecast due to the prolonged effects of pass-through cost hikes, led by an increase in crude oil and import prices. The consumer price inflation forecast is raised from 2.5% to 2.8% for fiscal 2023; 1.9% to 2.8% for fiscal 2024; and 1.6% to 1.7% for fiscal 2025.
  • The Bank of England kept its benchmark interest rates unchanged at the 15-year high level of 5.25% for the second time in a row expecting inflation to slide further to ~4.5% in 2023 before continuing to dip further in 2024. UK’s inflation came in at 6.7% in September which is well above the long-term target of 2% but it fell considerably from the peak of 11.1% reported in October 2022.
  • The People’s Bank of China kept the benchmark lending rates – 1-year loan prime rate (LPR) and 5-year LPR unchanged at 3.45% and 4.20%, respectively, on the expected line. In China, new and outstanding loans are based on a 1-year LPR, and mortgage pricing is influenced by the 5-year LPR. The economic recovery of the world’s second-largest economy remains patchy calling for more monetary easing. However, such easing could put further downside pressure on the weakening yuan.
  • Indonesian central bank, Bank Indonesia (BI) also kept the benchmark 7-day reverse repo rate unchanged at 6%, as expected, to support the domestic currency rupiah amid global uncertainties. The country’s inflation rose from 2.28% in September to 2.56% in October, but it remained within BI’s target range of 2%-4% for the year.


Inflation readings 

  • Consumer Price Inflation (CPI) in the US dipped to 3.2% YoY in October from September’s reading of 3.7% and came in below the consensus of 3.3%. The core CPI, which excludes the impact of food and energy prices, went up 4% YoY, which is below the consensus estimate of 4.1%. Food prices were up 3.3% YoY.
  • CPI in the Eurozone declined to 2.9% YoY in October from 4.3% in September. The reading came in below the consensus estimates of 3.1%. The core inflation slowed to 4.2% YoY in October from 4.5% in September. Energy prices fell 11.1% compared to 4.6% in September. Inflation readings were the lowest in Belgium (-1.7%) and the Netherlands (-1%) and the highest in Slovakia (7.8%) and Slovenia (6.6%).
  • CPI in the UK declined from 6.7% YoY in September to a 2-year low of 4.6% YoY in October due to the steep rise in energy costs in the comparable month a year ago. Core CPI, which strips out volatile food, energy, alcohol, and tobacco prices, declined from 6.1% in September to 5.7% in October.
  • CPI in Canada declined from 3.8% in September to 3.1% in October and was in line with the consensus estimate. The main reason for the decline is the fall in gasoline prices by 7.8% YoY in October. Excluding gasoline prices, inflation came in at 3.6% in the month.
  • CPI in China was -0.2% YoY in October versus flat YoY in September. Economists expected a deflation of 0.1% in the month. Producer prices declined as well by 2.6% YoY pointing to sluggish demand in the economy.
  • Germany’s producer price index declined 11% YoY in October after September’s fall of 14.7% YoY, continuing the fourth consecutive month of deflationary pressures, mainly driven by energy and metal prices. The fall is also attributed to inflated commodity prices due to the Russia-Ukraine conflict in October last year, since when they started declining, partly driven by energy price caps across Europe.


Other economic indicators

  • The US labour market showed signs of loosening as the job additions decelerated from 297,000 in September to 150,000 in October, missing the consensus estimate of a 170,000 rise. The slowdown is attributed to United Auto Workers strikes leading to a net loss of jobs in the manufacturing sector.

  • Manufacturing activity in the US showed contraction for the 12th consecutive month in October following a 28-month period of growth. The ISM Manufacturing purchasing managers’ index (PMI) dipped to 46.7 in the month from the 10-month high of 49 in September (both below the threshold of 50 for expansion). The new orders Index remained in contraction territory as it came 3.7 points lower than the reading in September.
  • China’s manufacturing activity surprisingly contracted in October after showing signs of nascent recovery lately. The manufacturing PMI dipped to 49.5 in October from 50.2 in September and missed the consensus estimate of 50.2. The Chinese policymakers announced a slew of measures (including interest rate cuts and fiscal stimulus) to support the economy. Given the recent data, analysts believe more support may be needed to reach the government’s annual growth target of ~5%.
  • The service sector activity in China remained stable as depicted by the Caixin General Service PMI which rose to 50.4 in October from a 9-month low of 50.2 in September. With this, services activity in the country grew for the 10th straight month. Foreign sales increased due to the removal of travel restrictions attracting more tourists while employment stabilized.
  • Germany, Europe’s largest economy, contracted as the GDP fell 0.3% YoY in the third quarter of 2023, after remaining unchanged in the prior quarter. High inflation continues to erode consumers’ purchasing power. Economists expect the contraction to continue.
  • Euro zone economy contracted 0.1% QoQ in the third quarter of 2023, which is worse than market forecasts of no change. France, Spain, and Belgium reported an expansion in GDP in the quarter (0.1%, 0.3%, 0.5%, respectively), which was more than offset by contraction in Germany, nil growth in Italy, and declines in Austria, Portugal, Ireland, Estonia, and Lithuania.
  • Saudi Arabia and Russia reaffirmed oil supply cuts of more than 1 million barrels a day through the end of 2023. This happens as the oil major nations want to ensure trading of global crude prices with an upside bias amid a weak demand outlook. Saudi Arabia has slashed daily output by 1 million barrels, while Russia has curbed exports by 300,000 barrels, on top of earlier cuts made with fellow OPEC+ nations.


Domestic Economic Updates

  • India’s unemployment rate rose to a more than 2-year high at 10.05% in October from 7.1% in September, survey data by private research firm CMIE revealed. The rise was mainly driven by joblessness in rural India. Unemployment in rural areas surged from 6.2% to 10.8% and in urban areas eased marginally to 8.4% in October.

  • The index of eight core industries rose by 8.1% YoY in September 2023 driven by growth in 7 out of 8 core sectors, viz., coal, steel, electricity, natural gas, refinery products, cement, and fertilisers. However, the growth reflected a declaration from 12.5% in August to a 4-month low in September. Crude oil sector output dipped marginally by 0.4% YoY in the month.
  • The growth in India’s industrial production slipped from a 14-month high of 10.3% YoY in August to a 3-month low of 5.8% YoY in September due to the base effect and a deceleration in the growth of manufacturing output (accounts for 77.6% of the weight of the Index of Industrial Production) to 4.5% YoY in September from 9.3% YoY in August, electricity output to 9.9% YoY from 15.3% YoY in August, and mining sector output to 11.5% YoY from 12.3% YoY in August.

  • India’s CPI softened further to a 4-month low of 4.87% YoY in October from 5.02% in the prior month due to moderation in food prices. With this, the retail inflation was recorded within the Reserve Bank of India’s tolerance band of 4-6% for the second consecutive month. Food inflation, which accounts for ~50% of the overall consumer price basket, rose 6.61% YoY in October versus 6.56% in September. Meanwhile, the country’s wholesale prices remained in the deflationary zone for the 7th consecutive month at -0.52% in October due to favourable base and easing of commodity prices. The items that witnessed a fall in prices include chemicals and chemical products, electricity, textiles, basic metals, food products, paper and paper products, etc.

  • The retail inflation for agricultural labourers (AL) and rural labourers (RL) came in at 7.08% YoY and 6.92% YoY in October, which is higher than 6.70% and 6.55%, respectively in September due to higher prices of certain food items like rice, wheat atta, pulses, vegetables, milk, onion, chillies (green), spices, etc. The food inflation for AL and RL was 8.42% and 8.18% in October versus 8.06% and 7.73%, respectively, in September.

  • India’s merchandise exports increased for the second time in FY24 and rose 6.2% to US$33.6 billion in October led by low base and higher non-oil exports while imports jumped 12.3% YoY to a record high of US$65.03 billion due to higher gold imports on the back of festive demand. With this, India’s merchandise trade deficit widened to an all-time high of US$31.46 billion, surpassing the previous record of US$29.23 billion in September 2022.
  • Total Foreign direct investment (FDI), which includes equity capital of unincorporated bodies, reinvest earnings and other capital, decreased 15.5% YoY to US$32.9 billion during the first half of FY24 (April-September 2023), as per the data released by the Department for Promotion of Industry and Internal Trade (DPIIT). FDI equity inflows declined 24% to US$20.5 billion in the period with the same decreasing from major countries like Singapore, Mauritius, the US, the UK, and the UAE and increasing from countries like the Netherlands, Japan, and Germany. Despite the decline, Singapore emerged as the top investor with US$5.22 billion of FDI during the first half of FY24. State-wise, Maharashtra attracted the highest inflow of US$7.95 billion during the period, compared with US$8 billion in the same period a year ago.


Disclaimer:

The details mentioned above are for information purposes only. The information provided is the basis of our understanding of the applicable laws and is not legal, tax, financial advice, or opinion and the same subject to change from time to time without intimation to the reader. The reader should independently seek advice from their lawyers/tax advisors in this regard. All liability with respect to actions taken or not taken based on the contents of this site are hereby expressly disclaimed.

DATE
November 1, 2023
PLACE
Mumbai
READING TIME
10 mins

The Month That Was – Macroeconomic takeaways from the month of October 2023

Global Economic Updates

 Central bank policy actions

  • The Bank of Canada kept the key rates unchanged – the overnight rate at 5%, the Bank Rate at 5.25%, and the deposit rate at 5%, while continuing with its policy of quantitative tightening. The bank noted the slowdown in the global economy and stated a moderation in growth further as past increases in rates and the recent surge in global bond yields weigh on demand. It has projected global GDP growth of 2.9% in 2023, 2.3% in 2024, and 2.6% in 2025. The European Central Bank also kept interest rates unchanged for the first time in more than a year between 4% to 4.75%. The ECB President indicated a “broad-based” decline in inflation to 4.3% in September due to drop in fuel costs and easing food prices. The Reserve Bank of New Zealand kept its cash rate steady at 5.5% on the expected line reiterating that previous tightening had helped constrain spending and hence the rates need to remain at a restrictive level to ensure that consumer inflation returns to the 1-3% target range. The Central Bank of Philippines raised interest rates by 25 basis points (bps) to 6.5% indicating further tightening as it warned inflation to stay above its target (2-4%) till the middle of 2024.

 Inflation readings 

  • Consumer Price Inflation (CPI) in the US came in at 3.7% YoY in September, which is slightly faster than the expected pace of 3.6%. Rent and homeowner monthly payments were the biggest contributors to inflation in the month. The core inflation, which excludes food and energy prices, was 4.1% YoY in September (in line with expectations) versus 4.3% YoY in August.
  • CPI in the Eurozone declined to its lowest point since October 2021 at 4.3% YoY in September compared with 5.2% YoY in August. Core inflation, which excludes the impact of volatile energy, food, alcohol, and tobacco prices, dipped from 5.3% YoY in August to 4.5% YoY in September. The contributors to lower inflation are services (4.7% in September vs 5.5% in August), non-energy industrial goods (4.1% vs 4.7%), and food, alcohol & tobacco (8.8% vs 9.7%). Energy costs declined further as well (-4.6% vs -3.3%).
  • CPI in Europe’s largest economy Germany eased to its lowest point since the Ukraine war to 4.3% YoY in September (versus expectations of 4.5% YoY) from 6.4% YoY in August. Thanks to easing food inflation to a larger extent. Core inflation was 4.6% YoY in September compared to 5.5% in August.
  • CPI in the UK remained steady at 6.7% YoY in September, which is an 18-month low reported in August, missing the market expectations of a mild softening to 6.6%. This happens as surging fuel costs amid a sharp rise in global oil costs offset the impact of monthly fall in food prices.

Other economic indicators

  • The US economy expanded at the fastest pace since the last quarter of 2021 by an annualized rate of 4.9% in the third quarter of 2023. The growth is above the market forecasts of 4.5% and a 2.1% rise in the previous quarter. Thanks to strong growth in private consumption, expansion in private inventories, and continued support by government spending, despite a fall in real disposable income.

  • The Gross Domestic Product (GDP) of the UK rose 0.2% QoQ in the second quarter of 2023, indicating a faster post-pandemic recovery, as per the revised data by the Office for National Statistics. This put Britain on a faster track of economic growth compared to Germany or France.
  • The growth in China’s economy decelerated to 4.9% YoY in July-September from 6.3% in Q2 2023. However, the reading came in above market forecasts of a 4.5% rise. The slowdown is attributed to weak global demand for its exports and the struggling real estate sector.
  • The International Monetary Fund (IMF) released its global growth forecast in World Economic Outlook last week. The UN agency raised the GDP forecast for the US due to stronger business investment, favourable consumption growth, and an expansionary government fiscal position. It has lowered the forecast for the Euro zone due to contraction in the German economy among other factors. The growth forecast for India upped to 6.3% for 2023 from 6.1% earlier, due to stronger-than-expected consumption during April-June. The agency reiterated the forecast of global growth for 2023 at 3% and lowered the same for 2024 by 0.1 percentage points (ppt). IMF noted resilience in the global economy despite geopolitical conflicts, energy crisis, and the tightening of monetary policy.

Domestic Economic Updates

  • India’s manufacturing sector activity moderated as the seasonally adjusted S&P Global India Manufacturing Purchasing Managers’ Index (PMI) declined to a 5-month low of 57.5 in September from 58.6 in August due to the sluggish pace of new orders tempering the production growth. Nevertheless, the index remained in the expansionary zone (above the 50 threshold) driven by strong demand.
  • India’s headline retail inflation came back to the central bank’s tolerance range (2-6%) at 5.02% YoY in September compared with 6.83% YoY in August. Thanks to the huge slide in vegetable prices. The reading, a 3-month low, is also lower than the consensus estimates of 5.4% YoY for the month. Meanwhile, the wholesale price inflation remained in the negative territory for the sixth straight month, but the deflation decelerated to -0.26% YoY in September compared to -0.52% in August, which was a 5-month high. As per the Commerce Ministry, “Deflation in September 2023 is primarily due to fall in prices of chemical & chemical products, mineral oils, textiles, basic metals, and food products as compared to the corresponding month of previous year”.

  • Retail inflation for agricultural labourers (AL) and rural labourers (RL) fell from 7.37% and 7.12%, respectively, in August 2023 to 6.70% and 6.55%, respectively, in September 2023. The food inflation fell from 8.89% and 8.64% respectively, in August 2023 to 8.06% and 7.73% respectively, in September 2023.

  • The growth in India’s Index of Industrial Production accelerated to a multi-month high of 10.3% YoY in August from 5.7% in July driven by solid growth in the mining (12.3%), manufacturing (9.3%), and electricity (15.3%) sectors. Resilient domestic and export demand aids the growth in all sectors.

  • The Reserve Bank of India kept the repo rate unchanged at 6.5% in its fourth bi-monthly monetary policy meeting in a unanimous vote by all six members. The central bank remains focused on the withdrawal of accommodation to support growth. It retained real GDP growth forecast at 6.5% and inflation forecast at 5.4% for FY24.

  • India’s unemployment rate declined to a 12-month low of 7.1% in September as per data released by the Centre for Monitoring Indian Economy (CMIE). It reinforces the view that economic activities have picked up ahead of the festive season. The unemployment rate softened in both urban (from 10.09% in August to 8.94% in September) and rural areas (to a 12-month low of 6.2% in September).

  • The domestic air traffic grew 18.3% YoY to 12.25 million passengers in September and over 6% compared to the pre-pandemic era. In terms of passenger load factor (PLF), all airlines witnessed a higher capacity utilisation sequentially in September led by Vistara at 92%. IndiGo continued to be the largest domestic airline with a market share of 63.4% followed by Vistara at 10%, Air India at 9.8%, AirAsia India at 6.7%, SpiceJet at 4.4%, and Akasa at 4.2%.
  • India’s trade deficit fell to a 5-month low of US$19.4 billion in September, reflecting a YoY fall of more than 30%. This happened as imports fell 15% YoY to US$53.8 billion while exports fell only 2.6% YoY to US$34.5 billion in the month. Economists expected a trade deficit of US$23.25 billion for the month.
  • Domestic sales of passenger vehicles rose to 10.7 lakh units in July-September, which is the highest level recorded in any quarter, as per the Society of Indian Automobile Manufacturers (SIAM). It went up 3.6% from the corresponding quarter a year ago. Three-wheelers clocked the highest-ever sales at 1.95 lakh units during the quarter. The rise is attributable to pre-festive season sales. On a monthly basis, sales rose 1.8% YoY to 3.6 lakh units in September.
  • India, which is currently the world’s 5th largest economy, may overtake Japan to be the world’s 3rd largest by 2030, stated S&P Global Market Intelligence. This is estimated after noticing the fast pace of economic growth in 2021 and 2022 and sustained strong growth in 2023 so far. Currently, the US is the largest economy with a GDP of US$25.5 trillion followed by China with US$18 trillion, Japan with US$4.2 trillion, and Germany with US$4 trillion. India is expected to record a nominal GDP of US$7.3 trillion by 2030.


Disclaimer:

The details mentioned above are for information purposes only. The information provided is the basis of our understanding of the applicable laws and is not legal, tax, financial advice, or opinion and the same subject to change from time to time without intimation to the reader. The reader should independently seek advice from their lawyers/tax advisors in this regard. All liability with respect to actions taken or not taken based on the contents of this site are hereby expressly disclaimed.