DATE
February 21, 2025
PLACE
Mumbai
READING TIME
10 mins

Private Credit AIFs: Lender of choice for mid-market enterprises

Debt plays a major role in the economic growth of a country as it offers a non-dilutive, lower cost alternative to companies looking to raise capital. The primary sources of debt are banks, NBFCs, and the public corporate bond market. Despite being the fastest-growing economy in the world, India still faces significant gaps in enterprise credit which cannot be serviced by traditional sources of capital. This is indicated by the fact that India’s domestic credit to the private sector has hovered around 50% of GDP compared to a consistently higher and steadily increasing world average of ~95%. This indicates a significant room for growth in debt in relation to the size of the Indian economy.
The mid-market enterprises (MMEs) in India are the pillars of growth. There are 15,000+ companies in the ecosystem contributing over 40% to India’s GDP, employing ~40% of the country’s workforce, and generating nearly 50% of its exports. However, majority of these companies have little or no access to the debt market.

Roadblocks to Growth

Traditional lenders such as banks and larger NBFCs are inflexible in enterprise lending and tend to serve the most vanilla needs through policy-based lending. On the other hand, mutual funds and insurance companies are restricted by their respective regulations and face lack of access to this space and limited ability to assess credit worthiness.

Most of these entities rarely have the expertise to navigate public capital markets, further exacerbated by the perils of asymmetrical information and smaller ticket sizes which may not garner investor interest.

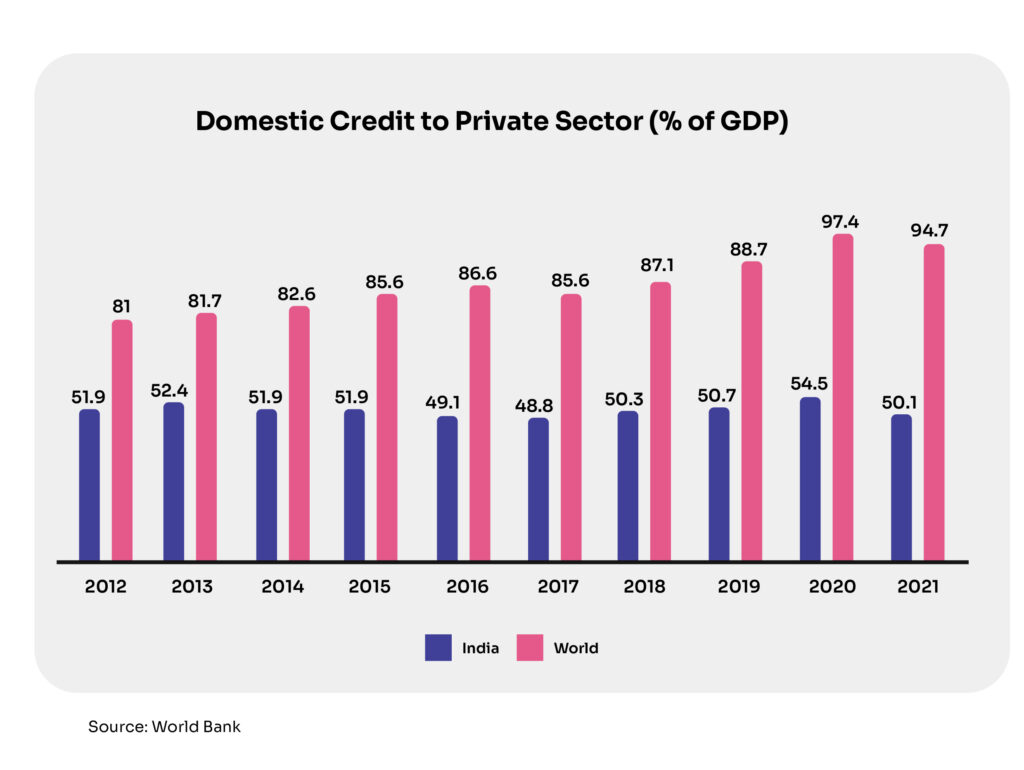
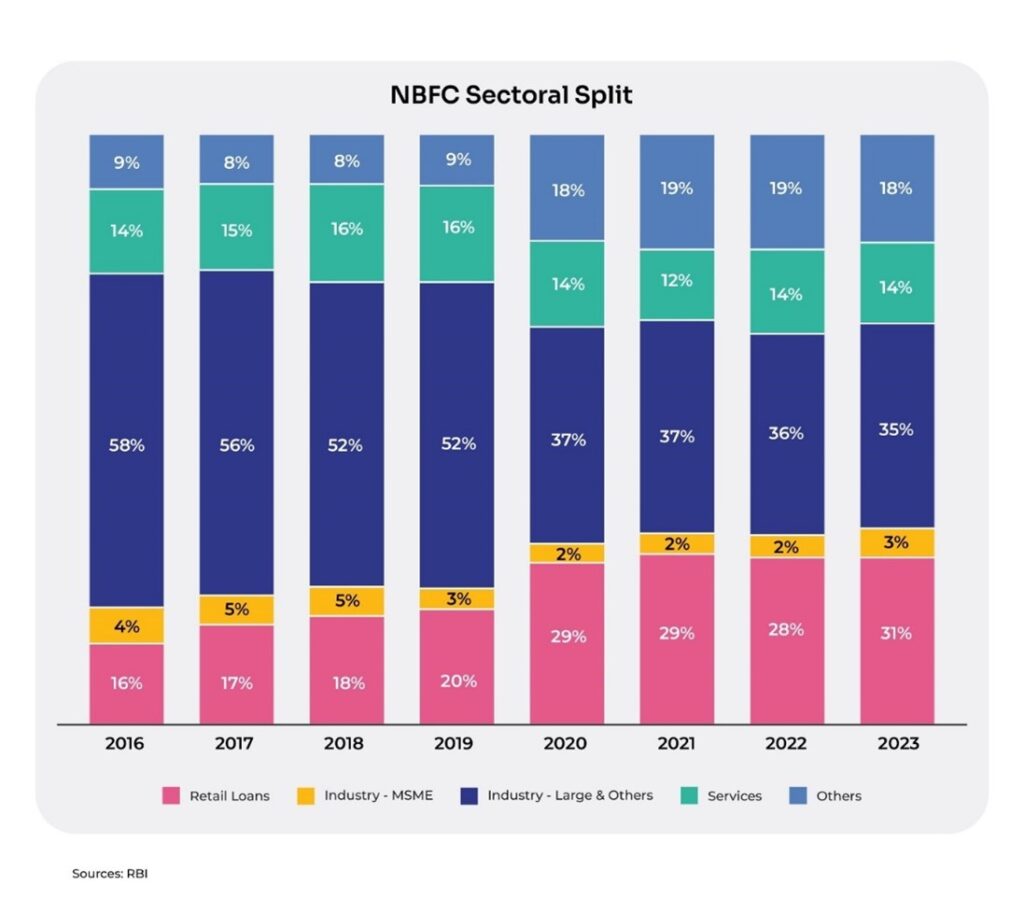
Banks and NBFCs have largely pivoted towards retail lending with loans to industry growing at a slower pace than average disbursements. In the past 12 years, retail loans by banks clocked a CAGR of 16% while banking credit as a whole rose ~10%. In the same period, bank lending to large businesses and MSMEs has relatively stagnated with a CAGR of 3% for each, respectively.

NBFCs depicted a similar trend in the last 8 years with retail lending recording a CAGR of 23% while their gross advances increased by 11%. In contrast, NBFC lending to large and other businesses clocked a CAGR of 6% and 8% for MSME in the same period.
Over the last 10 years, debt mutual funds in general have seen a stagnation in AUM. As a percent of the total AUM, debt mutual fund AUM slipped from ~75% in FY14 to ~25% in FY24. On the other hand, Credit risk mutual funds have witnessed significant outflows with their volume degrowing by 2.5x in FY24 compared with FY20.
The domestic bond market has not been able to alleviate the situation. The overall market is dominated by government securities (G-Secs) and State Development Loans (SDL bonds), which accounted for 70% of the total outstanding in the bond market, while corporate bonds accounted for 22% of the same as of March 2024. In terms of share in GDP, the corporate bond market accounts for ~16% (2021), which remains sub-optimal compared to its Asian peers like South Korea (87%), Malaysia (57%), and China (36%).

In such a scenario, what can plug the significant gap in enterprise credit, mainly the mid-market enterprises that hold the potential for the next leg of growth in India?

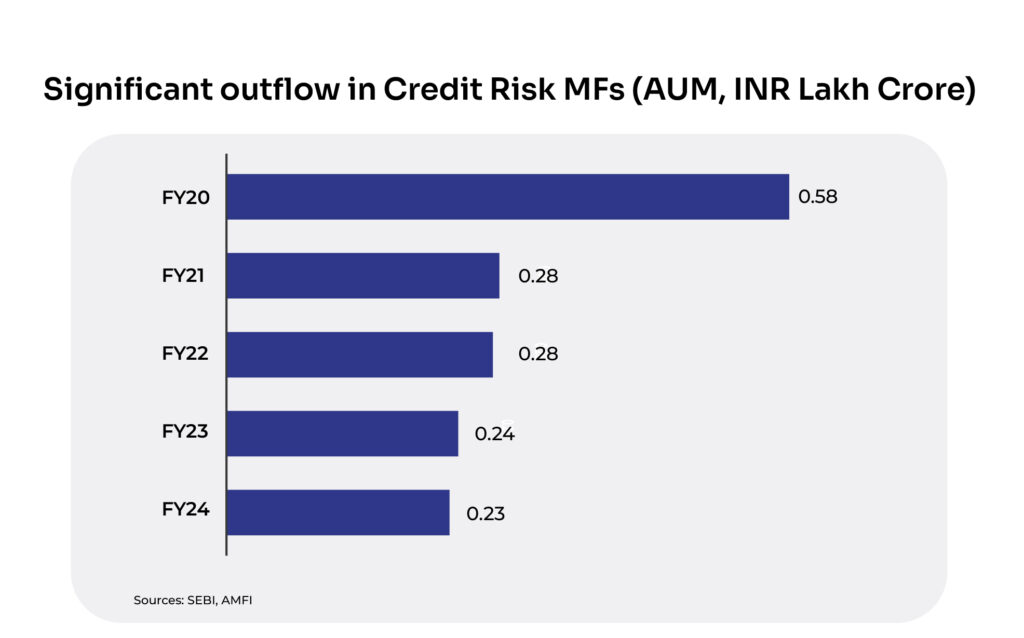
The Emergence of Private Credit

Private credit provides an alternative source of financing for businesses with unique funding needs and irregular cash flows, cases which banks may avoid due to inflexible policies and regulatory restrictions. Private credit lending takes place mostly via funds/investment vehicles handled by specialized asset managers. In such funds, money is raised from sophisticated investors which are then deployed to entities as per covenants that suit the risk-return spectrum of the vehicle. The tasks related to origination, due diligence, monitoring and recovery (if required) are handled by the fund. With this, investors get access to a professionally managed portfolio consisting of 10-20 entities.

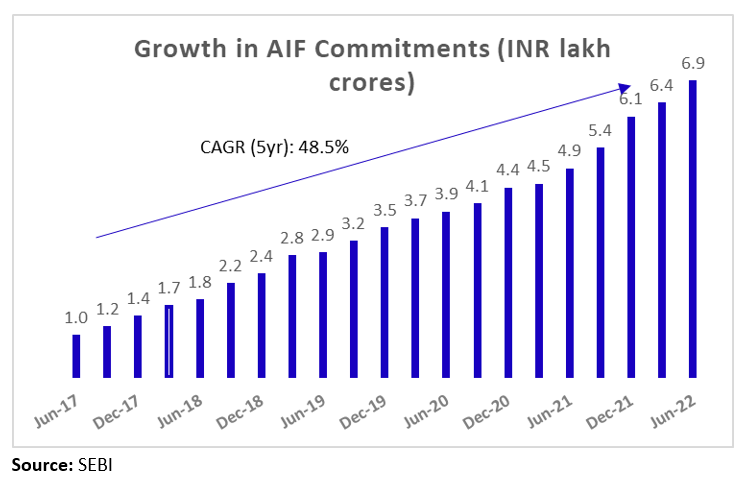
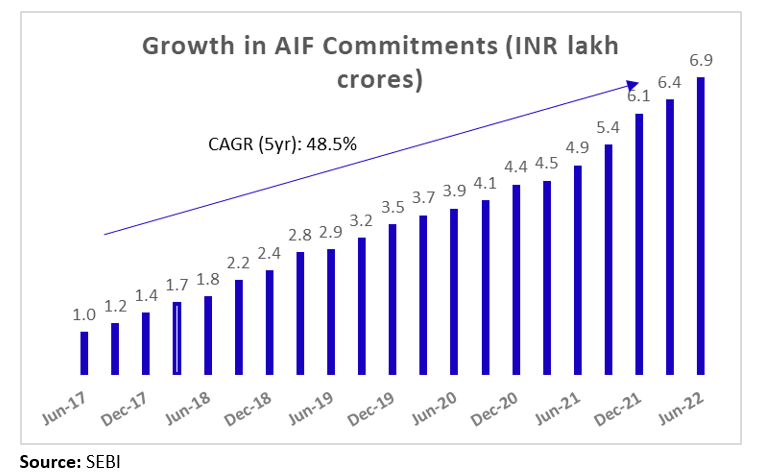
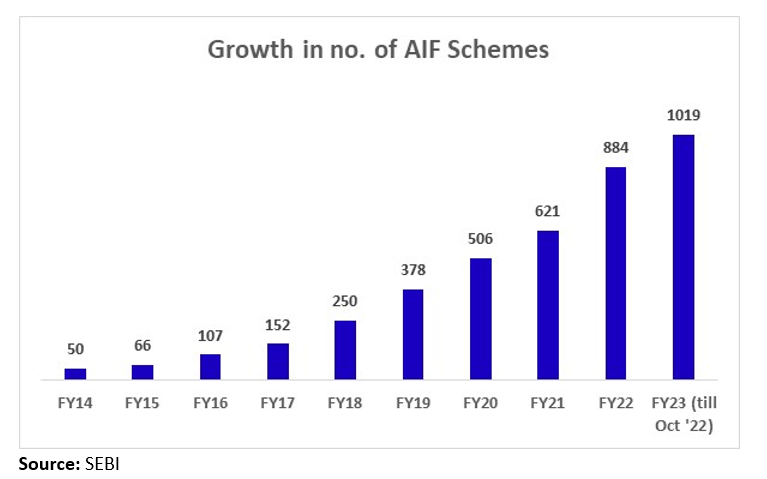
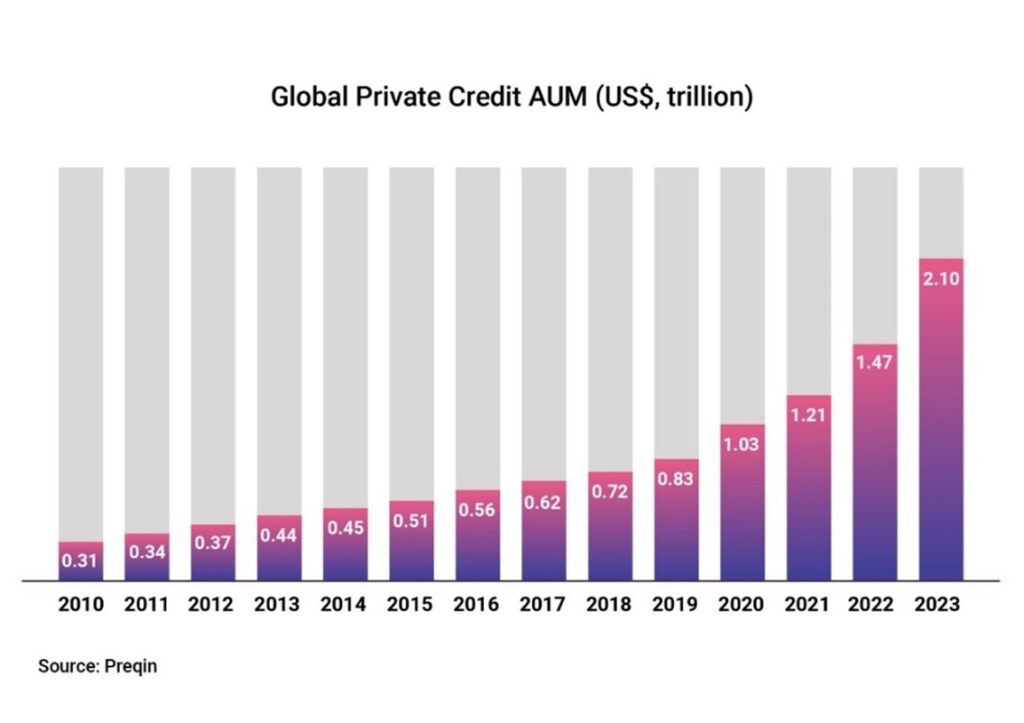
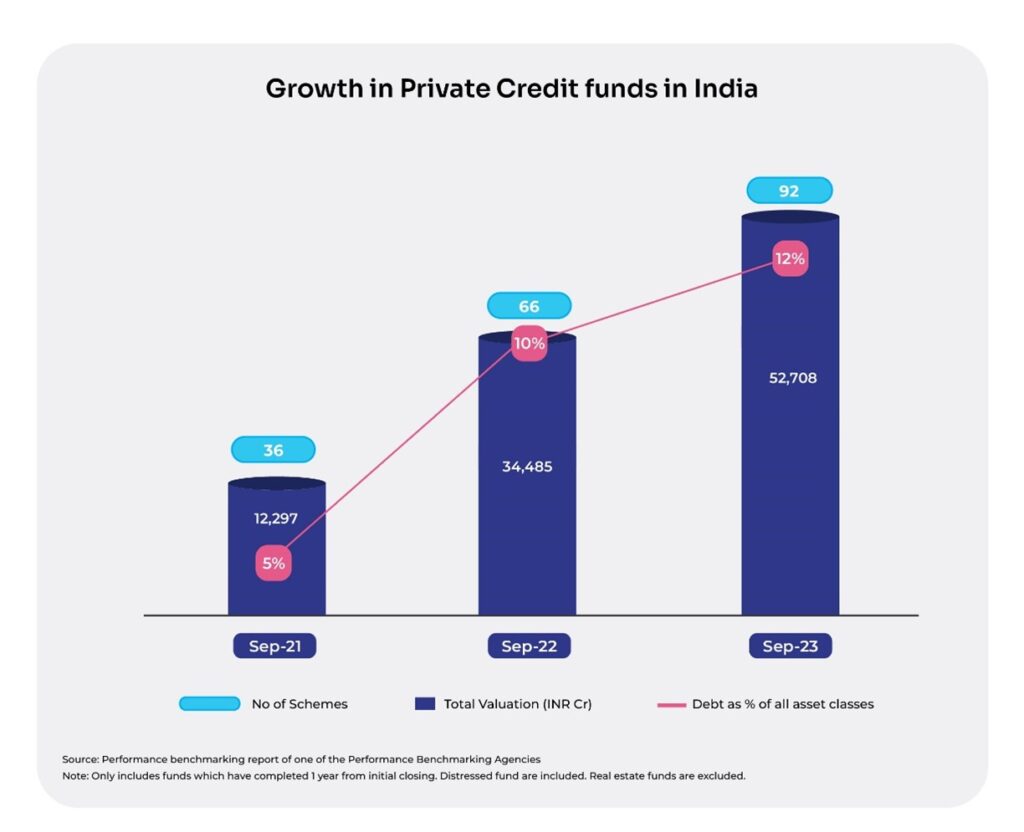
The Private Credit market has been growing at a fast pace across the world, and India is no exception. It witnessed a 5x growth in assets under management (AUM) over the last 10 years to over US$2 trillion in 2023.

Globally, the market started gaining pace as banks retreated from lending to small and mid-sized businesses and to companies backed by Private Equity. On the other hand, mid-market corporates are turning towards Private Credit funds seeking tailored financial solutions that such vehicles can provide with flexible structures.
Although India’s corporate bond market has been dominated by issuances in the higher credit rating categories, lower rated entities have been tapping the bond market increasingly. It is attributed to factors such as faster TAT compared to banks, flexible end-uses and security structures, emergence of online platforms, and the emergence of specialized private credit managers in the Performing Credit space, which cater to mid-sized, EBITDA positive, and cash flow generating companies with end uses of growth capital, capex, mezzanine financing, and acquisition (ticket size of loans INR 50-300 crore).

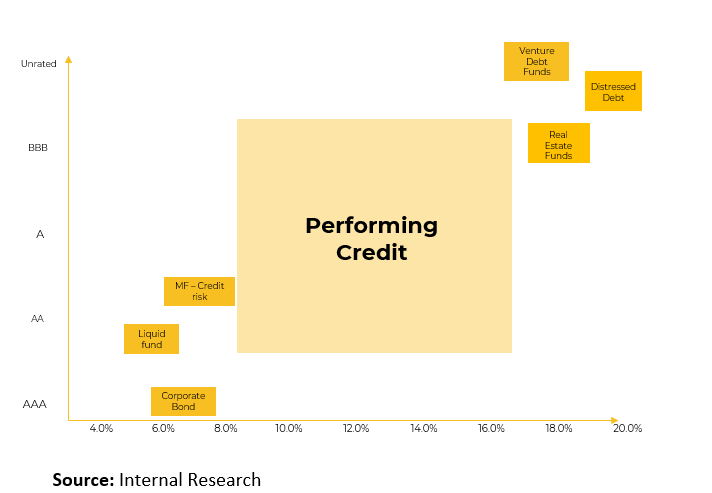
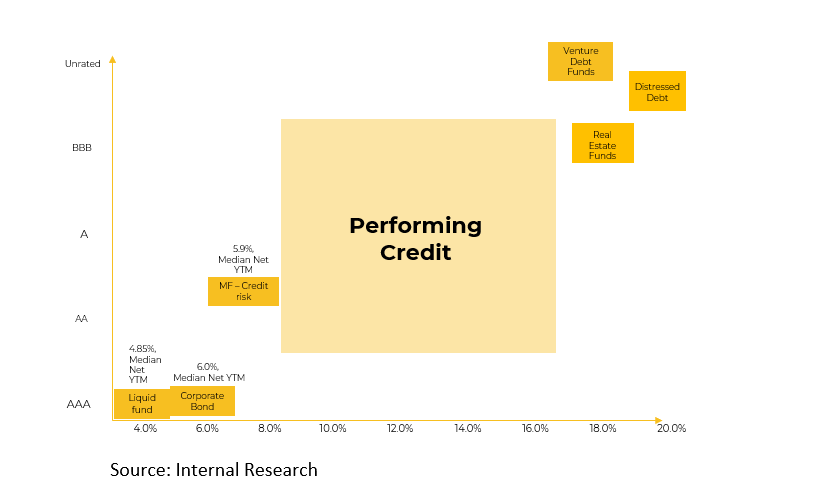
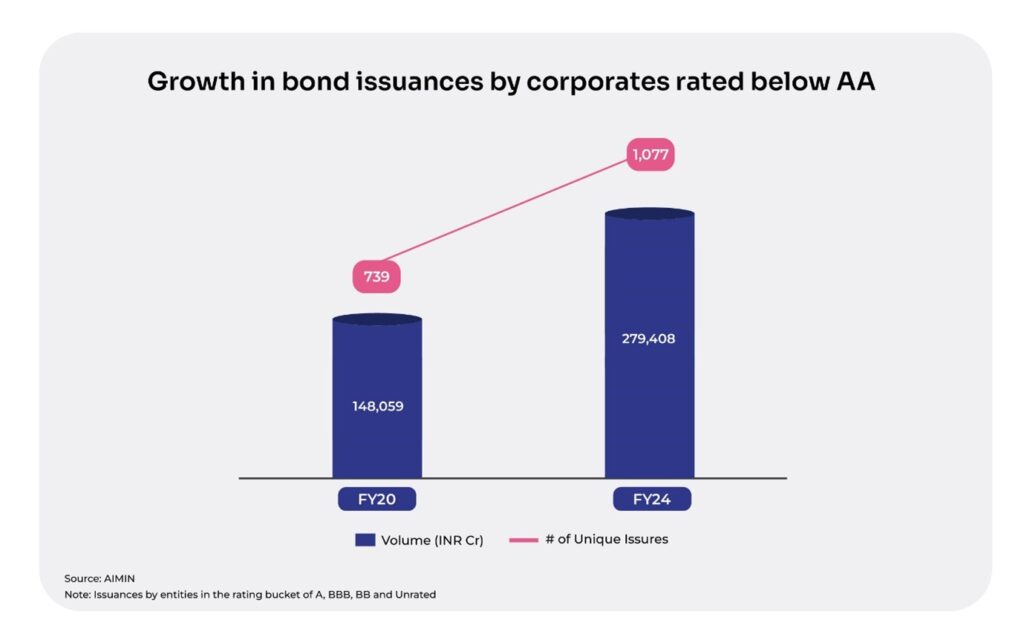
The entities in the Performing Credit space, to which banks generally offer Term Loans, are able to issue debentures into which funds invest. Often, and especially for corporates, an issuance for a fund may be the entity’s maiden capital market issuance and rating exercise. The fund may also be able to provide guidance in navigating the nuances of capital market issuance.

Lower rated entities (below AA) are deemed to be riskier compared to the above AA rated category due to their higher default rates. However, recent studies have shown default rates of entities in the space have been declining steadily due to factors such as

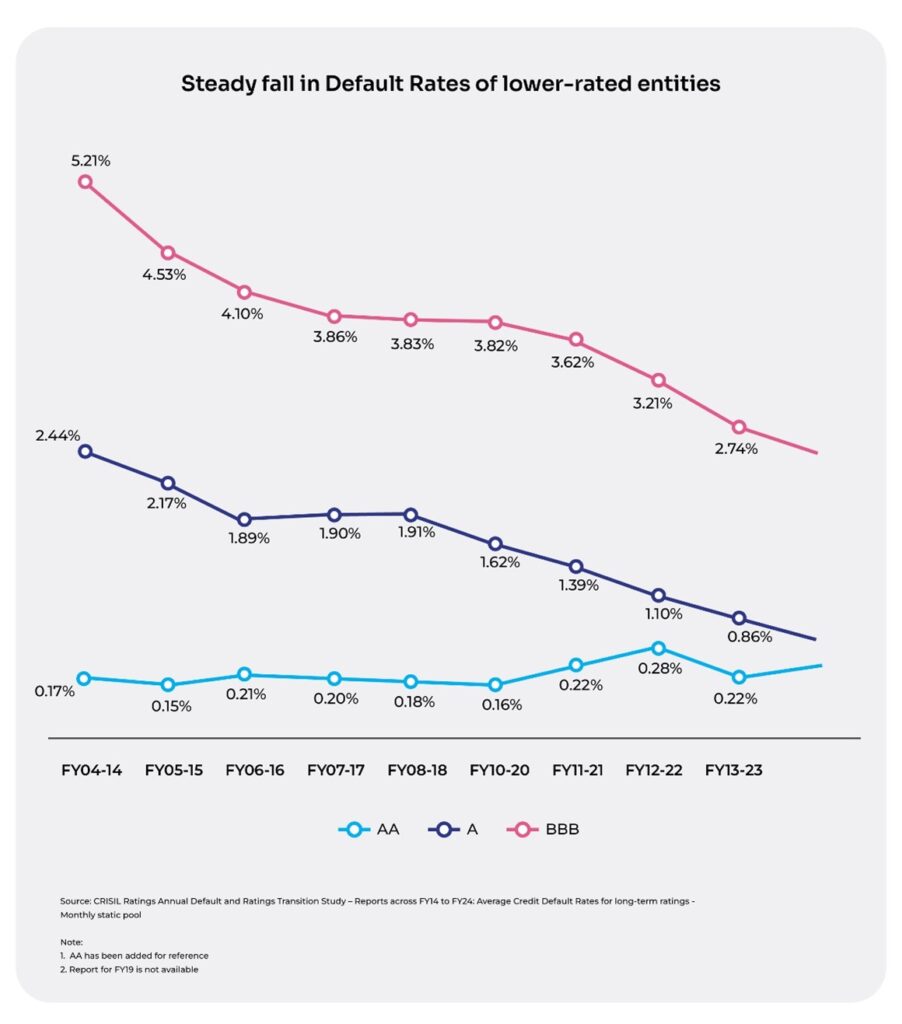
  1. Enactment of the Insolvency and Bankruptcy Code that has imparted credit discipline among such corporates.
  2. Improved scale and profitability of the entities due to the growth and digital advancement of the Indian economy.
  3. Industry-wide consolidation.
  4. Lower volatility in operating parameters.

What’s in it for investors?

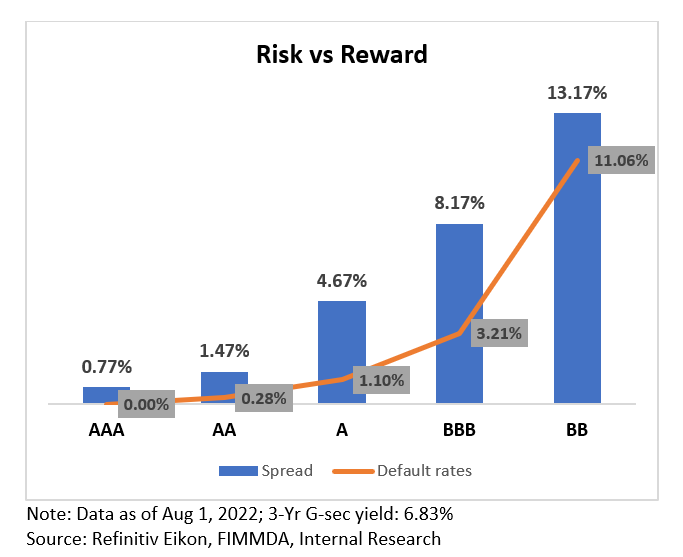
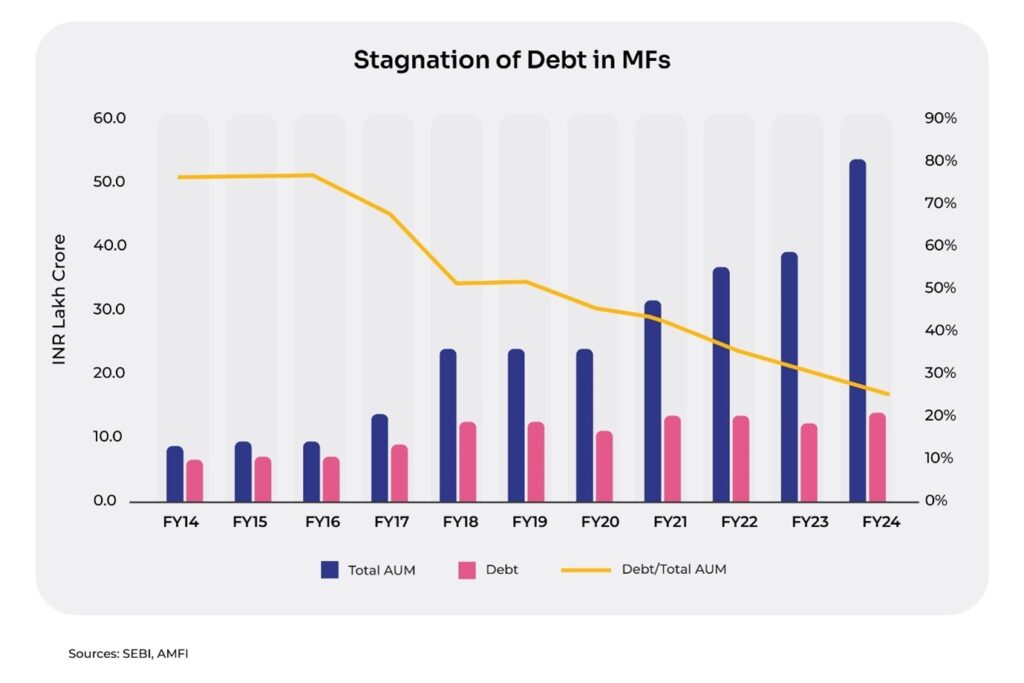
In the public debt market, it has become difficult for investors to generate real returns. However, it makes sense to cautiously move into the private credit market given the immense potential in the space to earn superior returns. Recent regulatory steps like the enactment of the Insolvency and Bankruptcy Code and the introduction of the Account Aggregator framework brought confidence in the market and enabled transparency and scope for efficient decision-making about borrowing entities.

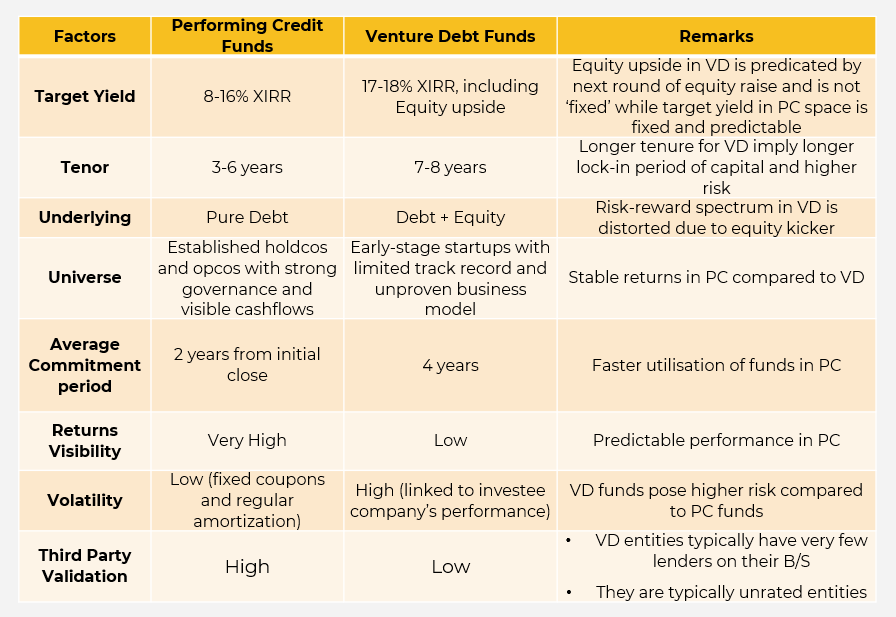
Further, choosing a highly professional fund manager is extremely useful while investing in the space as such risks can be mitigated ensuring stability and predictability of returns. Below are the factors investors should consider before investing in Private Credit funds:

Disclaimer: The information provided in this article is for general informational purposes only and is not an investment, financial, legal or tax advice. While every effort has been made to ensure the accuracy and reliability of the content, the author or publisher does not guarantee the completeness, accuracy, or timeliness of the information. Readers are advised to verify any information before making decisions based on it. The opinions expressed are solely those of the author and do not necessarily reflect the views or opinions of any organization or entity mentioned

DATE
September 19, 2024
PLACE
Mumbai
READING TIME
10 mins

US Federal Reserve announced its first rate cut since 2020 – A deeper look

The US Federal Reserve, in a historic move, cut its benchmark interest rate by 50 basis points (bps) for the first time since 2020. The federal funds rate now stands at 4.75%-5%, down from the 22-year high target range of 5.25%-5.5%. The rate cut followed a spate of 11 rate hikes since March 2022 (including four in 2023) to combat inflation.

The Federal Open Market Committee (FOMC) voted 11-to-1 in favour of the rate cut that occurred shortly before November’s presidential election. “We concluded that this was the right thing for the economy and the people we serve.” said the Federal Reserve Chair Jerome H. Powell.

The policymakers indicated more rate cuts are likely by the end of this year. As per the median of new economic projections published at the end of the policy meeting, interest rates could be lowered to a range of 4.25%-4.5% by 2024-end as inflation nears the 2% goal and unemployment spikes. This implies that an additional 50 bps cut might take place this year. Powell indicated they could speed up if the economy is weak and slow down if it’s strong.

The US market doesn’t seem to be spooked by the significant cut as modest movements were noticed in S&P 500 and tech-heavy Nasdaq. This is because investors have priced in the historic move with reassurance from the Fed that it wasn’t an emergency cut.

Inflation

The US Fed pulled off the daunting task of battling the pandemic-led inflation pretty well. In August, consumer price inflation reached its 3-year low at 2.5% (a tad higher than the pre-pandemic level), marking the 5th straight annual fall and the smallest hike since February 2021.

There are several triggers for the softer inflation. Gasoline prices in the US averaged $3.20/gallon, down $0.50 since April. Analysts believe the national average could further go below $3 in the near term. On the other hand, major retail chains like Walmart and Target announced price cuts on thousands of items to an extent that has put the business of discount stores in the US under pressure.

Along the cut comes big relief to credit card holders and home buyers in the US. Credit card debt has risen to the highest level since the 2008 financial crisis (so the credit card delinquencies) to US$1.14 trillion in the second quarter of 2024, according to data available from the Federal Reserve Bank of New York. Notably, it is the highest balance since the New York Fed began tracking the data in 1999 and up from US$1.12 trillion in the first quarter of 2024. Credit card rates averaged over 20% with store-branded cards witnessing a record-high average annual rate of 30.45%, as per data released by Bankrate.

The national average of mortgage rates stands at ~6.3% for a 30-year fixed loan. Mortgage rates, which are closely tied to 10-year Treasury bond yields that are coming down with inflation, will also ease with the benchmark rates going down.

Soft landing

Soft landing in an economy refers to a scenario when inflation is tamed without setting off a significant decline in economic activity. However, rising unemployment in the US remains a bigger concern and puts the soft landing in jeopardy. The unemployment rate has risen over the last one year and steeply since the beginning of 2024. Economists believe that whenever unemployment begins to rise, it tends to gain momentum and keep rising.

Impact on Indian market

Foreign investment: Foreign investment in India is likely to increase following the rate cut. When interest rates in the US rise, investors tend to flock to the US market to earn higher returns from Treasury bonds. A cut in the interest rate lowers the yields on US securities prompting investors to seek higher returns elsewhere with a healthy economic outlook. As a result, investment in Indian equity and debt markets could rise, pushing up the prices of securities.

Currency: As mentioned above, lower interest rates could lead to foreign investors chasing the Indian equity and debt markets. This would lead to higher demand for INR for investment purposes, potentially leading to an appreciation of the domestic currency. However, a stronger rupee has mixed impacts – it can lower the import cost and make business tough for Indian exporters on the other hand by making the Indian goods and services expensive for foreign buyers.

Bond Market: A cut in the US interest rates typically leads to a rally in the domestic bond market for reasons mentioned in the first point. In India, the bond market already priced in the rate cut with 10-year G-sec yields already dropping below 6.8%. Post the rate cut announcement, 10-year G-sec yields, in fact, opened above 6.8% on September 19 and became 6.867 at the time of writing after touching the day’s high of 6.893.

Conclusion

The US Federal Reserve joined other central banks across the world like the European Central Bank (ECB), Bank of Canada, and Bank of England in trimming benchmark interest rates. Other major central banks around the world are also expected to follow suit as the US Fed cut is one of the significant global monetary actions.

However, the Reserve Bank of India (RBI) is not compelled to follow suit as already indicated by the governor Shaktikanta Das. The inflation trajectory in India remains within RBI’s target of 4% (with a leeway of 2 percentage points on either side). India still remains the world’s fastest major economy. In the last policy meeting, RBI kept the GDP growth projection unchanged for FY25 (at 7.2%) as well as for Q2FY25, Q3FY25, and Q4FY25.

Further, RBI stressed that maintaining financial stability remains a top priority for the central bank. Hence, any decision to cut rates will be preceded by a full assessment of domestic economic conditions and potential risks.


Disclaimer:

The views provided in this blog are of the author and do not necessarily reflect the views of Vivriti. This article is intended for general information only and does not constitute any legal or other advice or suggestion. This article does not constitute an offer or an invitation to make an offer for any investment.  

DATE
August 6, 2024
PLACE
Mumbai
READING TIME
10 mins

The Pulse – A monthly digest of key macroeconomic events (July 2024)

“It is a curious fact that although all booms are alike, all are different.” — Edwin Lefevre

Domestic Updates

India’s retail inflation moves further away from RBI’s median target

  • The retail inflation in India accelerated for the first time in 5 months to 5.08% YoY in June from the 12-month low of 4.75% in May due to a rise in food prices, which account for nearly 50% of the CPI basket. Food inflation rose to 9.55% in June from 8.69% in May and 4.55% in June 2023. However, the headline inflation remained within the RBI’s tolerance band of 2 to 6% but moved further away from the median target of 4% which is critical for a rate cut decision this year. Rural inflation rose to 5.67% 5.34% in May while urban inflation softened to 4.39% from 4.21% in May.

Wholesale inflation continues to accelerate

  • The wholesale inflation jumped to a 16-month high of 3.36% YoY in June from 2.61% in May led by a rise in prices of food articles, manufacture of food products, crude petroleum & natural gas, mineral oils, and other manufacturing. Inflation in food articles rose to 8.68% from 7.4% in May while inflation in manufactured products increased to 1.43% from 0.78% in May.

India’s industrial output growth jumps to 7-month high 

  • The growth in India’s industrial output, as measured by the Index of Industrial Production (IIP), increased to a 7-month high of 5.9% in May from 5% in April. Compared to April, growth in mining decelerated to 6.6% from 6.8%, manufacturing accelerated to 4.6% from 3.9%, and electricity accelerated to 13.7% from 10.2%.

Union Budget: A fine balance between growth, employment, capital investment, & fiscal consolidation

  • The Centre retained the capital expenditures target at INR 11.11 lakh crore for FY25, which is the same as the Interim Budget presented in February this year. This reflected a 2x rise in spending on infrastructure over the past three years to generate demand and create more jobs across the economy. As a percentage of GDP, long-term capex rose from 1.7% in FY20 to 3.4% in FY25. The fiscal deficit target has been cut to 4.9% of GDP in FY25 from 5.1% of GDP in the Interim Budget. Consequently, the estimate for gross borrowing has been reduced to INR 14.01 lakh crore from INR 14.13 lakh crore in the Interim Budget while the net borrowing estimate stands at INR 11.63 lakh crore for the year. The Centre kept the target for nominal GDP (measured at current prices) growth unchanged at 10.5% in the Union Budget compared with the Interim Budget. On the other hand, the real GDP growth target has been pegged at 6.5-7% for FY25, as per the Economic Survey 2023-24, presented before the Union Budget.

India’s poverty ratio declines significantly

  • The National Council of Applied Economic Research (NCAER), one of the nation’s oldest economic policy research think tank, indicated in a research paper that the poverty ratio in India declined significantly to 8.5% in 2022-24 from 21.2% in 2011-12. The paper revealed that the poverty ratio in rural areas fell more compared to the same in urban areas. In rural areas it fell from 24.8% in 2011-12 to 8.6% now and in urban areas it decreased from 13.4% to 8.4% in the same period.

India’s trade deficit swells as imports are up more 

  • India’s trade deficit widened to US$20.98 billion in June from US$19.19 billion in the same month last year, as per the Commerce Ministry. This happened as imports increased 5% YoY to US$56.18 billion due to the rise in inbound shipments of crude oil, pulses, and electronic goods. Merchandise exports rose by 2.6% y-o-y to US$35.2 billion. The Commerce Ministry is focusing on 6 major sectors (engineering, textiles and apparel, electronics, pharmaceutical, chemicals and plastics, and agriculture) and 20 countries to boost exports.

Growth in passenger vehicle sales accelerate

  • Passenger vehicle sales stood at 294,133 in June 2024, reflecting a 5% growth that is higher than 4.3% a month ago. As per the Society of Indian Automobile Manufacturers (SIAM), the sector is expected to perform well in the near term due to favourable monsoon and the festive season.

How India’s FY25 Growth Projections looks 

  • The International Monetary Fund (IMF) revised India’s GDP growth forecast for FY25 upwards by 20 basis points to 7% due to a perceived rise in private consumption, mainly in rural areas. However, the UN-based agency expects the growth to decelerate to 6.5% in FY26.

Global Updates

Roundups

 Monetary policies 

  • The Bank of Canada cut its target for the overnight rate by 25 basis points (bps) to 4.5% and kept the Bank Rate at 4.75% and the deposit rate at 4.5%. The central bank expects inflation to ease gradually despite being still above the central bank targets in advanced economies. In Canada, the bank noticed an increase in excess supply in the economy due to population growth and faster growth in output. However, household spending has been weaker. Also, the labour market is slackening as unemployment rose to 6.4%. The central bank projected a GDP growth of 1.2% in 2024, 2.1% in 2025, and 2.4% in 2026. Consumer price inflation softened to 2.7% in June and the bank noticed broad inflationary pressures to be easing.
  • The People’s Bank of China unexpectedly cut its one-year policy loan rate, known as the medium-term lending facility (MLF), by 20 bps to 2.3%. The magnitude of the cut is the highest since the initiation of the first wave of COVID-19 (April 2020) which is no doubt to support the sluggish economy of China. It followed the reduction of the 7-day reserve repo rate by 10 bps.

GDP growth

  • The UK economy grew 0.4% on a MoM basis in May beating forecasts of a 0.2% rise and after stalling in April. The service sector increased 0.3% and was the biggest contributor to growth. Industrial output rose 0.2%, rebounding from a 0.9% drop in April. Housing construction grew at the fastest pace in nearly a year.
  • China’s GDP grew 4.7% YoY in the second quarter of CY2024, missing expectations of a 5.1% growth. It indicated a slowdown as the GDP grew 5.3% YoY in the first quarter of the year. The sluggish growth is attributed to a persistent property downturn, weak domestic demand, falling yuan, and trade frictions with the West.
  • The US economy showed improvements as the GDP expanded at an annualized rate of 2.8% in April-June 2024 versus 1.4% in the previous quarter. It came in above the consensus estimates of a growth of 2%. The growth is led by personal spending, except for housing due to high interest rates. Personal consumption expenditure, which accounts for ~70% of GDP, grew 2.3%, up 0.8 percentage points from the prior quarter.

Unemployment data 

  • The unemployment rate in the US increased to the highest level since November 2021 at 4.1% in June compared with 4% in May. Nonfarm payrolls rose by 206,000 in June compared to 218,000 in May (revised lower). Taking the moderation in inflation into account, the data could push the US Fed to consider rate cuts later this year.

  • The unemployment rate in the UK remained unchanged at 4.4% in May compared to the previous month and met market estimates. It is the highest reading since September 2021 as the number of unemployed individuals rose by 88,000 to 1.53 million, driven by those unemployed for up to 6 months.

Inflation readings

  • US: Consumer price inflation softened for the 3rd straight month to 3% YoY in June, marking the lowest reading since June 2023. It came in below the market estimates of 3.1%. The downward trajectory in inflation is attributed to a slowdown in housing prices. Other factors contributing to inflation include groceries, used cars, and gas which have either remained steady or declined. Shelter prices rose 0.2%, which is the smallest rise since August 2021.

Eurozone: Consumer price inflation eased to 2.5% YoY in June compared to 2.6% in May. The core inflation, which excludes volatile food and energy prices, was stable at 2.9% in June. Energy prices cooled off from a rise of 0.3% in May to 0.2% in June. Food inflation dipped to a 3-year low of 1.6% in June versus 1.9% in the prior month. Countries with lowest inflation include Finland (0.5%), Italy (0.9%), and Lithuania (1.0%) and the ones with the highest inflation are Belgium (5.4%), Romania (5.3%), Spain and Hungary (both 3.6%).

China: Annual inflation rate went down to 0.2% in June from 0.3% in the prior two months. It came in below consensus estimates of 0.4%. Factors that contributed to weaker inflation include food prices (-2.1% YoY), which recorded a steeper than expected fall, and non-food prices (0.8% YoY) like vehicles, household appliances, etc.

UK: Annual inflation remained steady at the central bank target of 2% in June, holding at 2021-lows, but came in above the consensus of 1.9%. A decline in clothing and footwear prices along with a sharp drop in food and drink inflation maintained the inflation at a lower level.

Japan: The annual inflation remained steady at 2.8% for the second straight month in June 2024. However, it remained at its highest level since February. The elevated level of inflation is attributed to electricity (13.4% vs 14.7% in May), gas (2.4% vs -2.5%), food (3.6% vs 4.1%), housing (0.6% vs 0.6%), transport (2.5% vs 2.3%), furniture & household utensils (3.7% vs 2.9%), clothes (2.2% vs 2.2%), healthcare (1.4% vs 1.1%), culture (5.6% vs 5.2%), communication (1.3% vs 0.4%), and miscellaneous (1.1% vs 1.2%).

Disclaimer:

The details mentioned above are for information purposes only. The information provided is the basis of our understanding of the applicable laws and is not legal, tax, financial advice, or opinion and the same subject to change from time to time without intimation to the reader. The reader should independently seek advice from their lawyers/tax advisors in this regard. All liability with respect to actions taken or not taken based on the contents of this site are hereby expressly disclaimed.

DATE
July 24, 2024
PLACE
Mumbai
READING TIME
10 mins

Union Budget FY2024-25: A roundup of key economic indicators

In the Union Budget FY2024-25, the Centre attempts to strike a balance between job growth, rural development, and fiscal prudence. While fiscal discipline is crucial for better sovereign ratings in hopes of a stronger tax collection, a continued capex push is essential to create jobs and to support the economy to become the world’s third largest by 2030. Let us have a look at the Budget announcements to examine the contours of key economic indicators.

GDP growth

The Centre kept the target for nominal GDP (measured at current prices) growth unchanged at 10.5% in the Union Budget compared with the Interim Budget. In absolute terms, the nominal GDP target is pegged at INR 326.4 lakh crore in FY25, a decline from INR 327.7 lakh crore set in the Interim Budget but up from INR 295.4 lakh crore in FY24.

Real GDP growth, which measures annual GDP growth at constant prices (Base year: 2011-12), has been pegged at 6.5-7% for FY25, as per the Economic Survey 2023-24, presented before the Union Budget.

For FY24, India’s GDP growth came in at 8.2% for FY24 with key drivers being private consumption and investment. The growth in the primary sector (agriculture and mining) was recorded at 2.1%, with agriculture at 1.4% and mining at 7.4%. The secondary sector (manufacturing, electricity, construction) grew 9.7%, with manufacturing and construction sectors recording growth of 9.9% and electricity at 7.5%.

For FY25, the recent Economic Survey indicated some of the key factors of the growth. Firstly, improved balance sheets will aid the private sector in catering to a strong investment demand. Secondly, the forecast of normal rainfall by the India Meteorological Department and the satisfactory spread of the southwest monsoon is expected to boost the performance of the agriculture sector thereby supporting the resurgence of rural demand. Thirdly, the maturity of structural reforms such as the Goods and Services Tax (GST) and the Insolvency and Bankruptcy Code (IBC) is expected to bring the envisaged outcomes.

Inflation

The Budget speech evoked confidence on inflation to be tamed down closer to the 4% target. The Centre has managed to tame down the inflation in FY24 through administrative and monetary policy measures despite global uncertainties, supply chain disruptions, and the vagaries of monsoon.

According to the recent Economic Survey, the decline in retail inflation in FY24 is mainly driven by goods and services inflation, which fell to 4-year and 9-year lows (core inflation), respectively. Food inflation continues to be a concern due to inclement weather and crop damage that impacted farm output and prices. It rose from 6.6% in FY23 to 7.5% in FY24, as per the Survey. RBI has projected annual inflation to go down to 4.5% in FY25 and 4.1% in FY26, assuming normal rainfall and the absence of external shocks.

Capital expenditures

The Centre retained the capital outlay of INR 11.11 lakh crore for FY25, which is the same as the Interim Budget presented in February this year. This reflected a 2x rise in spending on infrastructure over the past three years to generate demand and create more jobs across the economy via deployment in core sectors like cement, steel, fertilizers, etc. As a percentage of GDP, long-term capex rose from 1.7% in FY20 to 3.4% in FY25.

Despite the no change in capex, the mix of capex allocation has changed to some extent compared to the Interim Budget. For example, interest-free 50-year capex loans to states witnessed an increase (to INR 1.5 lakh crore from INR 1.3 lakh crore in Interim Budget) while allocations to agriculture, housing, urban development (smart cities & metro projects), education, and National Health Mission in terms of schemes stepped up.

Fiscal consolidation continues

The Centre has cut its fiscal deficit target to 4.9% of GDP in FY25 from 5.1% of GDP in the Interim Budget. Consequently, it has reduced the borrowing estimates to meet its fiscal deficit target by issuing dated securities. The estimate for gross borrowing has been reduced to INR 14.01 lakh crore from INR 14.13 lakh crore in the Interim Budget while the net borrowing estimate stands at INR 11.63 lakh crore for the year. Both gross and net borrowings are lower than FY24 by 9.2% and 1.5%, respectively.

Post the Budget announcement about a reduction in market borrowing, the bond market reacted as yields went down and touched an intra-day low of 6.926% but soon recovered and ended the day flat at 6.969% as the reduction in borrowing was lower than expected.

The reduction in borrowing estimates for FY25 is supported by higher revenue receipts mainly due to additional RBI & PSU dividends. (The Budget set a revenue receipts target of INR 31.3 lakh crore for FY25, an increase of 14.7% from FY24.) The RBI dividend was higher than expected and provided a fiscal space of 0.4% of GDP compared to the Interim Budget. The additional fiscal space has been utilized to hike expenditure by 0.2% of GDP and the rest to reduce fiscal deficit by 0.2% of GDP compared to the Interim Budget. Gross tax-to-GDP ratio is anticipated to rise to 11.8% in FY25 from 11.6% in FY24.

The Centre voiced its commitment to maintain the fiscal deficit each year at a level that would put government borrowing on a declining path as a percentage of GDP. Next year, it aims to lower the fiscal deficit target below 4.5% of GDP.


Disclaimer:

The views provided in this blog are the personal views of the author and do not necessarily reflect the views of Vivriti. This article is intended for general information only and does not constitute any legal or other advice or suggestion. This article does not constitute an offer or an invitation to make an offer for any investment.  

DATE
December 14, 2023
PLACE
Mumbai
READING TIME
10 mins

US Fed keeps rates steady for the third time, indicates rate cuts in 2024

The 19-member US Federal Open Market Committee (FOMC) unanimously kept the federal funds rate steady at the 22-year high target range of 5.25%-5.5% for the third time in a row after following a spate of 11 rate hikes since March 2022 (including four in 2023) to combat inflation.
“Inflation has eased from its highs, and this has come without a significant increase in unemployment. That’s very good,” said Jerome Powell, the Federal Reserve Chair. In fact, this is the first time the Fed has formally acknowledged progress in its fight against inflation since its first spike in June 2022.

Inflation in the US came down to 3.2% YoY in October from September’s reading of 3.7% and last year’s peak of 9.1%. It came in below the consensus estimate of 3.3%. The core CPI, which excludes the impact of food and energy prices, went up 4% YoY in October, which was also below the consensus estimate of 4.1%.

While sounding confident, Powell is not yet ready to commit that the work is over. “This result is not guaranteed. It is far too early to declare victory,” he said while warning that the US economy could still enter recession unexpectedly despite being resilient in 2023.

Rate Cuts and Economic Projections

Projections after the Fed meeting indicated the end of the tightening cycle. A near-unanimous 17 of 19 Fed officials predicted lower policy rates by the end of 2024. The median projection for interest rates at the end of next year has been reduced to 4.5% and 4.75%, signalling 75 basis points (bps) of cuts from current levels. Assuming 25 bps per cut, it translates to three rate cuts in 2024.

In the Summary of Economic Projections (SEP), the Fed foresees core inflation peaking at 2.4% in 2024, which is lower than September’s projection of 2.6%, before softening to 2.2% in 2025 and 2% (the target rate) in 2026.

Projections for GDP growth have been lowered marginally from 1.5% to 1.4% in 2024 and are seen to improve to 1.8% in 2025 and 1.9% in 2026. Meanwhile, the unemployment rate is expected to rise from 3.7% currently (in November) to 4.1% in 2024 and continuing at that level in 2025 and 2026.

Fed’s ‘dot plot’, which maps out directions in policymakers’ expectations for interest rates going ahead, shows individual expectations of four more cuts in 2025 and three more in 2026, while longer-range projections seem to be less firm.

Our Take

Overall, the US Fed’s comments on the progress on inflation and its discussion of rate cuts during the policy meeting (in deviation from the last policy where there were no discussions on cuts) are perceived to be dovish. The statements on taking action, if prices were to rebound, were conveniently ignored as the focus shifted to the Fed’s muted response on the cuts being priced already and easing financial conditions.

Markets cheered the policy with US bond yields dropping 20-30 bps led by the front end of the curve, with a 90% probability of a rate cut as early as March next year. Risk assets roared and the dollar weakened in response to the last policy of an extremely volatile year.

While the gradual direction of yields looks softer, markets have gone a little ahead in pricing much more aggressive cuts than what the Fed indicated. While the hiking cycle is broadly behind us, cuts could be delayed if there are a couple of adverse data surprises, keeping rates a little higher for longer.

Disclaimer:

The views provided in this blog are the personal views of the author and do not necessarily reflect the views of Vivriti. This article is intended for general information only and does not constitute any legal or other advice or suggestion. This article does not constitute an offer or an invitation to make an offer for any investment.  

DATE
October 3, 2023
PLACE
Mumbai
READING TIME
10 mins

US Fed Meeting and Takeaways from other macroeconomic events in September 2023

The US Federal Reserve kept its key interest rates unchanged at 5.25-5.5% in a unanimous decision by the Federal Open Market Committee (FOMC). This happened after the committee took the benchmark rate to a 22-year high at their July meeting with a 25 basis points (bps) hike. The key rate set at the meeting determines what American banks would charge each other for overnight lending but it impacts other forms of consumer debt as well.

While the status quo was on the expected line what was more important is how FOMC would pave the way for future rate hikes. “Tighter credit conditions for households and businesses are likely to weigh on economic activity, hiring, and inflation. The extent of these effects remains uncertain,” FOMC said while adding that it remains “highly attentive to inflation risks”.

The committee tightened its hawkish stance in the meeting indicating a further rate hike (probably a quarter percentage point) by the end of 2023. A total of 12 out of 19 members in the committee believed it to be appropriate while the remaining seven favoured to keep the rates steady. If the hike materializes, the Fed will end up making a dozen rate hikes since the tightening cycle began in March 2022.

For 2024, the Fed indicated more tightening than previously expected. The committee projected the median Federal Funds rate at 5.1% in 2024, which is higher than the June estimate of 4.6%. The committee has further projected rates to dip to 3.9% in 2025 and 2.9% in 2026. This is the first time FOMC provided a rate outlook for 2026. The projected rate for 2026 is higher than the “neutral” rate of interest (which is neither stimulative nor restrictive to growth) of 2.5%.

Apart from providing an outlook on future rate hikes, the FOMC also upgraded its 2023 estimates for economic growth from 1% earlier to 2.1% at the meeting. It further projected a GDP growth of 1.5% in 2024. The unemployment rate is expected to peak at 4.1% in 2023, which is lower than the 4.5% estimated in June.

Other Macroeconomic Events

Global Updates

  • The European Central Bank (ECB) hiked its key interest rate by 25 basis points (for the 10th time in 14 months) to a record 4%, indicating this could be its last rate hike amid the subdued economic activity over January-June. The latest hike is geared towards the target inflation of 2%. Meanwhile, the European Commission sees average inflation settling at 6.5% in 2023 and raised its inflation forecast for 2024 from 3.1% earlier to 3.2%. The commission has revised the growth projection for the Eurozone down by 0.2 percentage points (ppts) to 0.8% for 2023 and 0.3 ppts to 1.4% for 2024 on the back of weaker growth momentum.
  • The Reserve Bank of Australia kept the interest rates unchanged at 4.1% for the third time at the September policy meeting but warned of monetary policy tightening going forward. The central bank stated that recent data were consistent with inflation returning to the target range of 2-3% in late 2025.
  • The Bank of Canada decided to hold its key overnight interest rates at 5% with the Bank Rate at 5.25% and the Deposit rate at 5%. The central bank will continue with quantitative tightening. The CPI inflation in Canada rose to 3.3% in July after softening to 2.8% in June, averaging near the bank’s projection of 3%. However, the bank noted that the “Canadian economy has entered a period of weaker growth, which is needed to relieve price pressures”.
  • The Bank of Japan continued with its ultra-loose monetary policy by keeping the short-term interest rates unchanged at -0.1% and capping the 10-year Japanese government bond yield around zero, both as expected. The decision was based on “extremely high uncertainties” on the domestic and global growth outlook. The Bank of England maintained its key interest rate at 5.25% following 14 consecutive hikes. Britain’s consumer inflation softened to 6.7% in August, which is the lowest level since Feb 2022. The People’s Bank of China also kept its 1-year loan prime rate unchanged at 3.45% while the 5-year benchmark loan rate — the peg for most mortgages — was held at 4.2%. This happened as the economy started showing signs of stabilization following the policy support. Meanwhile, Turkey’s central bank raised its key interest rate by 500 bps to 30% following a series of rate hikes. The country is struggling with years of steepening inflation and depreciating currency. Turkish Lira is down ~30% against the USD year-to-date while its annual inflation jumped to ~59% in August.

Inflation readings 

  • Consumer price inflation in the US accelerated from 3.2% YoY in July to 3.7% YoY in August (against the consensus of 3.6%) due to higher gas prices. However, core inflation, which strips out the effect of volatile food and energy prices, slowed from 4.7% in July to 4.3% in August, the lowest since Sep 2021.
  • Inflation in the Euro Zone remained steady at 5.3% YoY in August compared to the previous month and came in above the consensus of 5.1%. However, core CPI softened to 5.3% in August from 5.5% in July. Energy prices declined at a slower pace (-3.3% in August vs. -6.1% in July) while inflation in food, alcohol, and tobacco was 9.8% in August vs. 10.8% in July; non-energy industrial goods was 4.8% in August vs. 5% in July; services was 5.5% in August vs. 5.6% in July.
  • Inflation in Europe’s largest economy Germany came in at 6.4% YoY in August, preliminary data from the Federal Statistics Office revealed. This compares with a reported inflation of 6.5% in July. Core CPI remained steady at 5.5% YoY in the last month.
  • The consumer price inflation in the UK unexpectedly dropped to 6.7% YoY in August from 6.8% in July against projections of 7% due to a rise in fuel prices and alcohol tax. According to the Office for National Statistics, the drop is led by a fall in hotel prices and airfares, as well as food prices rising by less than the same period last year.
  • Consumer prices in China returned to positive territory in August by rising 0.1% YoY, showing signs of stabilisation in the economy, compared to a 0.3% fall in July. Producer prices data also indicated some recovery as the decline was less intense in August at 3% YoY compared to 5.4% and 4.4% in June and July, respectively.
  • Australia’s consumer price inflation accelerated to 5.2% in August from 4.9% in July due to rising fuel prices and rents. However, the Reserve Bank of Australia board members decided to leave the Official Cash Rate unchanged at 4.10% at the recent meeting.

Other economic indicators

  • Manufacturing activities in the US, UK, and the Eurozone remained in the contractionary zone in August as suggested by the Purchasing Managers’ Index (PMI) survey data. In the US, manufacturing PMI fell from 49 in July to 47.9 in August due to shrinkage in new orders on the back of weaker economic conditions. In the Eurozone, manufacturing PMI rose from 42.7 in July to 43.5 in August but conditions in the sector remained under stress. New orders are falling steeply placing huge pressure on production lines. In the UK, manufacturing PMI declined from 45.3 in July to 43 in August due to weak domestic and export demand. In fact, PMI dipped to the 39-month low during the month. However, manufacturing PMI in China improved from 49.2 in July to the expansionary zone at 51 in August driven by increase in new domestic orders.
  • In the services sector, the US and China remained in the expansionary zone while the activities in the Eurozone and UK showed contraction, as per PMI readings. In the US, services PMI rose from 52.7 in July to 54.5 in August (the highest reading since February). In the Eurozone, services PMI slipped from 50.9 in July to a 30-month low of 47.9 in August. The fall was prominent in countries like Germany (44.6) and France (46). In the UK, the services sector contracted for the first time since January as the PMI declined from 51.5 in July to 49.5 in August due to weak demand. In China, Caixin Services PMI declined from 54.1 in July to 51.8 in August due to sluggishness in sector activity due to weak demand.
  • Real GDP growth in the US slightly decelerated to 2.1% in the second quarter of 2023 from the revised 2.2% in the first quarter of the year. However, the reading came in line with the market expectations. The last reported quarter was marked by growth in business investment, consumer spending, and state and local government spending, partially offset by a decline in exports.


  • The Asian Development Bank (ADB) revised the economic growth projection for developing nations of Asia-Pacific to 4.7% in 2023 from 4.8% previously while the growth forecast for 2024 is kept unchanged at 4.8%. Healthy domestic demand and the reopening of the Chinese economy aided growth in the first half of the year and the impact is expected to continue. However, weakness in China’s real estate sector, higher interest rates globally, supply chain disruptions, export restrictions, and higher risk of droughts and floods caused by El Niño pose a threat to economic growth. ADB has slightly lowered India’s projection from 6.4% to 6.3% for 2023 due to sluggish exports and the negative impact of the erratic rainfall on agriculture output. However, the growth for 2024 is retained at 6.7% as higher private investment and industrial output are expected to drive growth.

 Domestic Updates

  • India’s retail inflation softened to 6.83% YoY in August from a 15-month high of 7.44% YoY in July due to a decline in food prices, mainly vegetables. However, inflation for the month remained above the upper end of the RBI target band (2-6%) for a second consecutive month. Food items, which have ~50% of weightage in the index, saw prices rising by 9.94% in August versus 11.51% in July.
  • The deflation in wholesale prices continued for the fifth consecutive month. In August, the wholesale price index-based inflation rose to a 5-month high of -0.52% from -1.36% in July. Inflation in food items remained in double digits but eased to 10.60% in August from 14.25% in July. The deflation in fuel and power basket declined to -6.03% in August from -12.79% in July.

  • The growth in India’s industrial output accelerated to a 5-month high of 5.7% YoY in July from 3.7% in June. The reading came in above the consensus estimate of 5%. The growth during the month was supported by improvements in all 3 sectors – mining (up 10.7% YoY), manufacturing (up 4.6% YoY), and electricity (up 8% YoY).

  • Retail inflation for Agricultural Labourers (AL) and Rural Labourers (RL) softened marginally to 7.37% YoY and 7.12% YoY, respectively, in August driven by lower fuel prices and a decline in costs of clothing, bedding, and footwear. The major contribution towards the rise in the general index of AL and RL occurred due to food items caused by higher prices of rice, wheat atta, pulses, milk, meat-goat, sugar, gur, chillies-dry, turmeric, garlic, onion, mixed spices, etc.

  • Foreign direct investment (FDI) into India declined 34% to US$10.94 billion during the first quarter (Apr-June) of fiscal 2024. FDI inflow fell from countries including Mauritius, Singapore, the US, and the UAE during the quarter. Maharashtra remained the top destination for FDI, followed by Karnataka, Gujarat, and Delhi.
  • India’s manufacturing sector grew at the fastest pace in 3 months in August driven by a solid rise in new orders and production. This is reflected in the S&P Global Manufacturing PMI survey as the reading increased from 57.7 in July to 58.6 in August, which is the second-biggest rise in about 3 years.
  • The Reserve Bank of India (RBI) announced that it would discontinue the incremental cash reserve ratio (I-CRR) in a phased manner. Introduced in August, I-CRR was meant to absorb the surplus liquidity generated by various factors, including the return of 2,000 rupees notes to the banking system. The central bank mandated banks to maintain an I-CRR of 10% on the rise in their net demand and time liabilities (NDTL) between May 19 and July 28, 2023. The central bank will now release the amount that banks have maintained under I-CRR in stages.
  • JPMorgan Chase will include Indian bonds on its emerging market index, JPM Government Bond Index-EM Global Diversified Index. It will be the first global index provider to include Indian bonds. Effective from Jun 28, 2024, the inclusion will enable foreign fund inflows to the nation’s debt market. The JPM Government Bond Index-EM Global Diversified Index was launched in June 2005 as the first comprehensive global local emerging markets index. It tracks local currency bonds issued by emerging market governments and has assets under management of ~US$213 billion.
  • The growth in India’s GDP was 7.8% (the highest in four quarters) in the first quarter of FY24, which is faster than the 6.1% reported in the previous quarter. The acceleration can be attributed to the contribution of a robust services sector and strong capital expenditure. In particular, the growth is largely attributed to contributions from trade, hotel, transport, communication, and services related to broadcasting along with financial, real estate, and professional services. The economic growth is lower than the RBI projection of 8% for the first quarter. However, street estimates projected a growth of 7.7% in the quarter.
  • S&P Global Ratings retained India’s GDP growth forecast at 6% for FY24 citing global economic slowdown, monsoon risks, and delayed rate hikes. The projection is lower than RBI’s growth forecast of 6.5% for the fiscal year. The global rating agency also forecasted growth of 6.9%, 6.9%, and 7% for FY25, FY26 and FY27, respectively.


Disclaimer:

The details mentioned above are for information purposes only. The information provided is the basis of our understanding of the applicable laws and is not legal, tax, financial advice, or opinion and the same subject to change from time to time without intimation to the reader. The reader should independently seek advice from their lawyers/tax advisors in this regard. All liability with respect to actions taken or not taken based on the contents of this site are hereby expressly disclaimed.

DATE
August 14, 2023
PLACE
Mumbai
READING TIME
10 mins

RBI maintains the status quo, MPC decided to remain watchful (A short note)

RBI’s Monetary Policy Committee (MPC) continued with its pause on the hike in repo rate — the rate at which the central bank lends short-term funds to commercial banks — for the third time in a row in a unanimous vote. RBI hit the brake on the rate hike cycle in April this year after six consecutive hikes aggregating 250 basis points (bps) since May 2022.

A majority of five out of six MPC members remained focused on ‘withdrawal of accommodation’ believing the monetary transmission is still in progress which will progressively align the headline inflation with the target (4%) while supporting growth.

Growth Projections

With risks evenly balanced, the central bank retained the projection for GDP growth at 6.5% for FY24 with 8% in the first quarter, 6.5% in the second quarter, 6% in the third quarter, and 5.7% in the terminal quarter of the fiscal year.

The central bank expressed concerns about the global growth scenario due to elevated inflation, high levels of debt, volatile financial conditions, and other factors. However, it believes India can withstand the external headwinds better than many other economies. It has highlighted many factors indicating economic resilience in the domestic economy, some of which include —

  • Sustained growth in air passenger traffic, passenger vehicle sales, and households’ credit.
  • Incipient recovery in rural demand, marked by growth in agricultural credit and higher FMCG sales volume, which could be strengthened by prospects of a better kharif season.
  • Higher capacity utilisation in the manufacturing sector compared to the long-term average.
  • Healthy services sector activity marked by the expansion in e-way bills, toll collections, railway freight, and rise in services purchasing manager’s index (PMI) reading.
  • Strong construction activity in the first quarter as indicated by healthy growth in cement production and steel consumption.
  • Strong momentum in industrial activity as evident from the recent trend in the index of industrial production (IIP). Notably, the growth in IIP in May accelerated to a 3-month-high of 5.2% from 4.5% in April driven by strong growth in the mining and manufacturing sectors.

Inflation projection

RBI revised upward the inflation projections for FY24 by 30 bps to 5.4%. However, in the previous MPC meet, it cut the inflation forecast from 5.2% to 5.1%. The uptick in projection is caused by a recent spike in vegetable prices, especially tomato, along with elevated prices of cereals and pulses.

Quarter-wise, the forecast has been accordingly raised from the earlier level of 5.2% to 6.2% for the Jul-Sep quarter and from 5.4% previously to 5.7% for the Oct-Dec quarter. However, the projection for the fourth quarter of FY24 has been kept intact at 5.2%.

The headline inflation plunged to the 25-month low of 4.25% in May before rising to 4.81% in June due to vegetable prices, which may see a correction soon, as per RBI Governor Shaktikanta Das. However, El Niño weather conditions along with global food prices need to be closely monitored causing the central bank to remain watchful about the risks to price stability.

Incremental CRR

RBI has noted a rise in the level of surplus liquidity in the system due to the return of INR 2,000 currency notes to banks among other factors such as the pickup in government spending and capital inflows, and surplus transfer by RBI to the government.

The central bank is of the view that excess liquidity can pose risks to price and overall financial stability. Hence, it has asked scheduled banks to maintain an incremental cash reserve ratio (I-CRR) of 10% on the increase in net demand and time liabilities (NDTL) between May 19 and July 28 to suck up the surplus liquidity. However, this would be a temporary measure to manage excess liquidity and will be reviewed on September 8 while the existing CRR remains intact at 4.5%.


Disclaimer:

The views provided in this blog are the personal views of the author and do not necessarily reflect the views of Vivriti. This article is intended for general information only and does not constitute any legal or other advice or suggestion. This article does not constitute an offer or an invitation to make an offer for any investment.  

DATE
August 9, 2023
PLACE
Mumbai
READING TIME
10 mins

Credit profiles of fertilizer manufacturers to remain stable with easing working capital burden and stable profitability levels

Fertilizer is an essential part of the agriculture value chain and plays a key role in enhancing farm output. India is the second largest consumer of fertilizers globally, after China, with annual consumption of around 63.5 million metric tonnes in fiscal 2023. Given the criticality of the sector to India’s overall agricultural production, the fertilizers industry is closely regulated by the Government and is also highly subsidised with subsidy pay-outs of around INR 2.5 lakh crore in fiscal 2023.

At present there are around 25 different varieties of fertilizers consumed in India which can be broadly categorised into Nitrogenous, Phosphatic, Potassic and Complex fertilizers depending on the nutrient content. Urea (a type of nitrogenous fertilizer) is the most prevalent variety in India, accounting for more than 50% of the overall consumption.

After witnessing decline in FY22, fertilizer consumption in India recovered in FY23 with normal monsoons and increased fertilizer availability with easing of global supply disruptions. Higher subsidy payouts by the Government compensated for the higher input costs. In the current fiscal, consumption is expected to grow by around 1-3% in FY24 amid normal monsoon expectations and stable MRPs provided to farmers. Urea remains the dominant form of fertilizer considering its lower MRP and preference with lower and middle income farmer groups. However, share of non-urea is expected to improve over the long term with government measures and increasing awareness amongst farmers about adverse effects of excess nitrous fertiliser usage on soil fertility.

On the supply side, India is also the third largest producer of fertilizers globally and meets 70% of its own demand through domestic production.

Import dependence is lower for urea at around 20% of consumption, while it is higher for non-urea fertilizers at around 40% of consumption, due to the lack of key raw material availability for some varieties. Key raw materials for fertilizers include natural gas (for Urea), ammonia, rock phosphate, sulphur and phosphoric acid. India does not have significant reserves of rock phosphates or potash, key raw material for phosphatic and potassic fertilizers respectively. Besides, for urea, around 60-70% of the natural gas requirement is met through imported liquified natural gas (LNG). This in turn leads to high import dependence of raw materials for the industry.

Landed costs for raw materials increased sharply in FY22 and H1 FY23 owing to supply constraints following export sanctions on Russia and Belarus, and restrictions by China on exports of fertilizers. For instance, rock phosphate prices more than doubled to around $280 per ton in H1 FY23, compared to around $100 per ton two years earlier. Similar sharp increase was witnessed for other raw materials like ammonia, natural gas, sulphur as well.

However, the input prices have started correcting from H2 FY23 onward with easing global supply scenario and are expected to reduce further towards the long term average levels in the near to medium term.

India’s urea capacity is around 29 million tonnes and non-urea capacity is around 20 million tonnes, with average capacity utilization of around 90%. Except for revival of few closed units (predominantly Urea producers), no major greenfield or brownfield capacities are expected to come onstream in the medium term, and hence existing capacities are expected to operate at high utilization levels to meet fertilizer demand.

In this context, for domestic fertilizer manufacturers, while demand and volume expectations remain steady, falling raw material prices and lower subsidy rates are expected to lead to lower revenues in the current fiscal. Profitability margins however are expected to remain rangebound as volatility in raw material prices are largely absorbed through subsidies, providing protection to manufacturer margins.

  • On urea side, subsidy contributes around 90% of realization and subsidy rates are directly linked to underlying raw material (pooled gas prices) enabling complete pass through.
  • On non-urea side, subsidy contribution is relatively lower at around 50-60% of realization and is determined by the nutrient based subsidy (NBS) rates fixed by the Government periodically. The Government has been proactive in adjusting NBS rates in the past in line with movement in underlying raw material (ammonia, rock phosphates) prices thereby protecting the margins of manufacturers.

Working capital build up has been a key monitorable for the industry due to the high dependence on Government subsidies. Subsidy arrears for fertilizer manufactures had been elevated till fiscal 2020 owing to delays in subsidy receipts from Government. However, the same has substantially reduced in the last 3 years following the one-time additional subsidy of Rs 65,000 crores rolled out by the Government in fiscal 2021 under Aatmanirbhar 3.0 package.
Going forward, we don’t expect similar build up in arrears as seen prior to 2021, considering sufficient budgetary allocation for fertilizers and softening prices in turn reducing the subsidy burden for the Government. Further, the Government has also implemented the Direct Benefit Transfer (DBT) scheme) ensuring faster transmission of subsidies to the manufacturers.
With stable margins and subsidy receivables being under control, credit profiles of manufacturers are expected to remain healthy and should enable their access to financing from both banks and capital market investors.

Disclaimer:

The views provided in this blog are of the author and do not necessarily reflect the views of Vivriti. This article is intended for general information only and does not constitute any legal or other advice or suggestion. This article does not constitute an offer or an invitation to make an offer for any investment.  

DATE
June 26, 2023
PLACE
Mumbai
READING TIME
10 mins

El Nino impact on Indian Economy

What is El Nino?

El Nino is a climatic condition which results in warming of surface water in the equatorial Pacific Ocean suppressing monsoon rainfall in India. It impacts monsoons and consequently agricultural output, which in turn bears on inflation and economy.

Under normal conditions over Pacific Ocean, trade winds blow west along the equator, taking warm water from South America towards southeast Asia. This phenomenon brings monsoon to India between June to September. During El Nino periods, there is unusual warming of surface waters in the east tropical Pacific Ocean, and hence trade winds blow in the opposite direction. This phenomenon reduces rainfall in India and increases rainfall in South America. Depending upon its intensity El-Nino could cause below-normal monsoon or even draught in India and other southern eastern countries such as Indonesia and Australia.

High probability of El Nino this year

After 4 years of normal monsoon, India is staring at below-normal monsoon this year. In the case of India, the occurrence of El Nino is linked with the poor monsoon implying below normal or deficient rainfall during the June-September period.

As per the latest monthly update by National Oceanic and Atmospheric Administration (NOAA, a US based agency) issued in May 2023, there is 90% probability of occurrence of El Nino between June and August, and more than 90% probability of occurrence between July and September, which is the peak period of Indian monsoon. Arrival of El Nino after September is not expected to impact India’s monsoon.

Favourable effect of Indian Ocean Dipole can offset the impact of El-Nino to some extent

IOD refers to the difference in temperature between western pole of Arabian sea and eastern pole of eastern Indian ocean south of Indonesia.

Indian Meteorological Department (IMD) has predicted normal monsoon for the current year, and that positive Indian Ocean Dipole (IOD) could offset impact of El Nino and result in favourable monsoon. IOD is currently neutral, and index value for the week ending 20th June 2023 was 0.0°C, which is within neutral bounds (between -0.40°C and +0.40°C). As per Australian Bureau of Metrology, there is high probability of the IOD to increase above +1.2°C between July and September.

The impact of phenomenon on southwest monsoon

We have had 21 El Nino years and 15 draughts over the last 50 years in India. 10 of the 15 draughts where during the El Nino years. Historically during strong or moderate El Nino years, rainfall reduced up to 24% and average deviation in rainfall was around 15%.

Past data also show that during some El Nino years, rainfall was normal owing to favourable offsetting factors. For example, despite 1994, 1997 and 2006 being El Nino years, India received normal or even excess rainfall as IOD was positive. In 1969, 1976, and 1977, India received normal rainfall either because the intensity of El Nino was weak, or its arrival was towards the end of India’s monsoon season.

El Nino impact on Inflation during the last two decades

Over the last two decades there have been instances of spike in inflation traced to intensity of El-Nino in that or the previous year. For instance, during 2002-03, 2009-10 and during 2015-16 where El-Nino intensity was moderate or strong, WPI inflation during the subsequent year increased. Adequate stock of food grains maintained by FCI softened the impact on inflation in some of those years.

Possible Impact on Indian Economy in FY24

India is currently battling to tame inflation, rekindle rural demand, and maintain consumption growth, amidst adverse weather conditions (heat waves) and global slowdown.  Currently, agriculture contributes 18% to India’s GVA (gross value add) and 47% of work force is employed under agriculture sector. More than 50% of net sowed land in India depends on monsoon rain, which also replenish water reservoirs, and hence bears heavily on farm production. Below-normal monsoon could impact farm production, commodity prices and dent rural demand, which could in turn spill over to sectors such as FMCGs, Automobiles (2W, 3W and tractor), cement, and agro chemicals.

Additionally, should Australia (key exporter of wheat) and Indonesia (key producer of rice and exporter of palm oil) be adversely impacted by El Nino, food prices in international markets could rise, also posing upside risk to inflation in India.

Over the years however, there has been diversification in rural economy away from agriculture. According to Niti Aayog report, 2/3rd of rural income is contributed by non-agricultural sectors such as manufacturing, construction, and services. Government’s spending on infrastructure also adds to non-farm income. These factors could offset the impact of El Nino on rural demography.

As per Food Corporation of India (FCI), wheat stock as of June 2023 was around 31.3 MMT (2022: 28.5 MMT) and rice was 26.2 MMT (2022: 31.7 MMT), well above buffer levels. This should help in case of shortage of rainfall and consequent lower-than-expected production. Government could also ban export of key food grains to curtail inflation

Conclusion

While El-Nino is likely, its impact hinges upon several factors such as its timing and intensity, and that of IOD during the next three months. Given the dependence of agricultural produce on monsoon, below-normal rains could pose upside threat to inflation and dampening of rural demand. This could partially be offset by diversification of rural income and Government’s steps to curb food prices.

Disclaimer:

The views provided in this blog are of the author and do not necessarily reflect the views of Vivriti. This article is intended for general information only and does not constitute any legal or other advice or suggestion. This article does not constitute an offer or an invitation to make an offer for any investment.  

DATE
June 9, 2023
PLACE
Mumbai
READING TIME
10 mins

RBI MPC announces the second consecutive pause in rate hikes, what’s next? (A short note)

In a unanimous vote, RBI’s Monetary Policy Committee (MPC) hit the pause button for the second consecutive time in raising the repo rate — the rate at which the central bank lends short-term funds to commercial banks. While doing so, RBI retained the policy stance as “withdrawal of accommodation”, implying it could consider further hike rates if necessary.
The two consecutive pauses occurred after RBI MPC hiked the repo rate for the sixth time in a row this February. Since May 2022, RBI hiked repo rates by 250 basis points (bps). In FY23, the rate hiking cycle began with a 40 bps hike followed by three consecutive hikes of 50 bps and then with 35 bps in Dec 2022 and 25 bps in Feb 2023.

Factors influencing future policy decisions

Inflation

Retail inflation is one of the key factors that kickstarted the rate hike cycle in May last year. A month before that, in April, the inflation based on the Consumers Price Index (CPI) peaked to a near 8-year high of 7.79% due to supply chain disruptions caused by geopolitical tensions, and soaring crude and food prices. The chain of aggressive rate hikes by RBI began to restore the inflation levels to the central bank target range of 4 +/- 2%.

This April, retail inflation softened to an 18-month low of 4.7% YoY and remained within the tolerance band of RBI for the second consecutive month. Food inflation cooled off to 3.84% in April from 4.79% in March. The producers’ price inflation based on Wholesale Price Index (WPI) fell to a negative territory hitting a 34-month low of -0.92% YoY in the month.

Since the rate hike cycle began, crude oil prices fell from their peak of ~US123/bbl in Jun 2022 to ~US$76/bbl on Jun 8. In the same timeframe, the benchmark 10-year yield, an indicator of future expectation of interest rates, dropped from its peak of ~7.6% in mid-Jun 2022 to ~7.0% on Jun 8.
RBI MPC has cut its projection for inflation for FY24 from 5.2% to 5.1%. It includes a forecast of 4.6% for the first quarter, 5.2% for the second quarter, 5.4% for the third quarter, and 5.2% for the fourth quarter.

While the tamed inflation forecast may indicate a longer pause, RBI Governor Shaktikanta Das said that “Our goal is to achieve the inflation target of 4%, and keeping inflation within the comfort band of 2-6% is not enough.” The chances of inflation falling below 4% may not happen in the near term, however, the prediction of a favourable monsoon and stronger GDP growth bodes well for the pause scenario.

Monsoon, GDP growth, and other tailwinds

The Indian Meteorological Department recently predicted a “normal” monsoon for this year at the long period average (LPA) of 96% despite the higher probability of El Nino, a climate condition pattern that describes the unusual warming of surface waters in the eastern tropical Pacific Ocean. However, IMD revealed that most parts of India will witness deficient rainfall in June, except for some areas in peninsular regions.

India’s GDP (at constant 2011-12 prices) grew at a faster rate of 6.1% YoY (higher than estimates) in Q4FY23 compared with 4.5% YoY in the previous quarter. Given this pace, the annual growth came in at 7.2% YoY driven mainly by improvements in agriculture, manufacturing, mining, and construction sectors.

RBI has projected a growth of 6.5% in real GDP for FY24. It was the same forecast the central bank made in the April meeting when it was revised upwards from 6.4%. Throughout the fiscal year, the growth is distributed as 8% for the first quarter, 6.5% for the second quarter, 6% for the third quarter, and 5.7% for the fourth quarter.

As per Shaktikanta Das, “Domestic demand conditions remain supportive of growth. Urban demand remains resilient, with indicators such as passenger vehicle sales, domestic air passenger traffic, and credit cards outstanding posting double-digit expansion on a year-on-year basis in April. Rural demand is also on a revival path – motorcycle and three-wheeler sales increased at a robust pace in April, while tractor sales remained subdued.”

Further, healthy economic indicators like strong growth in GST collections (up 12% YoY to INR 1.57 lakh crores in May, following a record-high GST collection of INR 1.87 lakh crores in April) and encouraging PMI reading (hit the 31-month high of 58.7 in May and remained above the 50-mark for 22 consecutive months) certainly indicates resilience in the domestic economy.

Lastly, the movement of the US Federal Reserve is something to look out for as it sets the sentiment of a rate hike across the globe. Last month, US Fed raised the key short-term interest rates by 25 bps to a range of 5-5.25%, pushing borrowing costs to their highest level since August 2007. However, market experts believe that the Fed is expected to leave interest rates alone in the upcoming meeting next week. As per CME FedWatch Tool, Fed futures are reflecting a ~76% probability of a pause and ~24% probability of a 25 bps hike in the Jun 14 meeting at the time of writing.


Disclaimer:

The views provided in this blog are the personal views of the author and do not necessarily reflect the views of Vivriti. This article is intended for general information only and does not constitute any legal or other advice or suggestion. This article does not constitute an offer or an invitation to make an offer for any investment.  

DATE
June 6, 2023
PLACE
Mumbai
READING TIME
10 mins

Road asset monetization/ refinancing requirements to see a spurt in the near term

Road assets account for ~27% of national monetisation pipeline (NMP) drafted by NITI Aayog. Under NMP, 26,700 km of road assets valued at INR 1.6 lakh crore were to be monetised over a 4 year period (FY22-FY25). Till Mar’23, only ~14% (by value) of the targeted assets have been monetised, as against plan of ~39%, owing to muted interest from private sector for some of the stretches considering high traffic and toll collection risks to be taken by the buyers. Hence NHAI is expected to significantly ramp up efforts in the coming 2 years to meet NMP target.
Monetising more assets is critical from NHAI’s perspective as well, to contain leverage:

With spurt in new project awards through Hybrid Annuity Model (HAM) and Engineering, Procurement and Construction (EPC) routes in last 5 years, which require 40-100% of the project funding to be borne by NHAI, it’s borrowing has risen to over INR 3.4 lakh crore as of Dec’22, as against INR 1.8 lakh crore 3 years ago. NHAI’s funding requirement will only increase in the coming years, with expected roll out of more road projects under Bharatmala Pariyojana and other schemes. Hence monetisation of operational assets will be critical for NHAI to contain leverage.

NHAI has been trying TOT and InvIT routes to monetise operational road projects, however, response has been mixed:

In last 3 years, NHAI has been able to monetise assets through (Toll Operate Transfer (TOT) and InvIT routes – 22 stretches monetised through TOT (aggregate length of 1,612 km) and 8 stretches monetised through InvIT (aggregate length of 632 km). However, bidding intensity for the assets remain relatively weak owing to high operational risks that private contractors need to take on, pertaining to traffic movement, toll collection efficiency, O&M, etc. Hence only assets which have good vintage of toll collections and low traffic risk have found bidders, albeit the bid premiums over the base concession values for such assets have been high.

With only 15% of the NMP targets achieved in the last 2 years, the pace of monetisation is expected to increase in the next two years. For FY24, NHAI has already identified a pipeline of 46 assets with aggregate length of 2,612 km, which is more than the combined length of stretches monetised in last 2 years. Besides, around 80 under-construction projects are expected to achieve commercial operations date (COD) in next 2 years, which will in turn become ideal candidates for monetisation.
Traffic risks to remain a deterrent for private participation, hybrid structures can be explored:

While the pipeline of projects to be monetised remains strong, many of the stretches will remain exposed to the high operational risks. Under the current model, entirety of the traffic and toll collection risks are passed on to the private concessionaires which has resulted in dwindling interest for some of the riskier assets. Hybrid structures, where part of the traffic risk is borne by the authorities and assured minimum annualised payments are made to concessionaires, could alleviate some of the challenges with the existing TOT model.

Expectations for capital providers and developers:

Successful monetisation of projects by NHAI will directly benefit road developers, as NHAI would be able to award more projects for implementation. Besides, with lower leverage, NHAI could award more projects through the HAM or EPC routes, which would reduce the project financing burden on the contractors, as compared to BOT route. Furthermore, monetisation by NHAI could also have knock-on effects for capital providers as project debt refinancing opportunities will emerge, especially if the assets are picked up by strong sponsors.

To summarise, VAM expects a spurt in the road assets monetisation by NHAI in the next 2 years in order to meet NMP targets of the Government. Finding suitable assets for monetisation is not expected to be a challenge for NHAI, given the substantial number of projects which were recently constructed, or are in advanced stages of completion. Faster pace of monetisation would help NHAI control leverage on its balance sheet, and thereby enable awarding of more projects through HAM / EPC route in future. Having said that, traffic risk has to be adequately distributed or compensated in order to encourage higher private participation.

Disclaimer:

The views provided in this blog are of the author and do not necessarily reflect the views of Vivriti. This article is intended for general information only and does not constitute any legal or other advice or suggestion. This article does not constitute an offer or an invitation to make an offer for any investment.  

DATE
April 28, 2023
PLACE
Mumbai
READING TIME
10 mins

India’s Healthcare Sector: Opportunities and the Need for Alternative Financing

The public and private spending on healthcare delivery around the world have been rising rapidly keeping pace with the growth in economies. The working pattern of the global population has turned more sedentary especially after the pandemic. This is giving rise to the incidence of more lifestyle-led chronic diseases causing an accelerated growth in demand for healthcare services.

In India, healthcare is one of the largest sectors when it comes to contribution to the nation’s employment and revenues. As of 2021, it employed roughly 50 lakh people. The size of the healthcare market is expected to have surpassed from merely ~US$70 billion in 2012 to ~$US370 billion by 2022, suggesting a CAGR of ~16% (Statista).

The domestic healthcare delivery market can be divided into four broader segments, as shown below:–

The hospital industry expects to grow at a CAGR of 15-20% to over $130 billion by 2023. Diagnostics on the other hand, which is valued at ~$4bn (the share of the organised sector is just around a quarter of the total value) in the healthcare sector, is expected to witness secular growth at a CAGR of over 20% to $30-40 billion in the same time frame.

Opportunities

India’s demographic factors present huge opportunities in the healthcare sector. Firstly, the life expectancy of India’s population has been increasing. As per United Nations estimates, life expectancy in the country has increased from 35.21 years in 1950 to 70.4 years in 2023. It is projected to increase to ~82 years by 2100. Secondly, the rise in aging population. The share of senior citizens in India’s population is expected to double to 16% over 2011-2041 (PwC India, 2020) while the total number of senior citizens is estimated to be 30 crores by 2050 (Invest India).

Thirdly, the rising income expect to result in a shift of 7 crores+ households into the middle-class section of society by 2031 leading to growing awareness for preventive healthcare. It is estimated that 8% of Indians will earn more than US$ 12,000 per annum by 2026 (Invest India, KPMG, and FICCI, 2021).

These apart, accessibility to services due to growing penetration of health insurance, higher incidence of lifestyle diseases caused by factors including obesity, poor diet, high blood pressure, and cholesterol, etc. in urban areas, and accelerated adoption of digital technologies, including telemedicine, in the post-Covid world are expected to boost the demand for healthcare.

The demand for healthcare facilities has been rising at a faster rate in Tier 2 and Tier 3 cities due to the rapid increase in per-capita income in these regions. This led many private hospital operators to foray into areas in Tier 2 and Tier 3 locations that are farther away from metropolitan cities. As per Invest India, investment opportunities in India’s country’s hospital/medical infrastructure sub-sector are pegged at over US$32 billion. Production-linked Incentive (PLI) schemes announced by the govt and a flurry of investment avenues in contract manufacturing, over-the-counter drugs, and vaccines also boosted opportunities in the domestic manufacturing of pharmaceuticals.

The centre has allowed up to 100% Foreign Direct Investment (FDI) under the automatic route (which means the non-resident investor or Indian company can invest without prior approval from the govt or RBI) in the hospital sector and in the manufacture of medical devices.

Beds and doctors’ availability

India still faces systematic issues in terms of infrastructure and resources. Significant gaps exist between the number of beds available and the beds required. The country’s hospital bed density is much lower than the global average as depicted below while there is a shortage of skilled professionals in the sector, including doctors, nurses, paramedics, etc.

Structural Issues for private hospital operators

The credit profile of private hospital operators in India is expected to remain strong going ahead given the potential for higher revenue growth, better operational efficiency, and other factors like capacity additions. The operators are solving the structural issues as discussed below.

Occupancy rate

The bed occupancy rate (BOR) is the ratio of the number of inpatient bed days added annually to the number of functional beds. A high BOR is crucial to optimize revenue for the hospital operator. On the other end, a high OR reflects an operator’s quality of patient care, infrastructure, and level of staff training, hence, it is used to assess the performance of hospitals.

As per the 2012 guidelines of Indian Public Health Standards (IPHS), the BOR should ideally be at least 80% while a BOR of below 42% is considered very low and a BOR of 100% is not desirable as spare bed capacity should be there to accommodate variations in demand. The lack of beds causes delays in emergency departments and puts patients in clinically inappropriate wards which increases the chance of hospital-acquired infections. As per a 2021 study by NITI Aayog of district hospitals, the national average of BOR is 66% and most large hospitals are operating in the BOR range of 65-70%.

Out-of-pocket expenditures

Most of the private hospital operators in India are generating the majority portions of their revenue from out-of-pocket (OOP) payments by patients. In India, the share of OOP expenditure in total healthcare expenses stands at above 60%, which is one of the highest in the world and much higher than the global average of ~20%.

The main reasons for higher OOP in India are limited govt expenditures on healthcare and lower penetration of health insurance. It is also evident from the structure of payment modes witnessed in the Indian healthcare system as depicted below:–
It has been estimated that over 60% of the population in India pays for healthcare services in OOP mode. The ratio is less than 20% for major economies like the US, and the UK, and up to 35% for emerging economies like Brazil and China. This is because 60-70% of the Indian population is out of insurance coverage, both private and govt schemes.

As per the annual report of a private hospital operator, the bill amount sent to private and public insurance companies for inpatient services vary based on the kind of services and negotiations with each company. The amount charged to public sector companies generally comes at a discount compared to the amount paid by OOP patients.

ALOS and ARPOB

These are two key monitorable to measure the operational efficiency of hospital operators. ALOS refers to the average no. of days a patient stays in a hospital and ARPOB indicates the daily revenue that can be generated by an occupied bed for a hospital. A highly efficient operator’s target is to reduce ALOS, which helps in increasing its ARPOB to ensure that more patients get treatment at the same time.

In the above chart, average ALOS is seen improving from Q2FY22 after rising during Covid with hospitals focusing on faster turnaround and higher utilisations.
The above chart shows ARPOB on an increasing trajectory on a sequential basis. This is expected to sustain as price hikes taken by hospitals to take effect in near term.

Inpatient and Outpatient mix

Hospital operators generate ~70% of their revenue from inpatient departments and the rest 30% from outpatient departments in terms of value. However, the ratio varies across operators depending on the type of healthcare services they provide, and the ailments being treated. However, in terms of volume, outpatient departments account for ~75% of the total. Hence, a balanced inpatient and outpatient mix is essential for higher revenue and profitability of the operator.

The financing gap and the need for alternate financing

The public spending on healthcare has only been ~2% of India’s Gross Domestic Product (GDP) even three years after the outbreak of Covid-19 while the aim is to raise the share up to 2.5% of GDP by 2025. In the last Union Budget, the healthcare budget has been marginally raised from the FY23 estimate of ~INR 86,000 crores to ~INR 89,000 crores for FY24. It is also to be noted that about only 10% of hospitals in the country are public and the rest are private. (KPMG, Oct 2021)

While the healthcare expenditure ratio in terms of GDP is one of the lowest globally, the gap left by limited public financing is somewhat filled by the private sector, which makes up ~65% of the healthcare expenditure in the country. However, given the marked under-penetration in healthcare services, the sector needs a significant ramp-up in private financing not only due to the overall funding needs but also due to the underlying asymmetries in financing caused by a fragmented market.

Market fragmentation occurs because large hospital chains comprise 10-15% of the industry while the rest is controlled by small and medium doctor-run hospitals. Despite accounting for the lion’s share in the industry, the hospital operators in the mid-market space lack the right access to funding. There is no appetite from banks for funding these mid-market operators located beyond Tier 1 metros and in the districts of Tier 2/3 regions due to poor accessibility and lack of knowledge about their business models and financials.

As per S Ganesh Prasad, Founder, MD & CEO of Bengaluru-based GenWorks Health, a provider of digital solutions in the hospital and health care space, Covid has significantly improved the balance sheet and has left liquidity for healthcare providers. There is a guarded optimism and a compelling need to invest in healthcare delivery. Innovative debt / Structured funding options will play a significant role in fast tracking growth investments. Public private partnerships that cover for viability gap funding can help private players to contribute significantly to set up treatment infrastructure, said Mr. Prasad.

Large hospital chains operating in Tier 2 and 3 locations are adding capacity at a significant rate. In the last four years, major hospital chains added ~70% of their incremental supply in such locations. Government assistance in the form of 40% viability gap funding under Ayushman Bharat Pradhan Mantri Jan Arogya Yojana (PMJAY) also aided expansion to these regions. Apart from PMJAY, there are three main government schemes that hospitals cover – The Central Government Health Scheme (CGHS), Ex-Serviceman Contributory Health Scheme (ECHS), and the Employee State Insurance (ESI).

Despite the presence of Govt schemes, the delay in receivables from such schemes increases the need for working capital financing, mainly for mid-market players. Notably, the average delay in payments from Govt schemes is 4 to 6 months, with the trend has worsened in the last 3-4 years. Operations of large hospitals in tier 2 and 3 cities account for 10-20% of their balance sheet, hence, they do not get impacted. However, mid-market operators face a credit crunch to scale up their business as banks do not finance them (for issues like the inability to get invoices less than six months old). Hence, they need alternate sources of financing in the form of debt or equity.


Disclaimer:

The views provided in this blog are of the author and do not necessarily reflect the views of Vivriti. This article is intended for general information only and does not constitute any legal or other advice or suggestion. This article does not constitute an offer or an invitation to make an offer for any investment.  

DATE
February 16, 2023
PLACE
Mumbai
READING TIME
10 mins

A Note on the recent SEBI Consultation Papers for Alternative Investment Funds (AIFs)

On Feb 3, 2022, the Securities and Exchange Board of India (SEBI) came up with five consultation papers proposing changes in regulatory norms for AIFs.

SEBI releases consultation papers on regulatory norms from time to time on different aspects of the capital market to seek inputs/ suggestions from all stakeholders on their proposals.

The consultation papers released by the capital market regulator reflect its continued focus and interest in developing AIFs. The recent papers suggesting the next generation of reforms for AIFs are aimed at bringing fairness and transparency to investors. Notably, Vivriti Asset Management is already much ahead in the game with respect to the below mentioned tenets in the consultation papers.

We have briefly captured our understanding of the impact if the proposals in the papers are implemented:

1. Transparency

a)Investor participation via ‘direct plan’ and payment of distributor commission on a trail basis

The recent papers seeking feedback from industry participants include a two-fold objective in the proposal

  • AIFs to offer the option of a direct plan to its investors and
  • Creating trail model for distributor commissions in AIFs.

Similar practices have already been implemented in the mutual fund industry and which has received positive feedback from both investors and the mutual fund community. Mutual funds offer both regular plans and direct plans. In the case of a regular plan, the investor invests via an intermediary and has to bear a higher expense ratio than if he would have directly invested in the schemes due to the additional fee charged by the intermediary. The direct plan entails no distribution or placement fee.

With the release of this consultation paper, it has become apparent that the regulator is seeking changes in line with the mutual fund industry to allow for more transparency in the operations of AIFs. Offering participation in AIFs through direct plans will not only attract more investors but will also help the distributors in the long term by adopting the trail model of commissions that SEBI has proposed.

In the mutual fund industry, Trail Commissions are calculated as a percentage of distributors’ assets under the management. It is generally calculated on a daily basis and paid every quarter. As these are calculated on net assets, distributors gain from the rise in their assets due to higher NAV of funds or the sale of more units. An investor doesn’t need to worry about trail commissions because these are factored into the expense ratio explicitly stated by the funds.

Vivriti Asset Management has adopted the practice of offering direct plans of its schemes with the launch of its Short-Term Bond Fund way back in 2021.

SEBI’s proposal to pay 1/3rd of the (present value of) distribution fee upfront (acknowledging the need for some reasonable incentives) and the rest 2/3rd on trail basis is expected to benefit the industry on a medium to long-term perspective. The proposal is expected to significantly reduce the chances of mis-selling AIF schemes and bring transparency to investors.

b) Conflict of interest

AIFs are allowed to deal with their associates for investing in associates, buying/selling securities to/from, availing services of them, etc. However, such related party transactions could give rise to conflicts of interest. While current regulations already have provisions to address such conflicts of interest, SEBI in the consultation paper has proposed specifically that AIFs cannot undertake such related party transactions without the approval of 75% of investors, calculated by the value of their investment in the AIF, in (a) associates; or (b) units of AIFs managed or sponsored by its Manager, Sponsor or associates of its Manager or Sponsor.

We appreciate the move since the existing industry and regulatory issues around related party transactions will be resolved. The larger point of this proposal is to ensure that investors are not left in a state of oblivion by the asset manager for any investments in bad assets of the associates. We as an asset manager are one step ahead in this regard as we take the consent of our independent board of directors for any such transactions to maintain transparency in our dealing with associates.

2. Transferability – Dematerialisation of units

SEBI noted that despite the regulation of issuance of AIF units in place, most of the AIF scheme units are not yet dematerialised and are held in physical form. Henceforth, the market regulator has proposed that dematerialisation of units of AIFs shall be made mandatory wherein all schemes of AIFs with a corpus of more than INR 500 crores shall compulsorily dematerialise their units by April 1, 2024.

Vivriti Asset Management has always advocated the need for dematerialisation of AIF units in order to create ease in transferability. In a recent note published in Economic Times, we stressed the development of a secondary market for AIF via the listing of fund units. This is essential to ensure liquidity in the AIF industry.

We are already in the process of getting approval for listing units of two of our AIF schemes. In fact, we as an asset manager have facilitated the secondary transfer of AIF units. In the investor contribution agreement, it is stated that the investor can transfer the scheme units to another party with the consent of the investment manager, who needs to know the KYC details of the transferee and the status of the same as a “Qualified Contributor”.

The marketability of any instrument is severely impacted if the instrument is maintained in a physical form. Therefore, it is a crucial step that can promote AIF products and create accessibility to the larger market. It will also enable adequate monitoring of investments in AIFs by investors as they would get higher visibility of cash flow and returns making their decision to sell or transfer units easier. The next logical step in this regard would be the listing of units because dematerialisation would enable the viewing of holding units, but investors won’t be able to trade the units in the open market unless they are listed.


Disclaimer:

The details mentioned above are for information purposes only. The information provided is the basis of our understanding of the applicable laws and is not a legal, tax, financial advice, or opinion and the same subject to change from time to time without intimation to the reader. The reader should independently seek advice from their lawyers/tax advisors in this regard. All liability with respect to actions taken or not taken based on the contents of this site are hereby expressly disclaimed.

DATE
February 13, 2023
PLACE
Mumbai
READING TIME
10 mins

Union Budget and RBI MPC – A roundup of the two key events

The last one week has been extraordinary for the Indian economy and capital markets as they were moved by the Union Budget on Feb 1 and RBI Monetary Policy Committee (MPC) Meeting on Feb 8. Let us look at each of them.

Union Budget FY24

The Union Budget for FY24 was no doubt a balancing act between fiscal prudence and growth. This happens as the domestic economy has been witnessing broad-based recovery post the pandemic amid the slowdown in the global economy.

According to a recent study by IMF, global growth is expected to come down from 3.4% in 2022 to 2.9% in 2023 but it will recover to 3.1% in 2024. However, the slowdown is expected to affect most of the advanced economies compared to the emerging markets and developing economies. India is identified as the bright spot. Along with China, it is projected to account for ~50% of global growth in 2023 compared to just one-tenth for the US and Euro regions combined. Hence, to keep the resilience in domestic demand and retain the ongoing recovery, it is imperative for the govt to focus on growth.

Capital expenditures

Like in previous years, the Centre has resorted to capital expenditures to boost the economy. For FY24, it increased the capital outlay for the third year in a row by 33% to INR 10 lakh crores (which is ~3x the outlay in FY20), accounting for 3.3% of GDP. The budgetary capex is aimed at public infrastructure with roads & highways (INR 2.6 lakh crores), railways (INR 2.4 lakh crores), and defence (INR 1.7 lakh crores) being the top three sector recipients.

The decade-high capex spending along with the extension of a 50-year interest-free loans to states by one more year is expected to have a multiplier effect on economic activities, creating jobs, crowding-in private investment and enhancing growth potential to safeguard the economy against the global headwinds.

Fiscal prudence

The Centre has proposed to reduce the fiscal deficit from 6.4% (RE) in FY23 to 5.9% (BE) in FY24 eventually to sub-4.5% by FY26. The need to kick in the fiscal prudence in the current budget emanated from higher deficits (9.2%) during Covid leading to a rise in debt and interest repayments. The share of interest payments as a percentage of revenue expenditure has, in fact, increased from ~27% in FY20 to ~31% in FY24 (BE).

The government plans to reduce the fiscal deficit in FY24 mainly by lowering the budgeted revenue expenditure (such as by slashing fertiliser and food subsidies by 22% and 31%, respectively) and by the estimated modest growth in tax receipts (10.4% in FY24 over the revised estimate of FY23). If the moderation in inflation continues, the future trajectory of rate hikes could soften aiding stronger economic growth thereby boosting tax revenues.

Government borrowings

The government proposed to finance the fiscal deficit of FY24 with gross market borrowings (done mainly via issuance of bonds or g-secs and the remaining via small securities savings and other sources) of INR 15.4 lakh crores (up ~8% over FY23 (RE)). This came lower than the median of bond market expectations of ~INR 16 lakh crores.

Cues for Alterative Investment Funds (AIFs)

From the perspective of AIF industry, the government has further supported International Financial Services Centre (IFSC) in GIFT City by delegating powers from other regulators to International Financial Services Centres Authority (IFSCA) to avoid dual regulation, introducing a single window approval mechanism, and bringing necessary amendments in the existing tax regime for funds set up in IFSC. This will encourage both the launch of new funds in IFSC as well as the relocation of existing funds to it.

Also, the reduction of the highest surcharge rate from 37% to 25% would be welcomed by individual investors earning interest income through debt funds.


Outcome of RBI MPC Meeting

RBI’s Monetary Policy Committee has hiked the repo rate for the sixth time in a row in a 4:2 majority decision. The key rate at which the central bank lends short-term funds to commercial banks now increased by 25 basis points (bps) to 6.5% while the policy panel retained its focus on the withdrawal of the accommodative policy.

This is the smallest hike by magnitude starting from May 2022. This can be attributed to softening of retail inflation (which fell from the peak of 7.8% in Apr 2022 to 5.7% in Dec 2022) and the US Fed signalling to adopt moderate rate hikes in the near term after announcing their eighth interest rate increase in a year at its first meeting of 2023.

In this fiscal year, the cycle began with a 40 bps hike last May followed by three consecutive hikes of 50 bps and then with 35 bps in Dec 2022. RBI governor Shaktikanta Das in a previous media interaction had said that “High policy rates for a longer duration appear to be a distinct possibility, going forward”.

Inflation

RBI cut its inflation forecast marginally for FY23 from 6.7% in the December meeting to 6.5% currently. The current projection assumed normal monsoon as before and lower prices of crude oil at US$95/barrel than previously.

Inflation for FY24 is projected to be lower than FY23 at 5.3% with 5% during Q1, 5.4% during Q2, 5.4% during Q3, and 5.6% during Q4. Notably, RBI has the mandate to ensure that retail inflation remains at 4% with a margin of 2%.

However, the central bank has noted some stickiness of the core inflation due to an anticipated upward thrust on commodity prices with the easing of Covid-related restrictions and the continued pass-through of input costs to output prices, especially in services. Input cost and output price pressures are expected to soften in the manufacturing sector though.

Growth Forecast

RBI has upped the forecast of real GDP growth for FY23 from 6.8% in its December meeting to 7% currently, attributing the driving factors to private consumption and investment. The forecast for FY24 is pegged at 6.4% with 7.8% in Q1, 6.2% in Q2. 6% in Q3, and 5.8% in Q4.

                                  Movement in Bond Yields

Post-Budget, the bond market calmed due to the downward bias in fiscal deficit projections and lower than expected level of gross market borrowings forecast. This is mainly reflected in the G-Sec and NBFC yields in the above chart. After the repo rate hike decision came in, 3-year G-Sec yields again ticked upward to 7.18% on Feb 8.


Disclaimer:

The views provided in this blog are the personal views of the author and do not necessarily reflect the views of Vivriti. This article is intended for general information only and does not constitute any legal or other advice or suggestion. This article does not constitute an offer or an invitation to make an offer for any investment.  

DATE
February 6, 2023
PLACE
Mumbai
READING TIME
10 mins

Macroeconomic tailwinds to propel growth in private credit investment and AIFs

The supply of credit remains an undeniable catalyst for the growth of the Indian economy. In its journey to becoming a US$5 trillion economy, India requires a credit supply that amounts to ~50% of that targeted economy size. Meeting that supply size could be a daunting task unless private credit markets mature in India. This is because banks and NBFCs have been increasingly shifting their lending mix towards retail over the last few years due to the advent of technology-led lending models as well as risk aversion towards corporate lending.

The perennial need for private credit has already been realized, not only in India but across the world. Globally, private credit accounts for 10-15% of assets under management under private capital, which includes private equity, venture capital, real estate, etc. Post the pandemic, the surge in liquidity in the global market has shifted a lot of investment in private credit towards emerging markets, including India, where it gained major traction due to favourable economic and administrative reforms.

Private credit opportunities in India

The opportunities for private credit in India emanate from structural issues in the debt market. Following the global financial crisis, the banking sector became increasingly risk averse towards the mid-corporate space. Asset managers sharply cut down their allocations to the mid-corporate segment since 2018-19, following defaults by IL&FS, and the freeze of withdrawals in the credit schemes managed by Franklin Templeton. On the other hand, non-bank lenders in corporate lending largely migrated to retail / MSME credit, after facing a liquidity crunch in 2018.  As a result, the mid-market enterprises (comprising privately owned companies majorly located in tier 2/3 cities) have faced a pronounced lack of access to debt.

The opportunities are also arising out of asymmetry in the credit market and mispricing of risks causing much lower growth in lending to companies with a credit rating of A and below compared to the same in the AA and AAA rated universe.

The above factors have resulted in a massive gap in the private credit market and consequently significant opportunities for private credit to grow. With a shortage of liquidity and mispricing of credit, the universe of corporates rated below AA offers rich risk-adjusted returns to discerning lenders.

Shift towards AIFs

When it comes to the type of structure that is needed for the growth in private credit, Alternative Investment Funds (AIFs) fit the bill. The surge in the industry’s commitments raised, which denotes the amount clients are willing to invest in AIFs, in recent years strongly depicts the phenomenon of AIFs playing that vehicle of growth for private credit. Thanks to their flexible structure (with respect to investment in unlisted entities, etc) and regulations supporting the investment vehicle.

AIFs have been able to take care of the supply side for private credit by raising funds from HNIs, family offices, corporate treasuries, and institutions in the domestic market over the last few years. Despite the recent surge in interest rates, the segment still looks attractive.

Performing Credit as a segment within Private Credit

Within the private credit space, India has witnessed the highest attention towards real estate funds, special situation funds, venture debt funds, and distressed funds. While these funds meet the specific needs of the market, these funds typically seek IRRs of more than 16%.

This leaves a large gap in the market, as evidenced in the graph below.

With MFs typically lending at finer rates, and venture/distressed/RE/special situation funds above 16%, the space between 8% – 16% is quite wide open. This space consists of cash flow-based lending to operating companies, focusing on growth, long-term working capital, capital expenditure, etc.

What’s in it for investors?

The above chart depicts that as we move away from AAA to AA rated bonds down to BBB rated companies, a lucrative opportunity for investors exists in a white space, known as the Performing Credit, which lies between mutual funds and distressed debt funds & others at the two extremes. Investment opportunities in this space are expected to go up to $100 billion in the next 3 to 5 years.

The environment for growth in the private credit space including the performing credit is favourable from the demand side. Mid-corporates that are unrated, or rated in the range of BBB and A, are growing well at a pace higher than witnessed by large corporates. Our analysis indicates that 15,000+ such companies exist that are profitable at an OPBITDA level (Operating Profit before Interest, Tax, Depreciation, and Amortisation).

Fresh capital has been drying up due to the tightening of markets. Hence, private credit funds get more advantage to negotiate for higher rates as a provider of scarce capital to enterprises. India’s excellent rating and data coverage offer non-linear opportunities compared to any emerging market. Given these, it is possible to build a truly diversified and stable performing credit portfolio.

Risks in the space

In the private credit space, investors face risks, arising from governance standards, poor disclosures, management capability, operational performance, financial situation, etc. However, with some of the recent regulatory steps and professional fund management, such risks can be mitigated ensuring stability and predictability of returns.

The Insolvency and Bankruptcy Code, enacted in 2016, imparted confidence to lenders about the covenants getting adhered to if the borrowing entity turns insolvent or sick. Secondly, the introduction of the Account Aggregator framework in 2021 created Account Aggregators to act as intermediaries between financial services providers and facilitate sharing of financial information. The framework enabled transparency and the scope for efficient decision-making about borrowing entities. Information asymmetry has been reduced in the recent past with such measures – providing lenders with access to related party information, GST data, bank statements, financial disclosures, etc., for detailed governance checks.

Choosing a highly professional fund manager is extremely useful while investing in the space. Investors should look at fund managers that leave no stone unturned for strict due diligence, comprehensive business monitoring to reduce information asymmetry, excellent sourcing ability, tight quarterly monitoring, and accurate pricing of risks, among several factors.

GIFT City – a new window of opportunity

International Financial Services Centre Authority (IFSCA), the regulator at GIFT City, Gujarat was set up to undertake financial services transactions that are currently carried outside Indian soil by overseas financial institutions and foreign subsidiaries of Indian financial institutions. New regulations issued by IFSCA in April 2022 could aid the next level of growth for private credit funds by providing a framework comparable to Singapore and other global asset management centres for setting up funds.

AIFs set up within IFSC have been granted special dispensations to provide them with higher operational flexibility. The regulatory and tax framework set up within the GIFT City has the potential of unlocking access to large global pools of capital. For meeting a US$ 100 billion need, the infrastructure provided by the GIFT City is much needed for private credit managers to scale and meet the need of the market.


The article has also been published in Mint (Online) on February 4, 2023. You can read it here:

What to expect from the upcoming Union Budget 2023 as an AIF Asset Manager


Disclaimer:

The views provided in this blog are the personal views of the author and do not necessarily reflect the views of Vivriti. This article is intended for general information only and does not constitute any legal or other advice or suggestion. This article does not constitute an offer or an invitation to make an offer for any investment.

DATE
January 30, 2023
PLACE
Mumbai
READING TIME
10 mins

What to expect from the upcoming Union Budget as an AIF Asset Manager

The journey of the Alternative Investment Funds (AIFs) industry in India since the Securities and Exchange Board of India (SEBI) came up with the regulatory framework in 2012 is nothing less than extraordinary. It opened a whole new door to sophisticated investors looking to invest in products other than traditional asset classes and in varied sectors. When it comes to products in the private debt space, the ability of AIFs to go much deeper in the market has attracted a lot of investors’ attention, resulting in deeper segmentation of risk and return in the balance sheets of institutional investors, family offices, and HNIs.

The above factors led the total number of AIF schemes in the country to more than quadruple from 250 in FY18 to over 1,000 in the present financial year. The commitments raised, which denotes the amount clients are willing to invest in AIFs, clocked a 5-year CAGR of ~50% to ~INR 7 lakh crores as of Jun 2022.

Despite the regulatory leeway, more is expected from the governing bodies in the upcoming Union Budget to sustain the interest in AIFs and hasten the pace of its growth. Some clarifications are needed with respect to AIFs set up both domestically and in International Financial Services Centre (IFSC), a specialized designated area in a Special Economic Zone (SEZ) located in GIFT City, Gujarat.

AIFs set up in India are registered under SEBI (AIF) regulations, 2012 and are classified as Category I, II, and III AIFs depending on the investment objective and strategy. These AIFs are considered Indian resident investment vehicles from both exchange control and taxation perspectives. From an Income tax perspective, Category I and II AIFs are accorded a tax pass-through status, whereas Category III AIFs pay tax at the fund level at the maximum marginal rate.

On the other hand, AIFs set up in IFSC are regulated by a unified regulator, International Financial Services Centres Authority (IFSCA) under IFSCA (Fund Management) Regulations, 2022. The Investment Manager in IFSC (called a ‘Fund Management Entity or FME’) is required to obtain an FME license, which is a key distinction between IFSCA and SEBI regulations. Interestingly, AIFs in IFSC are considered non-resident from the standpoint of exchange control, though they continue to be treated as residents from the standpoint of Income tax. These AIFs are also registered as Category I, II, and III AIFs and are intended to be taxed in the same manner as SEBI-regulated AIFs.

Criticality for India’s financial inclusion

India is a country where debt capital markets have not succeeded in replacing banks for critical areas such as project and infrastructure finance, or in developing the mid-market space. Today, the share of sub-AA ratings accounts for sub-5% of bond markets. To correct this, it is essential for the AIF industry to develop as pooled investment products that are the safest and best way to direct household savings to debt capital markets.

Therefore, there is a critical need for the Government and regulators to support and promote AIFs as a path toward financial inclusion and the development of capital markets. Below we discuss suggestions to achieve the same.

Domestic funds under SEBI

  • Regulation of the Asset Manager: Globally, fund managers are regulated by the securities regulator, with requirements of minimum capitalisation, compliance, disclosures as well as corporate governance. This provides more comfort to investors as well as ensures a certain level of quality amongst the players in the market. Given the growing size of the AIF industry, it is about time that asset managers are regulated.
  • Increasing investor participation – Harmonising ticket size of investment: India provides various opportunities for investors to partake in debt or debt-like opportunities. However, the ticket sizes of investments vary. For direct bond investments, the minimum ticket size has been lowered by SEBI to INR 1 lakh recently. For ReITs and InvITs, the minimum ticket sizes stand at INR 50,000 and INR 1 lakh, respectively. For PMS, the same is INR 50 lakhs. However, for AIFs, the minimum ticket size stands at INR 1 crore and INR 25 lakh for an accredited investor. It would be useful to have parity between these options on the basis of risk and return. Pooled investment opportunities with professional managers offer diversification and essentially lower risk – hence, it would stand to reason that the ticket size should be lower than for direct bonds.
  • Accreditation can be transformational: Accreditation of investors has been introduced by SEBI as a way to determine investor maturity and therefore reduce investment ticket size. With the increase in private wealth and the growth of HNIs, it is necessary to provide a significant policy push to this initiative. If accreditation becomes “digital” and hence instantaneously verifiable, the impact on deepening AIF penetration could be transformational.
  • Provide Asset Managers the option to self-select and structure: The Cat I/II/III framework was useful in setting an initial framework for creating the AIF industry. However, the utility has run its course. There is now a need to permit Asset Managers to self-select (one time at the time of fund creation) the fund structure on:
    • Pass through taxation versus fund-level taxation. For fund-level taxation, the tax rate should be in line with that for companies at 25%
    • Leveraging the fund versus not, in line with risk guidelines – e.g., higher leverage allowed for lower risk strategies
    • Open-ended versus close-ended structure
  • Management fee and fund expenses: Management fee and fund expenses are expenses of an AIF incurred exclusively for the purpose of making investments and generating returns for the investors – such as paying the Asset Manager, Auditors, Rating Agencies, etc. Currently, there is a need to clarify that such expenses are tax-deductible when income earned by AIFs is in the nature of investment income (i.e., capital gains or other sources). In the case of Category I and II AIFs, although the management fee is paid out of income earned by investors, it is however not considered tax-deductible by the investment managers for TDS purposes. It will be useful to get clarity in this budget on this matter.
  • GST on Carried interest: The SEBI (AIF) Regulations require an investment manager or their affiliates to act as a ‘sponsor’ and provide a minimum sponsor commitment to ensure a certain ‘skin-in-game.’ Further, an investment manager may be required to contribute alongside the investors as part of commercial arrangements with investors. This results in the locking up of funds for the sponsor as well as carrying risk attached to the investments. To adequately incentivise a sponsor, a carried interest is paid out of the additional returns generated by the investors over and above a certain pre-agreed hurdle rate/ minimum expected return. Carried interest is therefore a return on investment (ROI) allocated to the sponsor and is independent of the fact whether such contribution is made by the fund manager or not. However, following a ruling in 2021 involving various venture capital funds, carried interest was considered neither interest nor ROI but consideration retained by funds/ trusts for the services rendered by them to investors. This gave rise to uncertainties surrounding the taxability of carried interest from a GST perspective. It is therefore crucial that certain clarification is issued to remove the ambiguity around the treatment of carried interest.

Funds under IFSCA

  • Clarity of taxation of IFSCA AIFs: While IFSCA regulations have demarcated AIFs into categories similar to SEBI regulations, there is a lack of a specific tax chapter that deals with IFSCA-incorporated AIFs. Further, as argued above, there is a need to replace the earlier AIF categorisations with a different structure that provides the Asset Manager with the ability to self-select the fund structure and choose appropriate taxation. This is all the more critical for IFSCA AIFs given the much higher complexity of the domicile of intended investors in the AIF.
  • Management of multiple funds: Since IFSC has been demarcated as an SEZ, entities set up there can enjoy 100% tax exemption on business income for 10 consecutive years out of 15 years (aka Tax Holiday). As per 80LA of the IT Act, a certificate of registration is required for each unit with SEZ authorities. However, IFSC recognizes FME as a registered entity operating a single scheme. Thus, to qualify for the Tax Holiday, separate unit registration for funds/ schemes regulated under the IFSCA (FME) Regulations would be required. But in the case of AIFs, separate offices may not be required considering that the funds can be managed from the same office of the investment manager. Therefore, for AIFs, relaxations should be allowed under the IT Act for separate registration of schemes and the SEZ approval process should be removed.
  • Rationalisation of Surcharge rates: There is a discrepancy in the surcharge rate applicable in the case of LLP AIF (which is 12%) and Trust AIF (which is 37%), even though both may be formed for the same purpose. Hence, there should be a consistent surcharge of 12% applied to all IFSC AIFs, irrespective of how they are formed as legal entities.

The above concerns if taken up for resolution in the upcoming Union Budget or near term will not only aid the next level of growth in the AIF asset base but also remove several operational hurdles and the scope of any litigation.


The article has been covered in ET Markets (Online) on January 30, 2023. You can read it here:

What to expect from the upcoming Union Budget 2023 as an AIF Asset Manager


Disclaimer:

The views provided in this blog are the personal views of the author and do not necessarily reflect the views of Vivriti. This article is intended for general information only and does not constitute any legal or other advice or suggestion. This article does not constitute an offer or an invitation to make an offer for any investment.

DATE
January 20, 2023
PLACE
Mumbai
READING TIME
10 mins

Revolutionizing the AIF space

India’s AIF industry has come a long way since its inception a decade ago. What is striking about the industry is its pace of growth. The commitments raised, which denotes amount clients are willing to invest in AIFs, are expected to surpass INR 7 lakh crores within a decade in the Sep 2022 quarter. However, the mutual fund industry, which currently sits with an average AUM of ~INR 40 lakh crores (as of Nov 2022), achieved an AUM of the same level over four decades in mid-2009, after the first scheme (US-64 by UTI) was launched in 1964.
Due to increasing awareness and recognition of AIFs as a preferred alternative investment vehicle, the growth in the number of schemes was phenomenal with new entrants and demand for new schemes. In less than three years, the number of schemes more than doubled from 506 in FY20 to 1019 in FY23 (till Oct ’22).
The major factor that is driving the growth in AIFs is their low correlation to public markets, regulatory support, and their ability to provide a diversified investment portfolio, mitigating the risk profile of investors. Hence, high net-worth individuals (HNIs) and family offices are increasingly preferring AIFs instead of limiting themselves to asset classes like traditional equity and bonds to diversify risk in their portfolio. Higher volatility in the market for traditional investments due to economic consequences of Covid-19, geo-political tensions, and surging inflation have been a major concern. Given these issues, AIFs fit well into the criteria with higher risk-adjusted returns and inflation hedging.

Huge room for growth

Despite the rapid growth in the number of schemes and commitments, the AIF industry is yet to mature to a much larger size given the lesser restrictions it enjoys with respect to investment in the unlisted universe compared to mutual funds and the risk-return spectrum it offers. Its potential to grow can be gauged from its share in the overall asset size of pooled investment vehicles in the country, which is much smaller than what it is in other developed countries.

As evident from the charts, AIFs in developed regions like the US and Europe account for ~30% to ~40% of the asset size of pooled investment vehicles, whereas in India it is only about 15%!

The engines of growth

(i) HNI base

Is there inherent strength to support the growth potential of AIFs in India? There is indeed a significant pool of wealthy individuals who all can be the target group to tap the underpenetrated market. As per a recent report, the number of high net-worth individuals (HNIs), with a net worth of over US$1 million, is expected to nearly double from ~0.8 million in 2021 to ~1.4 million in 2026.

If we compare the CAGR of India’s HNI base with other countries, we found that it exceeds or is equivalent to some of the top economies across the world.
(ii) Accreditation

The Accreditation Investors framework, initiated by SEBI in 2021, holds the key to the paradigm shift in the AIF industry. This is primarily because the market watchdog has allowed Accreditation Investors under the framework to invest with ticket sizes that are lower than the stipulated minimum amount of INR 1 crore. The premise of the framework is based on a class of investors, who are equipped with good knowledge about the risk and returns of financial products, have the ability to make informed decisions about their investments, and meet certain income eligibility criteria.

Certificates for Accredited Investors would be provided by Accreditation Agencies, which can be subsidiaries of stock exchanges or depositories (National Securities Depository Limited or Central Depository Services Limited) or any other institution that meets the eligibility criteria.

The relaxed criteria in minimum investment will be able to unlock the potential of the AIF industry by enabling investors to enter the market who were previously backing off due to higher ticket sizes. The widening of the investor base, for instance, can be gauged from that of the size of the market for Portfolio Management Services (PMS), which requires a minimum investment of INR 50 lakhs per investor.

The investor base of PMS was ~1.4 lakh as of Oct 2022. Hence, given the fact that there could be 15,000 to 20,000 unique investors across all AIFs registered with SEBI, and considering the PMS base, we are looking at growth in the AIF base, which is 7-9x the current size for the near term.

(iii) Digitisation

Some mutual funds have a fully digitised onboarding process which allows seamless transaction processing with minimal Turnaround Time (TAT). Given the potential growth of AIFs due to the inclusion of smaller ticket size investors with an Accredited Investor framework, there is a need for digitising the onboarding process for AIFs.

We suggest Accreditation Agencies to consider building a digital infrastructure for AIFs for the onboarding process that would

  • Reduce TAT to issue Accredited Investor certificate to the minimum, and
  • Remove any back and forth between investors and Accreditation Agencies by providing a standardised format of the NW certificate.

(iv) Listing of fund units

The development of a secondary market for AIFs is essential to ensure liquidity in the AIF industry. As per Section 14 of SEBI’s AIF regulations, units of close-ended AIFs may be listed on a stock exchange subject to a minimum tradable lot of INR 1 crore, after the final close of the scheme. However, we are not aware of any AIFs listing their units till date.

The listing of AIF units would

  • Ensure liquidity by allowing investors an easy exit opportunity (subject to KYC) due to dematerialisation and enabling price discovery in a demand-supply mechanism.
  • Create a more enabling environment for Pension Funds, which are more inclined to investing in listed securities according to PFRDA guidelines, to invest in AIF units.

In this regard, clear operational guidelines should also be established by the regulator with respect to standardisation of contribution agreements, handling of fractionalised units, tradable lot sizes for Accredited Investors, and involvement of merchant bankers in the listing process.


The article has been covered in ET Prime on January 20, 2023. You can read it in the below mentioned link

Thinking beyond traditional investments: here’s what could revolutionise AIFs

Disclaimer:

The views provided in this blog are the personal views of the author and do not necessarily reflect the views of Vivriti. This article is intended for general information only and does not constitute any legal or other advice or suggestion. This article does not constitute an offer or an invitation to make an offer for any investment.  

DATE
November 14, 2022
PLACE
Mumbai
READING TIME
10 mins

COP 27 Climate Summit: What’s next for the Clean Energy Financing in India (A note)

As about 190 countries gather during the 27th Conference of Parties or COP27, Climate Summit by the United Nations (UN) at Sharm el-Sheikh, Egypt, the agenda of clean energy financing steals the limelight again on the global stage. The parties to the UN convention are required to present their progress towards the ambitions to cut the emission of greenhouse gases like carbon dioxide and agree on new treaties and measures to achieve the targets.

The concerns for climate change are undoubtedly alarming. Recent reports suggest that not enough has been done to avert a climate crisis. The World Meteorological Organization (WMO) revealed at the beginning of this year’s summit that the last eight years have been the hottest on record while the rate of increase in the sea level has doubled since 1993 with the last two and half year’s accounting for 10% of the overall rise.

The Intergovernmental Panel on Climate Change — a scientific group created by the UN to monitor and assess global sciences related to climate change — warned that global warming over pre-industrial era levels was inching close to 1.5 degrees Celsius (currently 1.15 degrees Celsius as per WMO estimates) and the warming at and beyond this level could wreak havoc on some of our ecosystems.

Member states have stressed boosting the global ambitions significantly to meet the 1.5°C objectives. They identified that Nationally Determined Contributions (NDCs) submitted by nations (done every five years like 2020, 2025, 2030, etc) outlining the plan to mitigate climate change and their updates as insufficient and, hence, need to be strengthened during COP27.

India’s updated NDC included measures such as cutting the carbon emissions per unit of GDP and lowering the use of fossil fuels to generate electricity. At COP27, Indian negotiators stated that meeting the long-term goal of the Paris Agreement “requires phase down of all fossil fuels” by countries.

At the COP26 Summit in Glasgow in 2021, PM Modi proposed the vision of “LiFE – Lifestyle for Environment”, which suggested that the “consumption pattern of the world is mindless and pays scant regard to the environment”. It called for a change in the people’s mindset from ‘use and throw’ to ‘reduce, reuse and recycle’.

Climate Financing Target

The UN has identified financial resources and investments as keys to addressing climate change issues that range from emissions reduction, adaptation to the already occurring impacts, and building resilience. At the COP15 in 2009, the developed countries committed to providing $100 billion in assistance per year to developing countries for climate reforms by 2020. The funding was supposed to be drawn from public, private, and alternative sources of financing. However, wealthy nations have failed to reach their targets. For instance, Asia received only ~25% of global climate finance despite being home to ~60% of the world’s population. The question arises is $100 billion per year enough to act on the climate action pledges?

As per a report by the New Climate Economy — a flagship project of the Global Commission on the Economy and Climate — effective climate actions can result in $26 trillion worth of economic benefits for the globe by 2030. However, the benefits of that gigantic size cannot be achieved with an annual investment of $100 billion. The report by the United Nations Environment Programme stated that developing countries need annual adaptation (refers to adjustments in ecological, social, or economic systems in response to climate change impacts) support of $160 billion to $340 billion by 2030 and $315 billion to $565 billion by 2050.

Taking account of these factors, developing countries including India have asked for a new global climate finance target by 2024, known as the new collective quantified goal (NCGQ). As per estimates, the Global South/less-developed nations are spending 5x more on debt repayments than on climate change spending. Hence, in NCGQ, which is expected to be finalized by 2024, developing nations are seeking funding in trillions to implement the Paris Agreement. At the same time, they are looking at alternative sources of financing beyond conventional sources of loans and grants.

India’s stance and the significance of alternative sources of financing

The government of India set a target to achieve renewable energy (RE) capacity of 175 GW in India (excluding large hydro projects), which would include 100 GW of solar energy, 60 GW of wind energy, and 15 GW via small hydro projects, biomass projects and other renewable technologies by Dec 2022. Till Jun 2022, ~114 GW of RE capacity has been installed in India, as per information provided by the Ministry of New and Renewable Energy (MNRE). The remaining targeted capacity of ~61 GW is under various stages of implementation. Also, under the Paris Agreement goal, the government of India is also committed to generating 50% of installed energy capacity from non-fossil fuel sources by 2030.

To achieve the ambitious target, investment in the sector needs to be scaled up significantly. As per MNRE, India would need an investment of US$18-24 billion annually for its long-term commitments in the RE space. However, estimated annual investments in the sector in the last few years have been in the range of US$9 billion only, which implies a huge gap between the required and actual investment.

Achieving an investment target of this enormous size could be a daunting task unless new investor classes are tapped via the debt market since 70% of funds in RE projects are sourced via debt. Although established companies are able to get success in financing, other players, which are mainly MSMEs, smaller energy service companies, and unlisted, and lower-rated companies face difficulties in raising finances from capital markets despite having a sound business model. Further, new technologies require a higher risk appetite from debt investors that the mainstream market finds difficult to provide.

Such a barrier to clean energy financing can only be solved via alternative sources of financing like Alternative Investment Funds which can pool together commercial and impact capital, and especially lock in large international pools of capital. Such Alternative Investment Funds help RE players get access to early stage/construction financing, as well as affordable capital for project finance.

Due to increasing energy demand in India led by strong economic growth, capacity additions in the renewable energy space needs to accelerate at a faster pace. After a hiatus due to Covid, investments in the sector more than doubled in FY22 over FY21. Thanks to the rising participation of several private players including the behemoths like Reliance and Adani and a steady increase in FDI inflow, driven by growing commitments to meet clean energy targets under the Paris agreement, and an increasing pool of impact investors.

India has overshot its commitment made at COP21 by achieving 40% of its power capacity from non-fossil fuels about 9 years before time with phenomenal growth in the share of solar and wind in the overall energy mix. Unit economics have been improving due to technological developments, increasing awareness, and strong support from both the public and the private sectors. The next level of growth is expected to get boosted due to emerging technologies such as hydrogen, battery storage, low-carbon steel, et al.

Disclaimer:

The views provided in this blog are the personal views of the author and do not necessarily reflect the views of Vivriti. This article is intended for general information only and does not constitute any legal or other advice or suggestion. This article does not constitute an offer or an invitation to make an offer for any investment.  

DATE
November 2, 2022
PLACE
Mumbai
READING TIME
10 mins

Clean Energy Financing in India: Opportunities, Challenges, and the Role of AIFs (PART II)

Right from creating a dedicated financial institution in the late 1980s to rolling out incentive schemes in the early 1990s, the govt has provided several avenues for clean energy financing in India. This apart, alternative funding avenues are created for the sector in the form of mechanisms like the National Clean Energy and Environment Fund (NCEEF) and instruments like green bonds and renewable energy certificates. Below we discuss some of the operational sources and schemes of financing in the sector and the challenges faced by them.

Avenues of clean energy financing and incentive schemes in India

1. Public financing

The Centre created a dedicated financial institution called the Indian Renewable Energy Development Agency Limited (IREDA) under MNRE in 1987 to provide financial aid such as soft loans, counter guarantees, and securitization of future cash flows to RE projects in India. However, as per a report by the Asian Development Bank Institute (ADBI), 2018, IREDA loans reportedly suffer a delay in sanctioning loans.

Apart from IREDA, state-run organizations like the Power Finance Corporation (PFC), Rural Electrification Corporation (REC), and National Bank for Agricultural and Rural Development (NABARD) provide finance to the RE sector.

 (i) Bank Priority Sector Lending (PSL)

In 2015, RBI has included RE financing under the ambit of PSL, which is aimed at boosting employability, building basic infrastructure, and strengthening the competitiveness of the economy. The central bank has kept the loan ceiling of INR 30 crores per borrower for RE projects. However, the ADBI report pointed out that the financing flow to RE under PSL has not been turning out as expected. One reason for the shortfall is the inclusion of RE under the broader umbrella of energy causing a flow of credit to non-RE sectors.

 (ii) Green Banks

Green Banks are conceptualized as a tool to accelerate clean energy financing. The first green banking initiative was undertaken by IREDA in 2016 to mobilize private funds to meet green energy targets. However, the idea has not yet taken off in India as it did abroad in countries like Japan, Australia, Switzerland, and the UK with a goal to facilitate the financing of clean energy projects at a cheaper rate. This could be attributed to the lack of mechanisms to recognize such institutions in India.

2. Green bonds

Funds raised via Green or Masala bonds are invested in green or RE projects. The tenure of green bonds in India ranges between 18 months and 30 months and they are issued for a period of up to 10 years.

India is the second country after China to have regularity guidelines formulated by SEBI for green bond issuances. They can be issued by the govt, multilateral organisations (such as ADB, the World Bank, etc), financial institutions, and corporates. They are increasingly being issued in India (listed either/both domestically and internationally). For example, SBI, India’s largest public sector lender, has launched dual listed green bonds worth US$650 million on the India International Exchange (India INX) and Luxembourg Stock Exchange. The size of total green bond issuances in India stood at ~US$7 billion in 2021. However, the issue size comprises less than 1% of the domestic bond market.

Despite creating a conducive environment, green bond issuances are yet to be a success in India because their acceptance largely depends on the risk perception of the investors. The riskiness of these bonds is similar to other bonds. They are required to be rated to attract institutional financing. The perceived risk of investment in such bonds becomes higher as some investors fear funds garnered via these bonds may not be utilized for the purpose for which they are issued. Secondly, there is an inclination of investors toward higher-rated issuers creating an asymmetry in the market.

3. Incentive schemes

Public financing in the sector also goes as support funding to incentivize the flow of private capital into the sector and tends to work as an enabling framework with a perception that the private investors have the potential to fund clean energy projects. Some of the incentive schemes rolled out for the RE sector include

  • Accelerated Depreciation: The AD scheme, introduced in 2009, incentivize investors by relaxing their tax liability on the investment. It allows depreciation of investment in assets like a solar power plant at a much higher rate than general fixed assets so that tax benefits can be claimed on the value depreciated in a given year. The scheme was withdrawn in 2012 and reinstated in 2014.
  • Generation-based incentive: The GBI scheme offers an incentive per kWh of energy generation in solar and wind projects. The primary intention of this scheme is to promote renewable power generation rather than only setting up RE projects. This scheme was later withdrawn mostly for utility-scale projects due to the fast growth of the RE market that resulted in near parity of RE tariffs with thermal power tariffs.
  • Viability Gap Funding: VGF is a type of smart incentive scheme to finance economically justifiable infrastructural projects. It is provided as a one-time grant by the govt to make projects commercially viable and has been used by the Solar Energy Corporation of India (SECI) to promote solar energy.

Apart from these incentive schemes, policy instruments that exist in India to push India’s RE sector include renewable portfolio obligations (RPO), renewable energy certificates (REC), and feed in-tariff (FiT) schemes.

4. Foreign equity

Globally, there is strong momentum in capital flow to the energy sector away from coal and coal-fired power generation in the last few years. Over the 12 years, the cumulative FDI inflow to India’s RE sector stood at ~US$12bn. Currently, 100% FDI is allowed in the RE sector under the automatic route that needs no prior approvals. Here’s how the FDI flow took place in the last five years —

The steady increase in FDI inflow, except in the year of Covid’s first wave, is driven by growing commitments to meet clean energy targets under the Paris agreement and an increasing pool of Impact Investors, who are keen on aligning their investment goals to UN Sustainable Development Goals by 2030. However, India is yet to attract a larger flow of foreign capital to clean energy as the domestic flow still dominates about 80% of the overall finance flows.

Lt Col Monish Ahuja, Chairman & MD of Mumbai-based Punjab Renewable Energy Systems, a provider of bioenergy and biomass solutions, expects India to become a sweet spot for global investments in the RE space. However, he believes, achieving the 2030 RE targets could be a tough ask as the investment hurdle rates required are very high unless concerted efforts are made to create a more friendly investment environment in order to access the vast pool of global capital towards sustainable ESG compliant RE businesses, including Biomass-Bioenergy, Green Hydrogen, et al.

Ahuja further added, “smaller players need to tie up and align themselves with the strategies of larger global players interested to invest in India. This will enable them to be backed by corporate guarantees / structured finance of the large balance sheet from these larger global players. Secondly, smaller players have to collaborate and come together under government programs where they can increase their bargaining power on a collective basis. Industry bodies like the Confederation of Biomass Energy Industry of India and CLEAN, a non-profit organization committed to supporting, unifying, and growing clean energy enterprises, are diligently working towards making capital accessible to the stakeholders.”

Role of Alternative Investment Funds (AIFs)

As per a study by the International Finance Corporation, India would need US$450bn in financing to meet its clean energy targets by 2030. Assuming a debt-equity split of 70-30, this means ~US$315bn has to come from the debt market. Accumulating financing of such an enormous size could be a daunting task unless new investor classes are tapped in and capital in existing projects is recycled.

However, small and medium RE project developers do not get the right access to the bond market due to the skewness of the market appetite towards G-sec and higher-rated corporate bond issuers, as discussed in the section ‘Asymmetry in debt financing’ in Part I. This creates a barrier to clean energy financing, particularly in the short to medium term. In such a scenario, AIFs fit in, not only because it provides short-medium term access to the capital market, but also due to the fact that they can

  • Invest in start-ups or unlisted securities and adopt complex trading/leveraging strategies unlike other investment vehicles like mutual funds.
  • Help crowding in many institutional investors for a single project due to diversification limits set by SEBI (Cat I and Cat II AIFs are not permitted to invest more than 25% of their funds in a single investee firm while, for Cat III, the limit is 10%).
  • Enhance the credit rating of bond issuance by using structured finance, where the AIF sponsor could provide a partial credit guarantee using a subordination/waterfall structure and customized periodic cashflows.
  • Enable private credit towards financing segments of the market such as Commercial & Industrial RE, hybrid technologies, EV network financing, etc where banks aren’t highly active yet.
  • Finance standalone mid-sized projects without relying on sponsor support.

This way AIFs can enable RE developers to reduce their cost of capital and help them repay loans taken from banks/NBFCs using the proceeds from bond issuances. On the other hand, investors are assured of coupon payments as they are backed by cash flows from stable and operational projects.

The emergence of more and more AIFs in the clean energy space would increase the confidence of investors in the sector by helping them undertake calculated risks, invest for impact, and giving exposure to complex and new clean energy tech. On the other hand, it will help RE entities, which are so far reliant on few lenders like IREDA, REC and PSU banks, achieve diversification in the borrowing mix.

Disclaimer:

The views provided in this blog are the personal views of the author and do not necessarily reflect the views of Vivriti. This article is intended for general information only and does not constitute any legal or other advice or suggestion. This article does not constitute an offer or an invitation to make an offer for any investment.  

DATE
October 13, 2022
PLACE
Mumbai
READING TIME
10 mins

Clean Energy Financing in India: Opportunities, Challenges, and the Role of AIFs (PART I)

The global oil crisis in the 1970s and 1980s led to the genesis of renewable energy (RE) development in India similar to other parts of the world where research into alternative energy technologies such as wind turbines, solar panels, etc. began during the same time. The shortage in oil supply caused its prices to skyrocket from ~US$3/barrel in 1972 to ~US$35/barrel in 1980. Supply-related uncertainties and the adverse impact on the balance of payments due to drastic price increases led India to establish the Commission for Additional Sources of Energy (CASE) in the Department of Science & Technology in March 1981. In 1982, India created the Department of Non-conventional Energy Sources (DNES), that incorporated CASE. A decade later, India became one of the first countries to set up a Ministry of Non-conventional Energy Resources (by converting DNES), which was rechristened in 2006 as the Ministry of New and Renewable Energy (MNRE).

Amid the decades-long dependence on conventional sources of energy (mainly coal), the contribution of renewable sources to the overall energy mix in India started increasing at a fast pace in the last decade as depicted in the below charts. Thanks to various state and central incentives due to the increasing focus on reduction in CO2 emissions and concerns for global warming.

If we consider the energy mix within the renewable sector (by generation) this is how it looks
Back in 2014, the government of India set a target to achieve an RE capacity of 175 GW in India (excluding large hydro projects), which would include 100 GW of solar energy, 60 GW of wind energy, and 15 GW via small hydro projects, biomass projects and other renewable technologies by Dec 2022. Till Jun 2022, ~114 GW of RE capacity has been installed in India, as per information provided by MNRE to the Parliament. The remaining targeted capacity of ~61 GW is under various stages of implementation.

Under the Paris Agreement goal, the government of India is also committed to generating 50% of installed energy capacity from non-fossil fuel sources by 2030. India has set a long-term goal to reach ‘net zero’ by 2070.

Investment gap

Meeting the transformative goal in RE capacity calls for a significant investment in the sector. As per MNRE, India would need an investment of INR 1.5-2 lakh crore annually for its long-term commitments in the RE space. However, estimated annual investments in the sector in the last few years have been in the range of INR 75,000 crores only, which implies a huge gap between the required and actual investment. But recent trends in RE investment look promising!

Currently, India devotes ~3% of its GDP to investments in energy. Due to the rise in commitments from corporates, banks, and financial institutions to increase non-fossil fuel investments, the share of RE investments has been going up in the overall mix.

Investments in FY21 dipped ~24% due to the fall in energy demand amid the nationwide lockdown. However, as the demand revived, investment jumped 125% from FY21 and ~71% from the pre-pandemic level (FY20) in FY22.

The asymmetry in debt financing

PSUs play a dominant role when it comes to the financing of energy in India. However, a substantial amount of finance from govt-owned financial institutions flows into conventional sources of energy instead of RE. This is because over 50% of conventional power generation capacity is under the direct ownership of central and state governments. Hence, the onus to arrange finance of energy capital and development of RE capacity falls on the private sector.

Some of the biggest private sector players have already embarked on a massive clean energy journey. Reliance Industries has announced a target to reach net-zero carbon by 2035 and is investing over US$10 billion (INR 75,000 crore). Adani Green, the largest renewable company in India by market capitalization and the top project developer in solar and wind, with a portfolio of ~14,000 MW, announced debt financing of over INR 10,000 crores till Mar 2021 for its RE projects. Other key players in the sector include Tata Power (one of the highest revenue earners in the industry) and ReNew Power.

Among the state-run players, NTPC is a notable example of business diversification. The company is following a target of 60 GW of net renewable energy capacity by 2032. Coal India is also considering building capacity for solar wafer manufacturing.

On an overall basis, the clean energy sector still lacks scale and diversified access to financing. Although established companies like Reliance, Adani, and Tata are able to get success in financing being behemoths, other players, which are mainly MSMEs, smaller energy service companies (ESCOs), and other unlisted and lower-rated companies face difficulties in raising finances from capital markets despite having a sound business model or meeting financial benchmarks like the minimum debt-service coverage ratio or DSCR (the ratio of net operating income to current debt obligations) requirements.

However, “small and medium enterprises are going to be crucial to the growth of the RE sector”, said Saurabh Marda, the Managing Director of Hyderabad-based Freyr Energy, which provides rooftop solar solutions for residential and commercial customers. Marda added, “Most of these companies operate on an asset-light model and one of the things holding back their growth is the ability to finance projects. Most traditional lenders ask for collateral that is not feasible beyond a point. Another gap is that most lenders even today do not understand solar as an asset class, especially at the branch level. If this understanding improves and lenders start looking at solar project financing or discounting cash flows from solar customers, the overall financing situation can improve”.

The financing pattern of RE projects is such that 70% of funds are sourced from debt and the rest 30% are mobilized as equity funding. Sadly, the debt servicing costs of renewable energy projects in India are 20%-30% higher than in the US and Europe (calculated on Levelized cost of energy). The banking sector also depicts some level of reluctance while lending to smaller players due to its perceptions of associated risks and uncertainties with RE projects of such players.

When it comes to the financing of greenfield RE projects by banks and NBFCs, the following are the characteristics (IEA, CEEW, Dec 2021) noted in RE loans (the terms vary with the level of the project’s riskiness): —

  • Long-tenure and floating-rate debt with periodic reset clauses
  • A moratorium period of up to one year after the project’s scheduled commissioning date
  • Debt-service reserve account (DSRA), a cash reserve set aside to meet debt-servicing requirements for a period, requirements of typically one to two quarters
  • Minimum DSCR of 1.1

The cost of debt comprises the internal benchmark rates (based on the marginal cost of lending rate for banks and the prime lending rate for NBFCs) and the spreads over them. The spreads component is determined by the creditworthiness of the power offtaker (which are electricity distribution companies or discoms), the type of project site, the creditworthiness of the sponsor, and any additional corporate guarantees. For example, if the project is set up on a solar park site, its borrowing costs become ~25 basis points (bps) lower than the one set up on a non-solar park site. If the developer has signed a PPA with a highly leveraged state discom, it could add up to 50 bps in borrowing costs compared to a PPA signed with a central govt entity or a low-leveraged state discom. The below chart depicts how the cost of debt for developers varies as per the determinants.

In the next post, we will discuss what are the avenues of financing for clean energy projects in India, both domestically and internationally, and how AIFs fit well in mending the financing gap.

Disclaimer:

The views provided in this blog are the personal views of the author and do not necessarily reflect the views of Vivriti. This article is intended for general information only and does not constitute any legal or other advice or suggestion. This article does not constitute an offer or an invitation to make an offer for any investment.  

DATE
September 15, 2022
PLACE
Mumbai
READING TIME
10 mins

Looking at Performing Credit amid the funding winter in India

The venture capital (VC) funding, provided to emerging enterprises in return for an equity stake, seems to have entered the winter. Things have started going downhill lately due to adverse macroeconomic scenarios led by geopolitical tensions, low anticipated growth, and rising interest rates amid multi-year high inflation. Many VC firms have reportedly asked their portfolio companies to cut costs and revise budgets and projections to adapt to the funding winter. Some firms even believe the situation is worse than the first wave of Covid when ultra-loose monetary policies adopted by central banks and expansionary fiscal policies by governments supported the market.

The chilling effect on the VC funding has set in from the third quarter of CY21 as evident in the chart below —

If we examine the nature of the decline in VC funding in the recent past, we see that late-stage funding has hit the most while early-stage funding has more or less retained the momentum. This is because the crossover funds, which invest in both publicly traded and privately held companies, comprise a significant part of late & growth stage deals and turned their back from making new large bets in the private market.
The rise in Venture Debt

As VC funding is drying up, emerging enterprises and start-ups are increasingly shifting towards non-equity-based funding, in other words, debt. Talking about debt, it could be available from banks, however, that is an option mired with difficulties such as placing collaterals or pledging shares against the loan. Moreover, bank loans tend to be standardised with repayment schedules not matching the underlying cash flows generated by the entity’s business. In such a situation, Venture Debt (VD) becomes an alternative, however again, that is an option, whose terms are not entirely based on debt and include an equity component.

VD is a type of loan offered to early-stage, high-growth companies, which are already backed by VC firms. The VD deals are structured to include an equity component, aka “equity kicker”, which is there in the form of warrants, preference shares, rights, or options. Equity kickers serve to sweeten the deal and provide returns over and above the fixed income portion of the deal.

VD can be done by dedicated VD funds. The factors which make VD favourable are

  • It can be offered to companies that may not be cash flow positive yet
  • It can be provided to companies without existing collateral
  • It does not require a valuation to be set for the business
  • It gives way to less dilution for existing shareholders compared to VC funding as explained below

With gradual awareness, VD funding picked up in India over the last 5-6 years and has become a popular route for emerging enterprises to raise capital without diluting equity. The first VD that entered India was SVB India Finance, which started lending in 2008 and rebranded as Innoven Capital in 2015 when Temasek Holdings acquired the firm from Silicon Valley Bank. Since then, the VD market has been dominated by players like Trifecta Capital, Alteria Capital, and Stride Ventures apart from Innoven.
Despite a gain in momentum, VD investments still account for ~2% of the size of VC investments in India, a share which is ~20% in the US. A venture debt deal runs for 2-3 years whereas a VD fund has a life of 7-8 years allowing them to recycle capital at a much higher pace.

Performing Credit – white space in the Indian debt market

As we move away from AAA to AA rated bonds down to BBB rated companies, a lucrative opportunity for investors exists in a white space, known as the Performing Credit (PC), that exists between mutual funds and distressed debt funds & others at the two extremes. To better understand the depth and coverage of the market let’s see how the market players are positioned given their yield and ratings.

The range of up to 8% is mostly covered by mutual funds. The portfolios operating in this range are disproportionately skewed towards safety due to risk parameters set by SEBI and low liquidity risk on account of being open-ended vehicles. At the other extreme, there are Venture, Distressed Debt, and Real Estate funds operating in the above-16% yield range.

Profitability

PC space consists of papers issued by rated and stable companies which are undiscovered and yield high risk-adjusted returns. These are the companies that are operating mature and established business models with steady cash flows. Over and above, as the below chart suggests, over 90% of these companies in any rating bracket are EBITDA positive (in FY21).

Further, the overall credit performance of the rated universe, including the Performing Credit space, has been improving since FY21 as depicted in the trend in Credit Ratio (upgrades to downgrades) below —
The above chart indicates that the credit ratio improved to over 5x in the second half of FY22 compared to under 3x in the first half of FY22.

However, when we analysed ~80 VD investee portfolio companies we found that they are largely EBITDA negative with limited ability to throw cashflows.

Asset quality

The VD portfolio comprises companies that are typically unrated unlike the companies in the PC space. This could make the asset quality in the VD universe inferior, although VD investors have lately been considering the underlying business model, path to profitability, positive unit metrics, and longer runways for evaluating their investment decisions.

The asset quality in the PC space can be evaluated by plotting default rates across the rating scale and comparing them with respective yield spreads over 3-year G-sec.

The above chart depicts that the premium of return over risk till BBB, which is the space including PC investee companies, increased disproportionately. However, if the VD companies are ever rated, they would possibly lie in the BB and below bracket since they have unproven business models, lower vintage, mostly negative EBITDA, implying a higher risk on even principal repayments.

Apart from the asset quality, investors in VD funds need to look at the pricing of future rounds of VC investment, which determines the upside potential to overall returns. VD funds fundamentally rely on VCs to price the investee companies fairly, which enhances the value of the equity kicker. If they are not, the value of the equity kicker gets affected thereby affecting the overall returns from the fund. However, the returns from funds in the PC space are predictable as they are entirely dependent on returns from debt instruments making the risk-return spectrum not as distorted as VD funds.

Note:Excerpts from this article have been published on the 12th of Sep 2022 edition of LiveMint. To read it, please click here

Disclaimer:The views provided in this blog are the personal views of the author and do not necessarily reflect the views of Vivriti. This article is intended for general information only and does not constitute any legal or other advice or suggestion. This article does not constitute an offer or an invitation to make an offer for any investment.  

DATE
September 5, 2022
PLACE
Mumbai
READING TIME
10 mins

How far the new MFI regulations have been implemented in India – A closer look

It’s been over five months since RBI has come up with the new regulatory framework for microfinance (MFI) loans. With respect to financial and operational standpoints, NBFC-MFIs faced several headwinds, particularly after Covid-19, with escalated credit costs being one of the challenges.

The revised guidelines were earlier made effective from Apr 1, 2022. But later the effective date was extended to Oct 1, 2022, when some regulated entities (REs) notified RBI about difficulties with respect to their implementation.

The new guidelines are expected to have a positive impact on the NBFC-MFI sector. They are applied to all commercial banks (excluding payment banks), primary/state/district central co-operative banks, and NBFCs, including MFI and housing finance companies (HFCs).

However, to what extent the new guidelines have been implemented, and how far they are adopted? Vivriti Asset Management has spoken with 14 NBFC-MFIs across India to find that out. Let’s take a dig at some of the parameters of the new regulatory framework to examine and evaluate their responses.

1) Definition of MFI loans/Qualifying asset

As per earlier regulations, loans were classified as ‘qualifying asset’ in the NBFC-MFI framework if it meets some of the following criteria

Indian MFIs have long been in discussion with the Reserve Bank of India (RBI) to raise the limit of inflation-adjusted household income for taking loans to INR 3 lakhs/year to widen the scope of eligible borrowers. It has been estimated that the hike would add ~5 crore MFI customers to the current count of ~6cr.

Implementation and implications

Considering indebtedness at a household level is a welcome move for the industry, in the long run, and so is the hike in the cap for annual household income for qualifying assets, which is expected to increase the market size for MFIs. Let us examine these two aspects one by one:

(i) Ascertaining the household income

Upon interacting with 14 NBFCs across India, it is revealed that their field staff has started capturing the source of income of each member of the household. The assessment is done via discussion with the entire household.

We believe assessing the income of an MFI borrower/household is a challenging task as the majority of the income is unorganised, seasonal, and earned in cash and most of the MFIs will gravitate towards self-declaration. This results in a mismatch in the evaluation of the level of household income by different entities. For example, the household whose income level is determined as less than INR 3 lakhs by an MFI could be determined as more than INR 3 lakhs by an NBFC leaving no standard data points of reference.

As per the latest Consumer Pyramids Household Survey by CMIE, Indian households are divided into five income classes where the INR 2 lakhs-5 lakhs bracket comprises the majority of households, a share which rose from ~33% last year to ~50% recently.

(ii) Ascertaining household indebtedness

When it comes to loan obligations, a few conservative MFIs have set internal fixed obligations to income ratio (FOIR) thresholds of 40%-45% for the households. For monthly loan obligations, bureau checks are being carried out on the entire household. The issue is that monthly EMIs are only available for MFI loans and not all retail loans. Very few MFIs have designed EMI calculators to compute EMI based on the total outstanding and tenor of the loan. Most MFIs are considering the EMIs based on a discussion with the borrower/bank pay-outs. For loans such as gold loans/Kissan Credit Card loans, most MFIs are not considering them for computing indebtedness. Some MFIs are also considering the indebtedness only on account of self-declaration.

In order to assess indebtedness at a household level accurately, credit bureaus will take roughly 3-6 months to report EMIs of all outstanding facilities of the household. System alignment will take time. Originations will have a dual reporting mode, both manual and system-driven, resulting in higher oversight by the operations/credit team in MFIs.

Further, in the near term, MFIs will see higher rejections on account of bureau-linked indebtedness levels, overdue loans of spouses or children, and incorrect information being captured by field staff.

Overall, the TAT to onboard a client has increased by 1-2 days since verifying indebtedness levels and FOIR for the household is taking time and customer eligibility is now known at the head office instead of the tab instantaneously under the previous regime for some MFIs. The delay will result in higher operating expenses along with an increase in the cost of the bureau in the near term. In order to adhere to the guidelines, most MFIs are taking self-declaration of household income and of household indebtedness.

Given the varied practices adopted by MFIs for assessing and onboarding a borrower due to regulatory interpretation, there is potentially less homogeneity among players, making benchmarking between companies more arduous in times to come.

2) Minimum tenor and ticket size of loans

Earlier there were thresholds placed on NBFC-MFIs with respect to the minimum tenure, which is 24 months for loan amounts exceeding INR 30,000. No such thresholds exist in the new regulation. However, our survey revealed that despite the removal of the thresholds, many MFI lenders continue to have an internal threshold on ticket size based on credit quality and the cycle of customers. We believe these internal caps on ticket size by MFIs are conservative and necessary.

3) Minimum requirement for MFI loan mix

For entities to qualify as an NBFC license, RBI earlier required NBFC-MFIs to have at least 85% of their net assets in qualifying assets. Under the new regulation, the minimum requirement was modified to 75% of total assets, which includes cash and other assets. The inclusion of total assets instead of net assets expects to put higher stress on the liquidity of NBFC-MFIs. As a result, entities that had a higher mix of non-microfinance loans as of Mar 2022 and entities that had maintained higher liquidity are (a) reducing higher liquidity buffers, (b) reducing the extent of loan write-offs (c) and pausing disbursements of non-MFI loans till the mix of microfinance loan increases.

4) Pricing of loans

(i) Interest rates

Earlier, RBI has stipulated the interest rates that are to be charged by NBFC-MFIs in a manner that is lower of

a. Cost of funds + 10% — for entities with an outstanding portfolio of greater than 100 crores — and 12% for Others,

OR

b. 2.75x of the average base rate of the five largest commercial banks

Over the last two fiscal years, NBFC-MFIs began facing a rise in annual credit cost by 2%-4% (compared to ~1% at the pre-pandemic level) due to the pandemic-related provisioning and the increased stress on the restructured book. Problems emerged when banks started reducing their interest rates with the easing monetary policy leading to a fall in the Base Rate (the minimum rate set by RBI below which banks are not allowed to lend). This led the interest rates to be set as per criteria (ii) above, the trajectory of which has been shown below

The falling interest rates posed a problem for small to medium players/lower-rated entities due to higher pressure on their margins/spreads given the interest cap by RBI. However, the margin pressure for the large NBFC-MFIs was not as severe as small/medium players as the cost of borrowing of large NBFC-MFIs was lower compared to small/medium ones.

The revised guidelines enhanced the flexibility in setting the interest rates stating that the pricing of loans should be sanctioned by a board-approved policy. However, this came with a rider that lending rates and other charges/fees on microfinance loans should not be usurious. These imply that MFIs would be able to price the cost of delivery of their service under the new regime and help smaller MFIs serve underpenetrated areas.

Upon interacting with 14 NBFCs across India, it has been revealed that NBFC-MFIs rate hikes have been executed by sections of the industry in the range as depicted below—

Our survey also revealed that most MFIs have increased the yield at a uniform rate irrespective of risks across customers and geographies. A limited number of MFIs raised the yield by following a risk-based pricing approach based on

  • Underlying risk of borrowers (linked to their CIBIL scores)
  • High-risk geographies
  • Non-home state geographies

In our view, the new guidelines provide headroom for absorbing higher credit costs as pricing is driven by market forces or the cost of borrowing. We expect rates will continue to be at elevated levels in the near term till the industry recovers the losses on account of Covid, after which competitive pressures and a different policy rate trajectory may influence pricing.

De-regulation of interest rates provides a good opportunity for the industry to have differentiated pricing based on the riskiness of borrowers even within the same group. This will eventually pave the way to an improvement of the credit habit of borrowers as it will reward them with lower interest rates and vice-versa. Going forward, MFIs could eventually charge interest rates based on the underlying risk of each borrower.

(ii) Processing fees

Processing fees are another part of the pricing of MFI loans which was limited to 1% of the gross loan amount previously. However, the restriction has been lifted in the new RBI regulations. Our survey revealed that most MFIs have increased the processing fees by 100 bps to 2% after the new rules were implemented.

We have already mentioned the increase in operating expenses due to higher TAT for onboarding customers, frequent training, and CIBIL being run for 3-4 members per case instead of 1 (under the previous regulation) for NBFC-MFIs due to new regulations. Hence, lifting the restrictions on processing fees seem plausible as the increase in fee is expected to cover the immediate increase in operating expenses of NBFC-MFIs.

Here are a few takes of the market practitioners regarding the new regulations:

Kartik Mehta, MD of Ahmedabad-based Pahal Financial Services, said “The entire eco-system will need to reinvent themselves to be able to follow the new regulations. Entities will need to have a certain minimum level of technological evolution to be able to sustain in this segment. Also, the front-end acquisition teams of all the REs will need to be retrained to be able to capture the essence of the new regulations.”

When asked about the de-regulation of interest rates, Mehta said, “By introducing risk-based pricing, the regulator has created a window for good customers to get a competitive pricing thereby navigating the REs towards a more market-led efficient delivery model.”

As per Vivek Tiwari, MD, CIO & CEO of New Delhi-based SATYA MicroCapital, “The new regulations are instrumental in making more credit available to the mass population with increased income limit. In a way, they will help increase the market potential of microlending by at least double in the near term. They will also bring more product innovations, a larger reach, and competitiveness in customer service and pricing. With relaxed pricing norms, institutions will be able to serve under-penetrated markets even with higher operating costs.”

With respect to the impact of new regulations on the rejection rate, Tiwari commented, “We have seen an increase in rejections in existing areas of operations across 100 districts. Now, we will be looking for an opportunity with a deeper penetration in new territories with lesser credit offtake at present. Product innovations coupled with new reach will reduce rejections going forward which will, in turn, include more people in the microlending net in the next 2-5 years.”

Conclusion

NBFC-MFIs are not only an economic tool to further financial inclusion in India but also a medium to impact livelihoods in rural and urban areas and to empower women who comprise the largest part of their borrower base. The new regulations are expected to fuel growth in the industry once the challenges with respect to their implementation are sorted out in the near term.

Disclaimer:

The views provided in this blog are the personal views of the author and do not necessarily reflect the views of Vivriti. This article is intended for general information only and does not constitute any legal or other advice or suggestion. This article does not constitute an offer or an invitation to make an offer for any investment.  

DATE
August 12, 2022
PLACE
Mumbai
READING TIME
10 mins

What to expect post-RBI MPC meeting – A short note

The Reserve Bank of India-led Monetary Policy Committee (MPC) raised the repo rate for a straight third time this financial year citing elevated risks of inflation, which is expected to remain above the upper tolerance level of 6% through the first three-quarters of FY23. The repo rate was unanimously increased by 50bps to 5.4% with immediate effect, taking the aggregate hike of 140 bps in three months.

The retention of the stance at “withdrawal of accommodation” implies that further hikes are likely in order to control inflation while supporting growth. However, similar to the FOMC, the RBI MPC remained non-committal and did not provide any guidance about the future trajectory of hikes, which makes sense given the uncertain macro environment.

RBI kept its inflation forecast unchanged at 6.7% for FY23, driven largely by elevated core inflation (which remains sticky around 6%) and global uncertainties. We believe there are downside risks to RBI’s inflation forecast due to falling commodity prices on fears of a recession in advanced economies. However, the bar for easing remains very high since inflation is still expected to be higher than RBI’s upper tolerance band. Hence, we see hikes to continue taking the terminal repo rate to 5.75-6% by the end of the year.

The Indian bond market spooked as it was expecting RBI to take a softer path due to slide in commodity prices, in particular crude. The 10Y G-sec yield clocked the highest single session rise in three months, surging 16bps to close at 7.3% on the day of the MPC meet. The rise in corporate bond yields is depicted in the chart below.

Impact on mid-market debt

The transmission of the benchmark interest rates would pick up pace as hikes continue and RBI keeps its hawkish stance intact. Until now, the transmission of hikes was more pronounced with higher credit-rated issues like AAA and AA. But going forward mid-market firms are expected to witness the pinch of rising borrowing costs as well, which could dampen the growth of these firms to some extent. This, along with a volatile macroeconomic environment, might deter them at the margin for greenfield expansion. However, significant deleveraging that has taken place in the space and stable operating metrics of these firms are expected to make the impact and future movements on their balance sheets lenient.

Disclaimer:

The views provided in this blog are the personal views of the author and do not necessarily reflect the views of Vivriti. This article is intended for general information only and does not constitute any legal or other advice or suggestion. This article does not constitute an offer or an invitation to make an offer for any investment.  

DATE
May 17, 2022
PLACE
Mumbai
READING TIME
10 mins

Supreme Court clears the air on governance for India’s NBFCs

On May 10, India’s Supreme Court (SC) has given the verdict that non-banking finance companies (NBFCs) cannot be regulated by the State-enacted moneylending legislation. This brought a respite to NBFCs bothered by the 13-year-long cases in Kerala and Gujarat, which tried to regulate the business of NBFCs, including the level of interest rates charged by them to borrowers.

The Case

In 2009, several NBFCs filed applications in the Kerala High Court (HC) after the State government asked them to obtain licenses under the Kerala Money Lenders Act, 1958, failing which penal consequences were threatened. However, Kerala HC ruled in favour of the State government in November same year causing non-bank lenders to move the SC for resolution.

A similar crisis struck in Gujarat around the same time but there was a different outcome. The office of the Prevention of Money Lenders in Gujarat asked NBFCs to register under the Bombay Money Lenders Act. Opposing the move, the NBFCs filed pleas at the Gujarat HC, which had ruled in favour of the lenders in 2010. Again, in 2011, the State asked NBFCs to register under the Gujarat Money Lenders Act but failed after the HC ruled in favour of lenders in the same year. This led the Gujarat government to file an appeal against NBFCs before the SC.

What is moneylending legislation and how it’s different from NBFC regulation?

In India, moneylending legislation was introduced to curb non-regulated indigenous lenders from charging exorbitant interest rates to borrowers. It requires licensing of moneylenders, imposing a ceiling on the rate of interest (which, in the Kerala Act, was a maximum 2% above the maximum interest charged by commercial banks), mandating moneylenders to keep books of accounts and give receipts, etc. One of the earliest moneylending regulations in India is the Bengal Moneylenders Act, which was enacted before Independence, in 1940.

As per the scheme of the Constitution, there are three Lists with respect to the allocation of powers between the Union and the States. List 1 is the Union list, where only the central government is competent to make laws, List 2 is the State List, where state governments are allowed to make laws, and List 3 or the Concurrent List, where both Centre and States are competent to make laws. While giving the verdict, SC has stressed that comprehensive regulations with respect to NBFCs fall in List 1 while moneylending legislations fall in List 2.

The conflict between the two regulations arose because many of the moneylending legislations were imposed at a time when there was no clarity with respect to the regulation of NBFCs by RBI. The Reserve Bank of India Act, 1934 was enacted initially to regulate banks, and the regulation for NBFCs was included at a much later date in the act. However, during the time when the clarity is yet to come state governments faced issues like farmers’ suicide or there could be some political imperative that led them to take action against NBFCs as per the moneylending act.

The NBFCs were anguished by the state government’s attempts to bring them under the moneylender act due to the adverse effect of a dual and disparate regulation on economic efficiency in doing business. Secondly, making NBFC subject to state regulation took away their flexibility of doing business and exposed them to several risks, for example, a decision of moratorium on loans taken by the state government as political imperative would need them to comply with.

Microfinance crisis

Around the same time, in 2010, the microfinance (MFI) sector in Andhra Pradesh (AP) struck with a similar crisis. MFIs operate like NBFCs and provide credit to the underprivileged sector. They started emerging in 1990s, mainly in AP. Due to this, the State is deemed as the motherland of the MFI industry in India. The crisis happened right after the successful listing of a major MFI player in the state, SKS Microfinance (which later renamed as Bharat Financial in 2016 and merged with IndusInd Bank in 2019).

In Oct 2010, the AP government passed The Andhra Pradesh Microfinance Institutions (Regulation of Moneylending), Act following an ordinance to curb the activities of MFIs, which include specifying the area of their operation, rate of interest, and recovery practices. The legislation was passed after a spate of suicide by rural borrowers due to alleged coercive loan recovery methods followed by MFIs. The AP government barred SKS and other MFIs as well as some NBFCs from giving loans causing the MFI sector to collapse and shutdown of many smaller companies.

In 2011, SKS filed a plea in SC challenging the AP MFI Act and sought scrapping of the legislation. In 2013, SC has provided interim relief to SKS to operate in the State until the case is resolved. However, it directed SKS to adhere to the Andhra Pradesh Microfinance Institutions (Regulation of Money Lending) Act. In 2017, the SC did not give any immediate relief to SKS and asked the company to plead its case before the AP HC only.

The latest SC Verdict

The bench of Justices at the SC held that NBFCs do not fall under the jurisdictions of moneylenders acts of State governments when the financiers are already regulated by the Reserve Bank of India Act, 1934. The top court identified the conflict between the RBI Act and the Moneylenders Act. It implied that Chapter IIIB of the RBI Act covers the cradle to the grave of NBFCs. “As a consequence, the single aspect of taking care of the interest of the borrowers which is sought to be achieved by the State enactments gets subsumed in the provisions of Chapter III­B,” the bench said.

Expected impact

The latest ruling expects to favorably impact NBFCs in the following ways:

Smooth functioning: It expects to enable smooth functioning of NBFCs due to reduced levels of intervention. State governments have often attempted to take steps against NBFCs under their moneylending acts even though the issue was still being subjudice.

No dual regulation: The issue gave rise to the possibility of dual regulation of NBFCs, which is not new in the Indian market though. Previously, some regulatory aspects of Cooperative banks were divided between state governments and RBI. However, it gave rise to lapses and the Centre had to revise such regulations in Sep 2020 and gave RBI more regulatory control. Dual regulations in the NBFC space due to the presence of a State enactment and RBI regulation created a lot of uncertainties, mainly in Gujarat and Kerala, which are expected to go away with the latest ruling.

Lower pressure on NIM: The cost of borrowing of most NBFCs expects to increase in a rising interest rate environment. The latest ruling expects to help lenders lower pressure on their net interest margin (NIM) due to a lack of intervention from state governments while passing on the rate hike to borrowers.


Disclaimer:

The views provided in this blog are the personal views of the author and do not necessarily reflect the views of Vivriti. This article is intended for general information only and does not constitute any legal or other advice or suggestion. This article does not constitute an offer or an invitation to make an offer for any investment.  

DATE
May 9, 2022
PLACE
Mumbai
READING TIME
10 mins

Would the surprise rate hike by RBI impact the mid-market debt?

On May 4, RBI announced 40 basis points (bps) hike in repo rate (the rate at which RBI lends short-term funds to commercial banks) to 4.4% effective immediately and a 50bps rise in cash reserve ratio (the share of bank deposits held as reserves with RBI) to 4.5%. Both the quantum of hike and timing was surprising for the markets as the central bank was expected to hike rates in June.

RBI has kept the reverse repo rate (the rate at which RBI borrows funds from commercial banks) unchanged and retained the monetary policy stance as ‘accommodative’ while focusing on ‘withdrawal of accommodation’.

Double whammy

A day later, the US Fed announced a 50bps hike (biggest since 2000) in interest rates to the range of 0.75% to 1% and launched the “Quantitative Tightening” program. However, the hike was broadly in line with market expectations and is considered less hawkish as the FOMC Chair retracted the earlier consensus of a 75bps hike in the next meeting. The Fed has indicated a further 50bps hike over the next two meetings.

The European Central Bank (ECB) is expected to join the bandwagon by raising rates soon. Its next meeting is on Jun 9. As per a policymaker at the bank, there is room for up to three hikes this year.

Inflation fear

The surprise hike followed RBI’s shift in focus towards controlling inflation at the April meeting due to global supply bottlenecks and a surge in commodity prices, especially crude oil at US$100+ levels, following geo-political tensions. Food inflation is a major concern due to shortages of key items like wheat and edible oil in international markets. The pressure on food prices expects to intensify further due to higher feed costs and fertilizer prices. Globally, food prices rose 33% year-on-year in Apr 2022.

Recalling the April meeting, RBI raised the inflation forecast from 4.5% to 5.7% for FY23. At the same time, RBI lowered the GDP growth forecast from 7.8% to 7.2% for the fiscal year. Retail inflation rose to a 17-month high at 6.95% in Mar 2022, breaching the upper end of inflation target of 2%-6% of the Monetary Policy Committee (MPC) for three consecutive months.

While raising rates, the US Fed mentioned combating inflation will remain its major focus as the continued pricing pressure due to demand- and supply-side factors were exacerbated by new crises like the Russia-Ukraine conflict and lockdowns in China. ECB is also expected to end its near-decade-long quantitative easing policy due to the rise in inflation to roughly four times its 2% target.

Market reaction

India’s bond market spooked post the surprise hike. The benchmark 10yr g-sec yield rose to its 3-year high at ~7.4% after the rate hike. The anticipated draining of liquidity of INR 87,000 crores by RBI due to a hike in CRR and expectations of forthcoming rate hikes expect to keep the bond yields elevated.

Corporate bond yields across the rating categories have been affected too as depicted in the chart below.

Lending rates set to rise

Since Oct 2019, all banks were mandated to lend at floating interest rates linked to the External Benchmark-Linked Lending Rate (EBLR) to make transmission of monetary policy rates effective.

EBLR has been linked to an external benchmark such as the RBI repo rate or Treasury Bill yield.  Hence, a rise in repo rate implies a higher cost of borrowing for commercial banks, which will lead to a simultaneous rise in interest rates on loans.

Would the mid-market debt be impacted?

Assuming a quick and equivalent transmission of repo rate, the mid-market enterprises that are heavily reliant on the loan market expect to be impacted due to the rise in bank EBLR. Also, the immediate linkage of mid-market debt to bond yields has been found to be stronger with respect to the hike. For instance, if we consider the A-rating space (refer to the chart), the yield has nearly absorbed the repo rate hike on May 4.

Impact on mid-market debt in the Non-Financial Services sector

A rising rate environment is unfavourable for mid-market enterprises, particularly in the discretionary sectors, as well as for long-tenor infrastructure projects with fixed returns. However, companies with established brands can pass on the rise in costs due to a hike in interest rates to consumers. The overall impact expects to be less significant though due to the lower leverage of the corporates on average compared to the previous rising rate environment.

Impact on mid-market debt in NBFC

The rate hike could lead to an immediate uptick in the cost of borrowings for most NBFCs from Q2FY23, impacting their Return on assets (ROA) for a couple of quarters. However, the overall impact on their Net interest margin (NIM) could be limited as the pricing of loans is also expected to increase. If the proposed RBI framework to remove the interest rate ceiling for NBFC-MFIs is implemented, all segments of retail credits are expected to be less impacted.

What about economic growth?

The Indian economy expects to continue its journey on the recovery path due to normalcy in activities post the third wave of Covid, resurgence of private consumption and discretionary spending, and the forecast of a normal monsoon supporting rural demand. Capacity utilisation of India Inc. went up ~72% for the manufacturing sector in Dec 2021 quarter from ~68% in the prior quarter. Imports of non-oil, non-gold, silver and precious metals imports, which is a measure to gauge the strength of the domestic demand, rose ~30% in Apr 2022.

The Federal Open Market Committee chair in the US has also emphasized that ‘growth will remain solid in 2022’ and expects private sector balance sheets to be strong enough to bear the impact of a tightening monetary policy.

Impact on our products

We see no implication on the fund’s current investments. With the increase in the yield, the mid-market player will become dependent on alternative lending sources which will increase the scope for debt asset managers to negotiate for better yields.


Disclaimer:

The views provided in this blog are the personal views of the author and do not necessarily reflect the views of Vivriti. This article is intended for general information only and does not constitute any legal or other advice or suggestion. This article does not constitute an offer or an invitation to make an offer for any investment.