The Pulse – Insights on key macroeconomic data and events (June 2025)

“Financial conditions have been eased, supported by accommodative monetary policy and low volatility in financial markets. The strength of the corporate balance sheets also lends support to overall macroeconomic stability.” – RBI Financial Stability Report (FSR), June 2025


Executive Summary

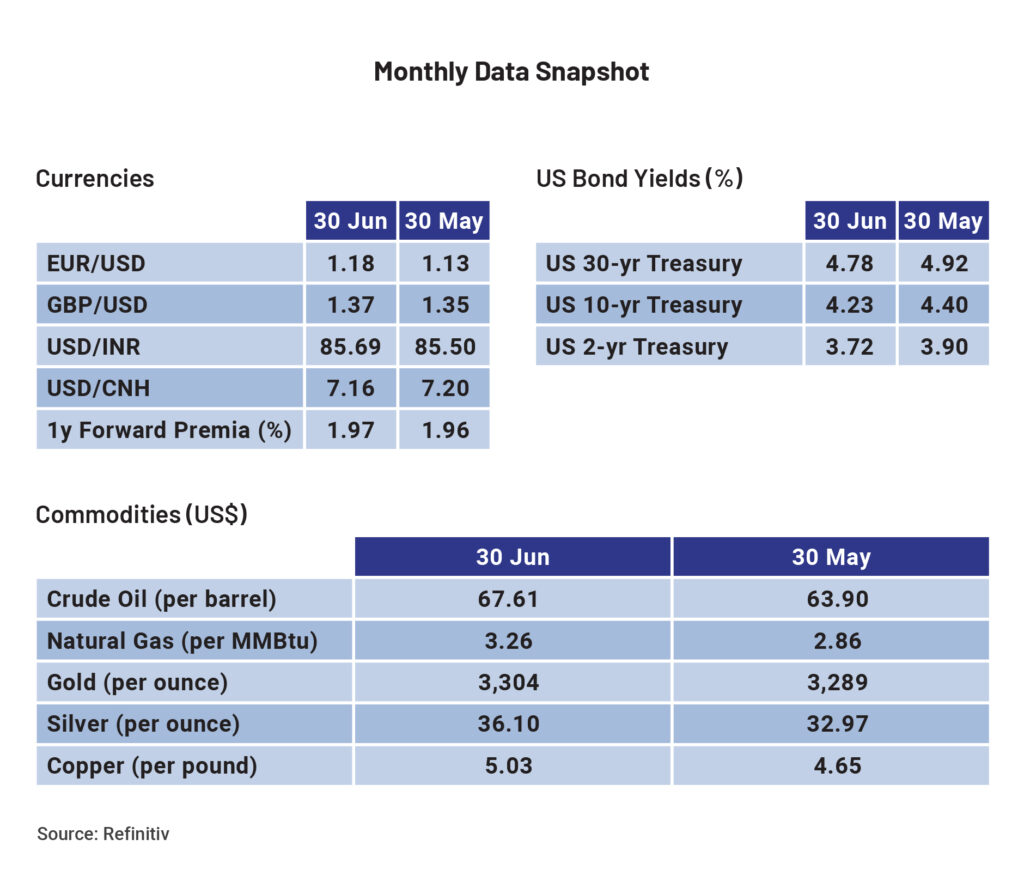
Geo-political tensions in the Middle East were the biggest concern during the month, with significant escalations between Israel and Iran, reminding markets of tensions in the 1980s. With the US striking Iran, global markets took a beating, and crude oil, in particular, saw a sharp spike as the tensions escalated, with Brent reaching about US$80. The de-escalation later through the month, with counterparts reaching an agreement, calmed the markets, with oil giving up most of its move higher.

Meanwhile, the US Fed kept the rates on hold as widely expected, with the Summary of Economic Projections leaning towards stagflation, with Personal Consumption Expenditures inflation revised higher. The Fed kept the dot plot to two cuts this year but reduced the subsequent two years by one cut each. The US consumer price inflation came in softer than expected for the month, and so far, the tariff impact on inflation has been muted for the last two months. The US Fed chair indicated that some impact would be inevitable over time. President Trump continued to push for lower rates, and rhetoric around tariffs continued, with early signs of deals with a few nations. Elsewhere, the European Central Bank cut rates by 25 basis points (bps) along expected lines, taking the cumulative cut since mid-2024 to 200 bps, the Swiss National Bank reduced the rates to zero, while the Bank of England kept them on hold.

On the domestic front, a surprise policy outcome by the RBI, where they front-loaded cuts by reducing repo rates by 50 bps with a 5-1 majority, against the broader consensus estimate of 25 bps. The Monetary Policy Committee (MPC) also cut the cash reserve ratio (CRR) by 100 bps to 3%, infusing about INR 2.5 lakh crore liquidity in a staggered manner, thereby focusing on monetary transmission to boost growth. Finally, the MPC changed the stance to neutral, indicating that the future decision will be data-driven and the bar to reduce further will be high. Barring any significant data surprises, we believe the MPC stays on an extended pause from here. RBI kept the growth rate forecast unchanged at 6.5% while reducing the inflation forecast to 3.7% for FY26. Markets reacted with a steeper curve, with front-end rallying on the back of a larger-than-expected cut.

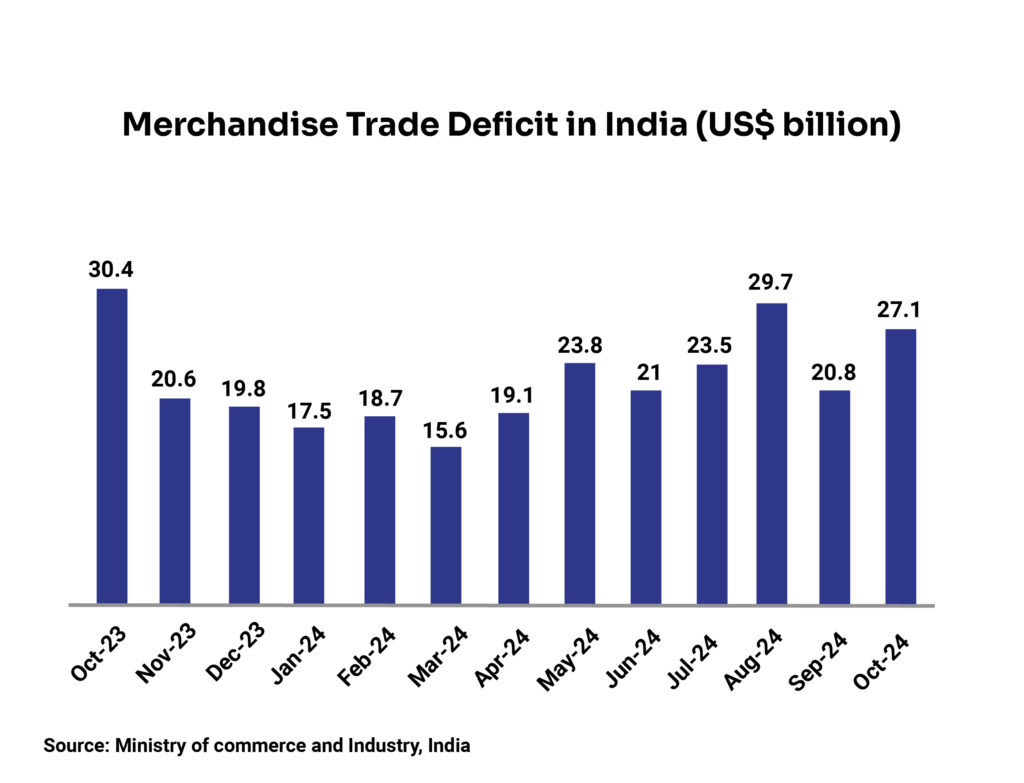
Among other data points, inflation surprisingly eased to a six-year low of 2.82% led mainly by food prices. The trade deficit also narrowed to US$21.9bn in May from US$26.4bn in April, led by a contraction in imports. On the currency front, INR took a beating on the back of geo-political tensions and subsequent oil spike during the month, but stabilized on de-escalation, with foreign exchange reserves restoring to around $700bn.

Retail inflation slips below 3% to a 6-year low; RBI announces the steepest repo rate cut in CY25

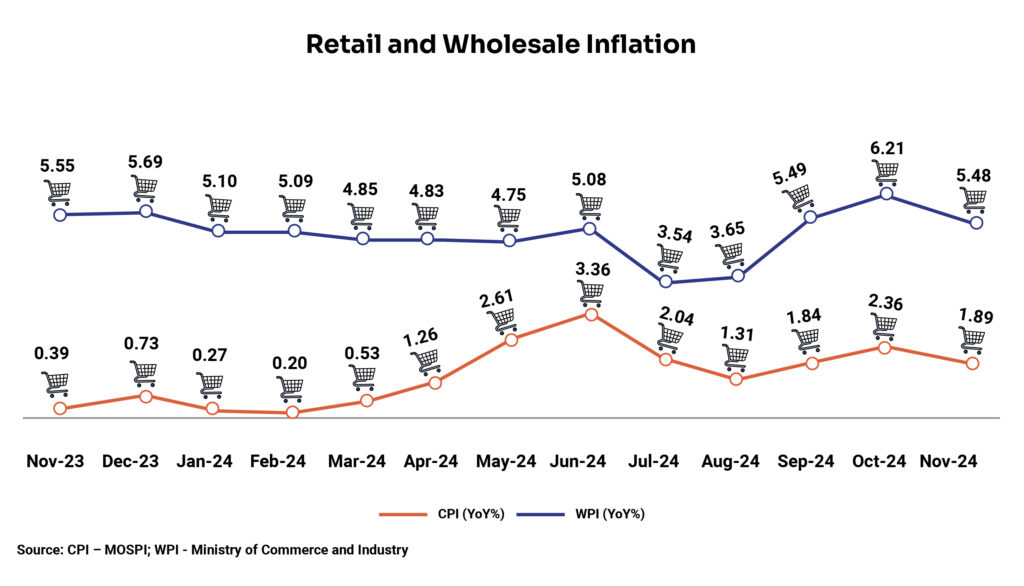
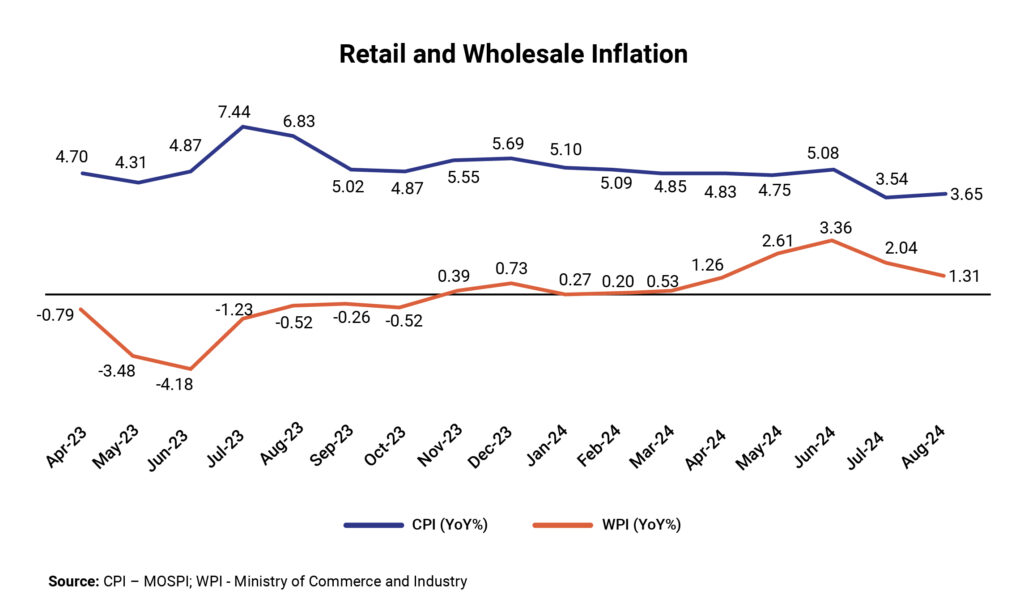
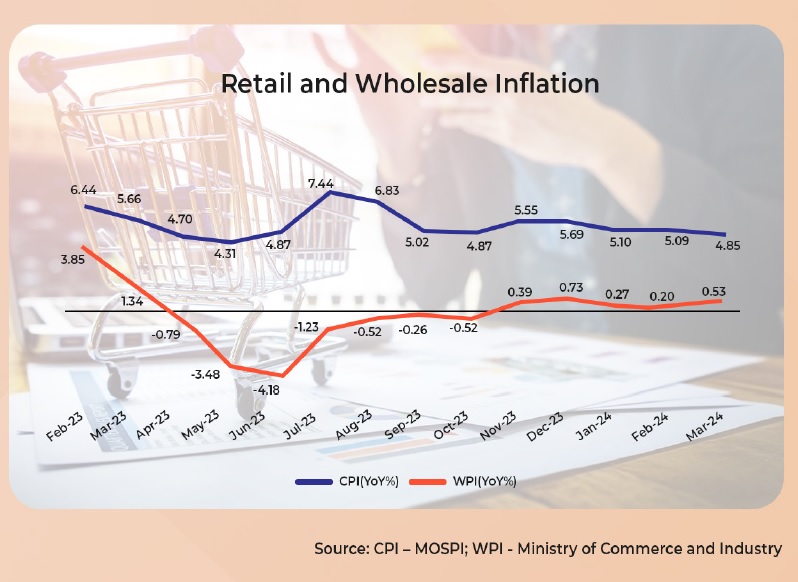
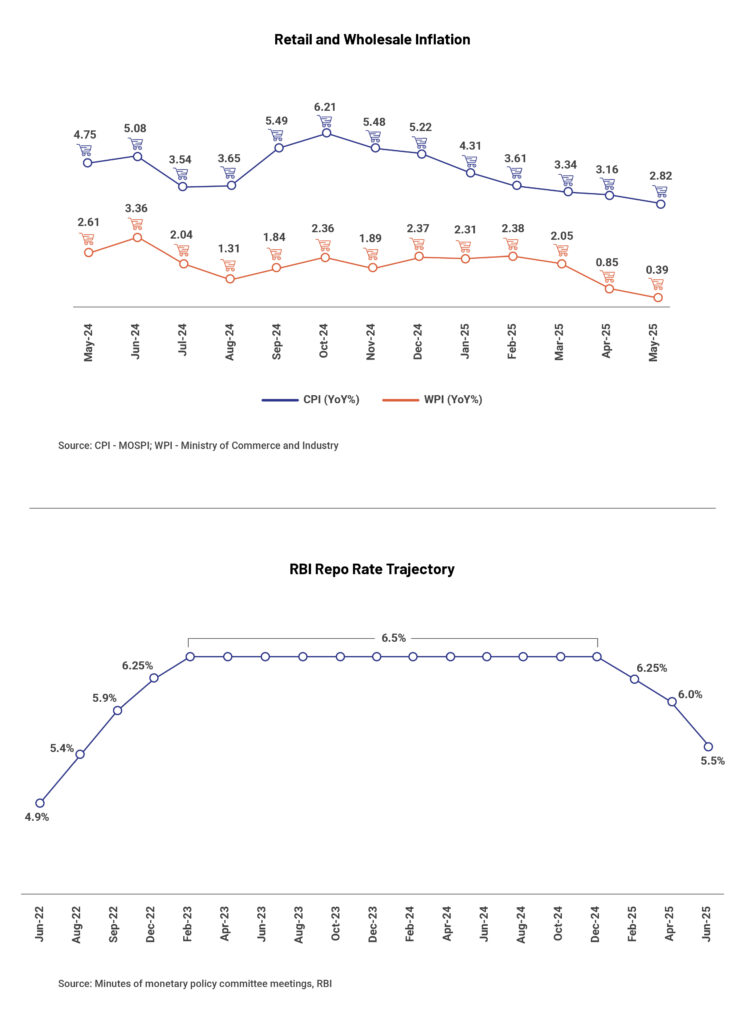
India’s retail inflation, which is measured by the consumer price index (CPI), eased to over 6-year low of 2.82% YoY in May (lowest since February 2019) reflecting 34 bps MoM fall from 3.16% in April. The fall is attributed to food inflation, which dropped to a near 4-year low of 0.99% YoY in May. Within the food basket, vegetables inflation fell 13.7% YoY, the lowest in over 2 years followed by pulses which moderated to 8.2% YoY during the month. However, core inflation, which excludes volatile food and energy prices and is seen as a reliable indicator of domestic demand, slightly inched up to 4.2% YoY in May from 4.1% YoY in April.

The wholesale inflation continued its downward trajectory, falling to a 14-month low of 0.39% YoY in May. The decline is led by lower food and fuel prices. Core inflation moderated to 0.8% YoY in May from 1.57% in April.

Inflation in manufactured products, the largest component in the overall basket, eased to a 7-month low of 2.04% YoY in May followed by inflation for primary articles which contracted to a 23-month low of 2.02% YoY during the month. The decline is driven by a fall in prices of vegetables, pulses, potatoes, onions and protein-rich items such as eggs, meat, and fish. Within the primary articles index, prices for minerals declined sharply to 0.44% in May versus 9.69% in April. The fuel & power category recorded a deflation of 2.27% YoY in May driven by a decline in prices of mineral oil. In contrast, prices of electricity and coal increased during the month.

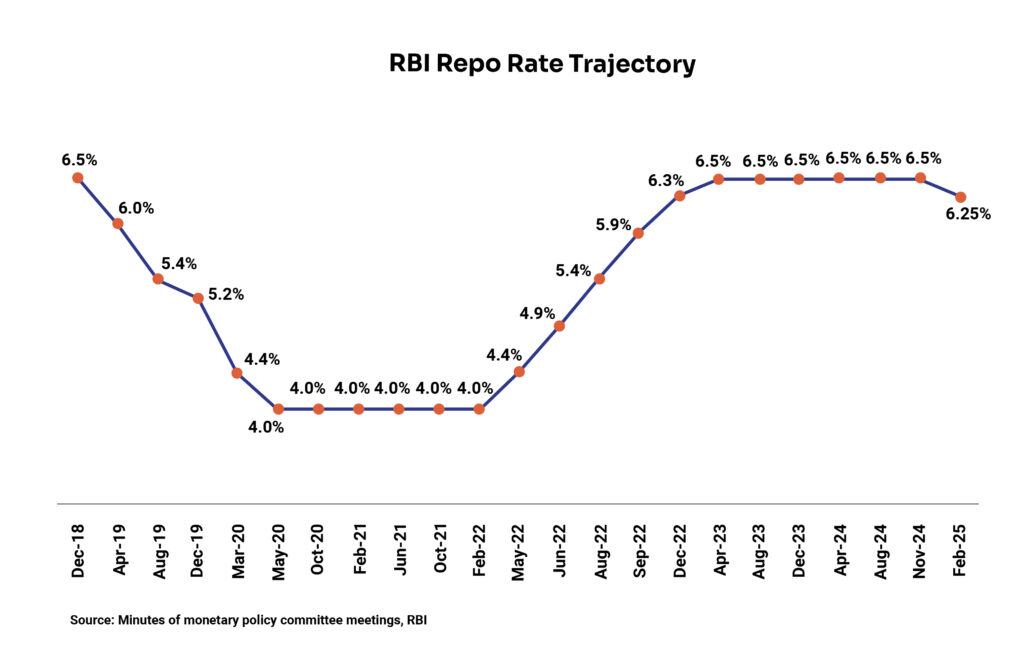
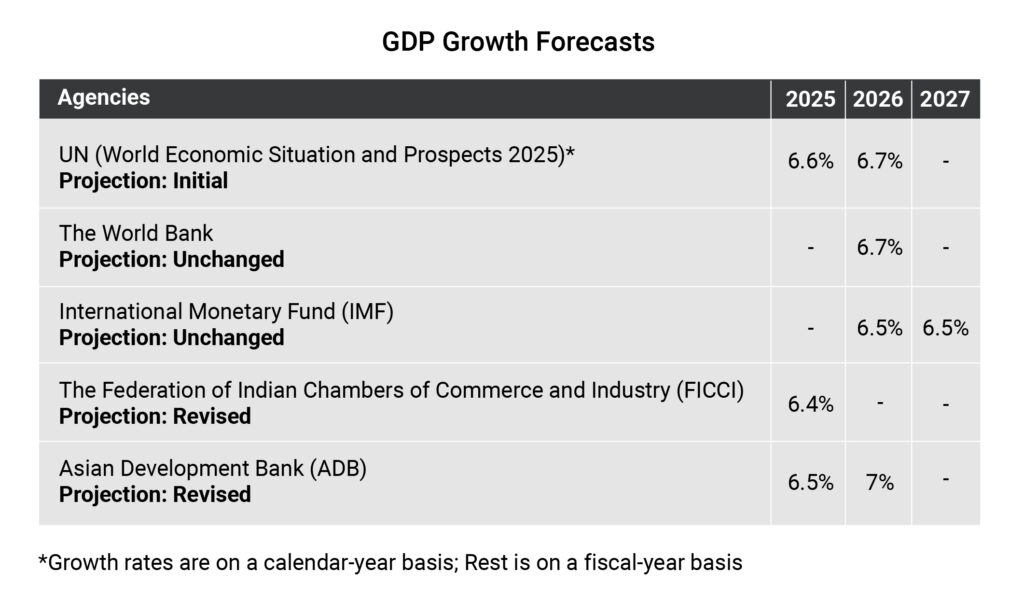
Amid the steady decline in inflation, RBI has reduced the repo rate by 50 basis points (bps), the third consecutive rate cut in CY25, to 5.5%. This rate cut has been the sharpest since the 75-bps reduction during Covid-19 in March 2020. With limited room for further rate cuts, the RBI has changed its monetary policy stance from accommodative to neutral. While external challenges like geopolitical tensions and trade policy shifts remain, RBI has retained India’s growth projection for FY26 at 6.5%.
India’s net foreign direct investment inflows hit record low in FY25

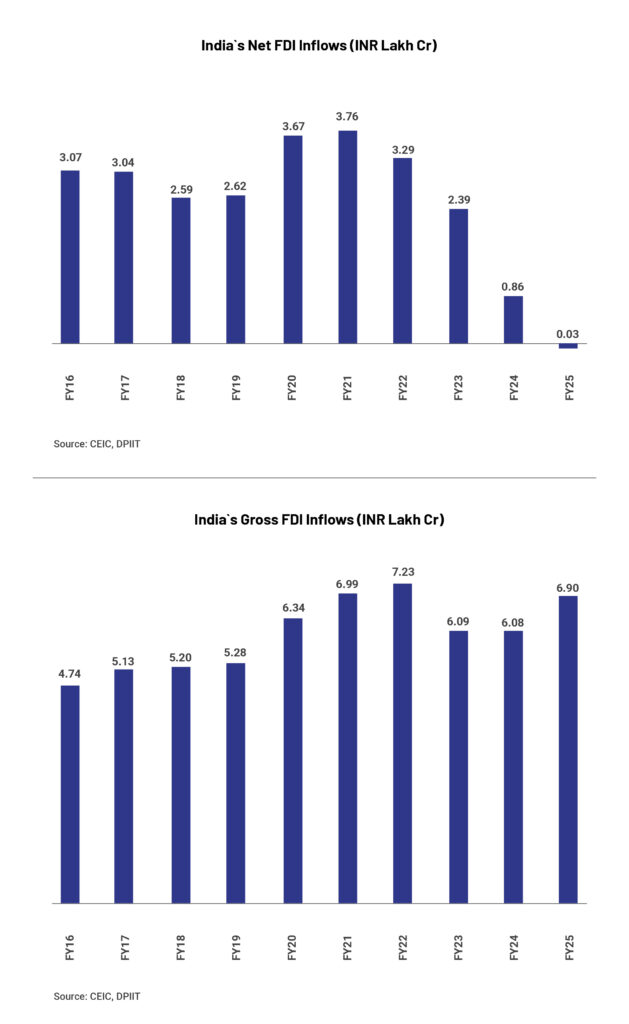
Net foreign direct investment (FDI) inflows into India plummeted 96.5% YoY to an all-time low of US$353 million (~INR 3026 crore) in FY25 from US$10 billion (~INR 86,000 crore) in FY24. The decline in net FDI inflow – calculated by subtracting repatriation and net FDI outflow from gross FDI inflow – happened despite a strong uptick in gross FDI inflow. The decline can be linked to large scale exits by foreign entities trigged by IPOs of large-scale companies such as Hyundai Motor India and Swiggy, among others.

Net FDI outflow grew 75% YoY to US$29.2 billion (INR 2.49 lakh crore) in FY25. Singapore, US, UAE, Mauritius, and the Netherlands together accounted for over 50% of the outflow. Repatriations and disinvestment rose by 15.7% to US$51.5 billion (INR 4.4 lakh crore) in FY25. Economists believe that the moderation in net FDI inflows is not a sign of weakness but is evidence of a mature market enabling the foreign players to enter and exit smoothly.

Gross inward FDI stood at a 4-year high of US$81 billion (INR 6.9 lakh crore) in FY25, as per RBI data. Sectors such as manufacturing, financial services, electricity and energy, and communication services together accounted for ~60% of the inflows. This highlights that India still holds the potential of an attractive investment destination. Furthermore, improving the ease of doing business and strengthening regulatory policies can aid in attracting foreign investment in India.
RBI Financial Stability Report Bank indicates resilient credit growth among NBFCs

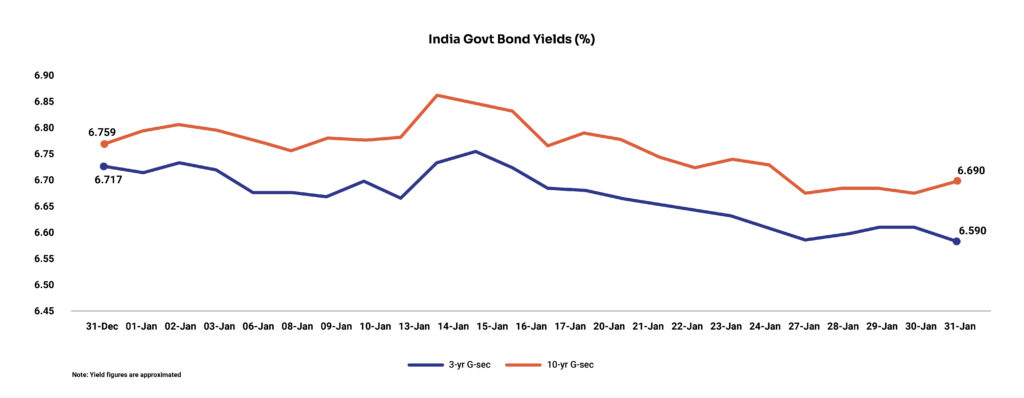
The Reserve Bank of India’s bi-annual Financial Stability Report indicated deceleration in credit growth but improvement in asset quality in the banking sector at the last financial year end. For NBFCs, credit growth improved while asset quality remained improved in the same period. However, the central bank flagged concerns in the financial markets due to volatility in government bond markets, driven by dynamic policy and geopolitical environment.

The credit growth of scheduled commercial banks (SCBs) decelerated to the lowest level (11%) in three years as of March 2025 due to a moderation in growth in agriculture, services, and personal loans over the last few quarters. The credit growth of public sector banks outpaced that of private sector banks as of March 2025 after more than a decade. The credit growth of NBFCs (Upper and Middle Layers) accelerated to 20.7% as of March 2025 from 16% as of September 2024 due to the conversion of a housing finance company (HFC) to an upper-layer NBFC and the merger of a middle-layer NBFC with an upper-layer NBFC.

Both SCBs and NBFCs continued to depict improvement in their asset quality, with the GNPA ratio declining to multi-decadal lows of 2.3% and 3%, respectively. For SCBs, the decline is attributed to stable asset quality in personal loans across major sub-segments and sustained improvements in asset quality across all sub-sectors in industrial loans, while agriculture remained the highest contributor to the GNPA ratio.

For NBFCs, the sustained improvement in asset quality is attributed to a decline in the GNPA ratio of government-owned NBFCs (to 1.4%) (accounts for 59% of advances by NBFC middle layer) and stable asset quality of privately-owned NBFCs (5.2%, which is the same as in September 2024). Sector-wise, asset quality improved in all except agriculture.

Notably, the stress in the retail loan book is visible among NBFCs compared to SCBs, and the former have significantly increased their share in unsecured personal loans and microfinance segments in recent years. SCBs reported a GNPA ratio of 1.2% in their retail loan book while NBFCs recorded a ratio of 3.1% in the same segment in the comparable period.

US inflation accelerates for the 1st time in 4 months, US Fed awaits further cuts

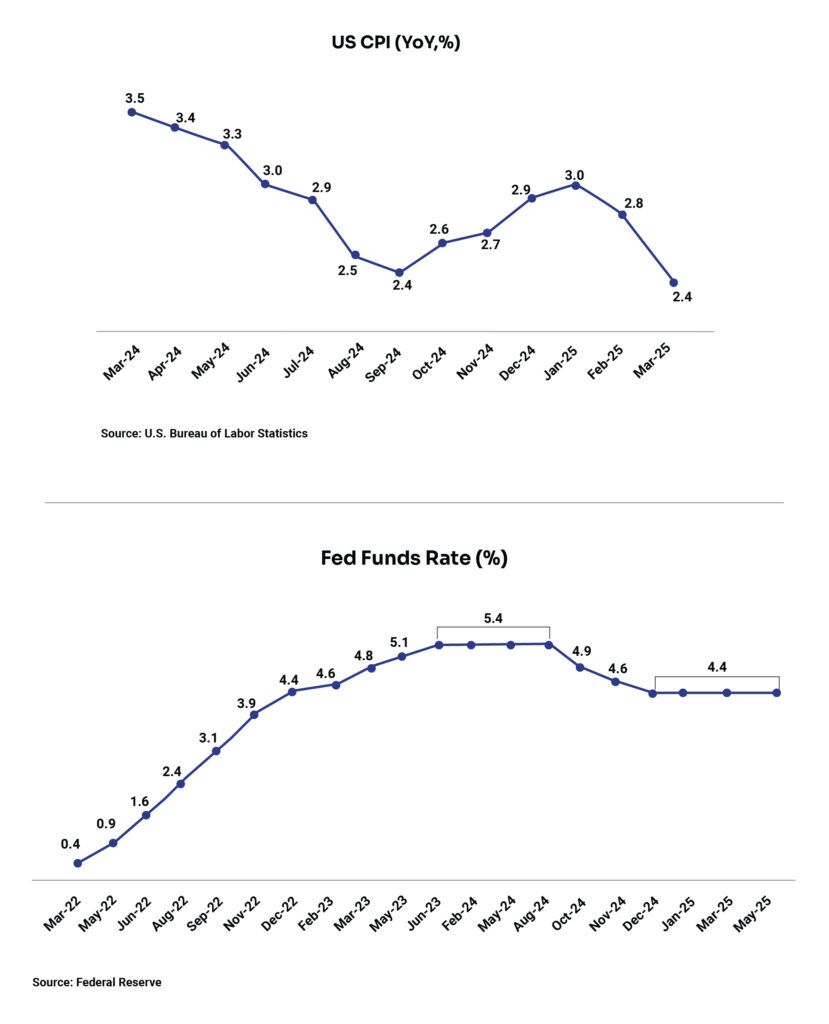
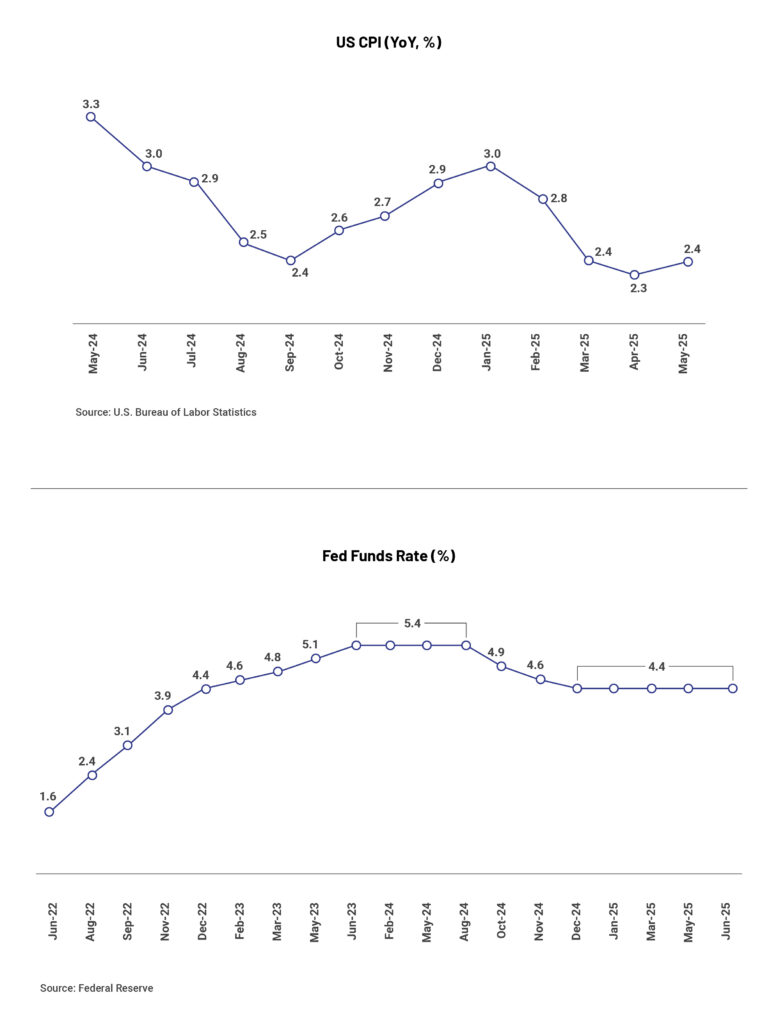
Consumer price inflation in the US accelerated for the first time in four months to 2.4% in May from 2.3% in April, which was the lowest level since 2021, However, the inflation came in below the consensus estimates of 2.5%. The acceleration is mainly driven by rise in prices of food (2.9% versus 2.8% in April), transportation services (2.8% versus 2.5%), used cars and trucks (1.8% versus 15%), and new vehicles (0.4% versus 0.3%).  The core inflation, which excludes volatile food and energy and is considered a better gauge of long-term trends by the US Fed, came in at 2.8%, slightly below the consensus estimates of 2.9%.

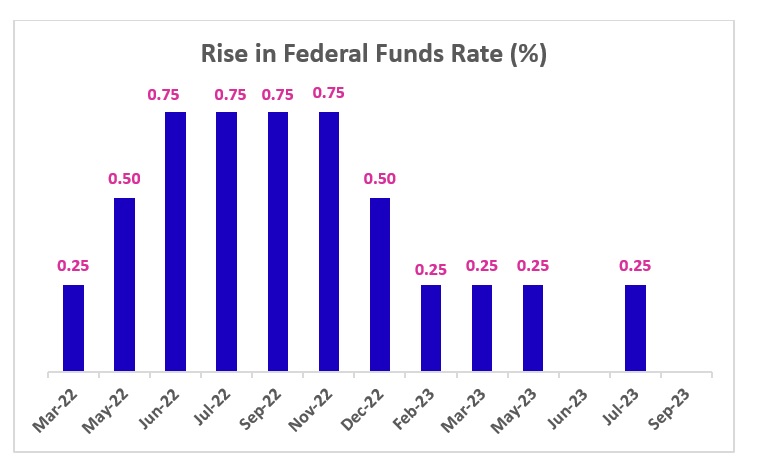
The US Federal Reserve held the repo rate steady at the 4.25%-4.5% range during its May meeting citing upside inflation risk and increase in unemployment. The Fed Chair Jerome Powell said, “that their existing policy is “in a good place” and can allow them to respond swiftly as economic conditions evolve.” As per market estimates, the US fed is likely expected to cut the rates in the later half of the year, although uncertainty remains.
US dollar is on its worst journey since 1973

The US dollar has plummeted over 10% since the beginning of this year to June-end, marking its worst first-half performance since 1973. The ICE dollar index, which tracks the greenback against a group of six major global counterparts including the euro, yen, and pound, is hovering around 97, depicting a 13% fall from its 52-week high.

Despite a resilience in US stock markets, the prolonged fall in US dollar and declining long-term treasury yields indicates growing investor concerns about the ongoing tariff war and rising debt in the US, mainly after the “big, beautiful” tax bill that is expected to add US$3.2 trillion to the overall US debt, as per recent reports. The bill is designed to extend Trump’s 2017 tax cuts, curb healthcare and social welfare spending, and significantly increase public borrowing. Further, rising expectations of further interest cuts in the US following President Trump’s push for lower borrowing costs amid his criticism of the Federal Reserve chair led to conflicting signals on monetary and trade policy to the financial market. There is a growing concern that the dollar’s fall might eventually affect the US equities.

Disclaimer:

The details mentioned above are for information purposes only. The information provided is the basis of our understanding of the applicable laws and is not legal, tax, financial advice, or opinion and the same subject to change from time to time without intimation to the reader. The reader should independently seek advice from their lawyers/tax advisors in this regard. All liability with respect to actions taken or not taken based on the contents of this site are hereby expressly disclaimed.
Private Credit Market in India – A Primer

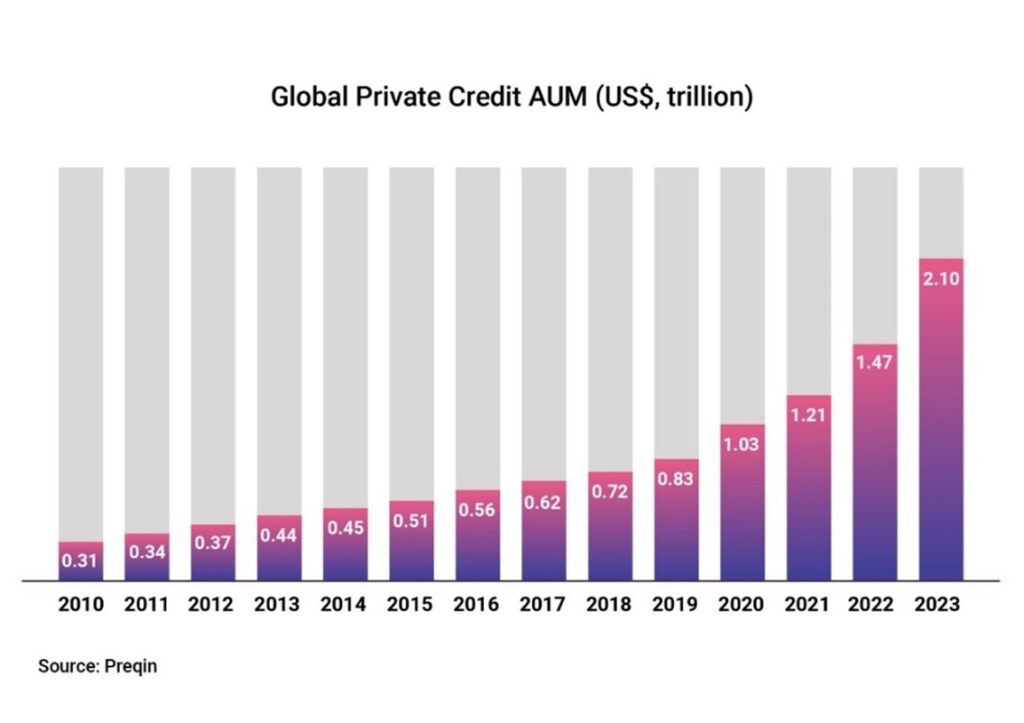
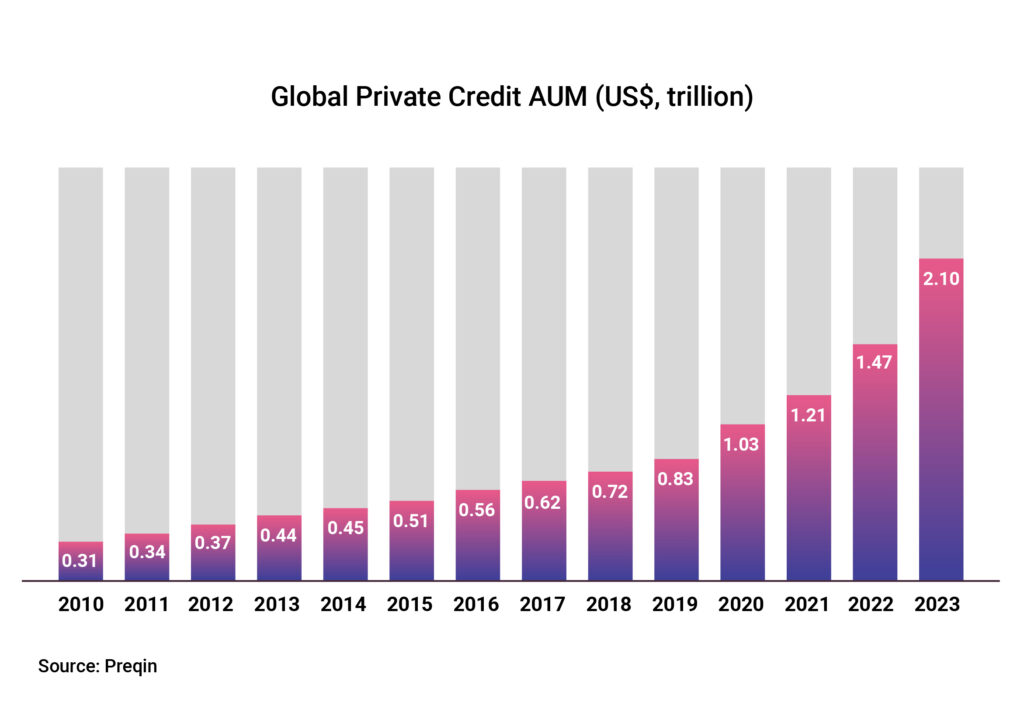
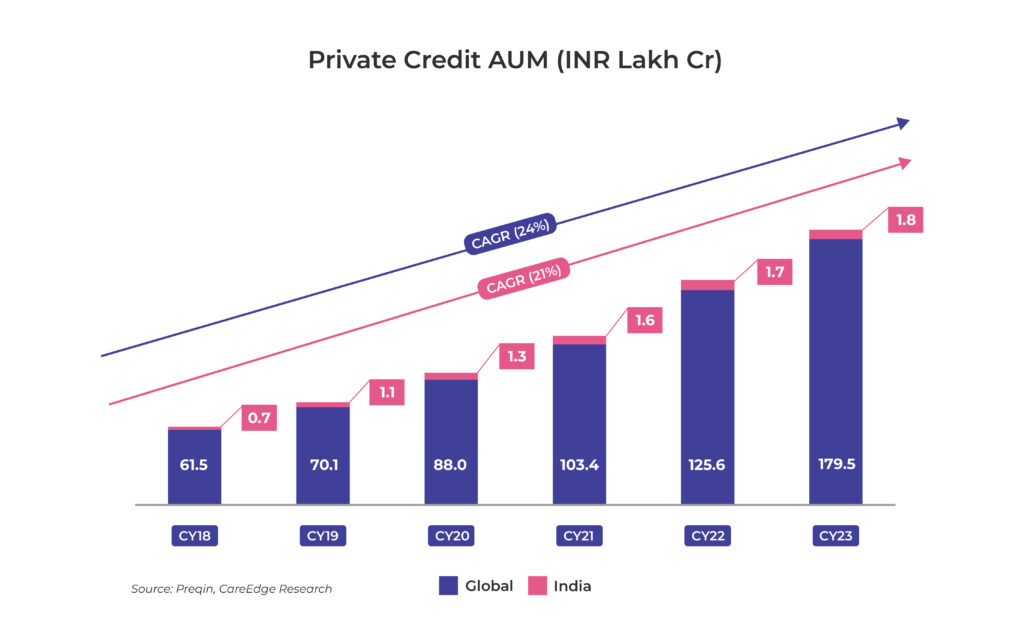
Private Credit provides an alternative source of financing for businesses with unique funding needs and irregular cash flows, cases which banks may avoid due to higher risk and regulatory restrictions. Private Credit lending mostly takes place via asset managers involving a private credit/alternative investment (AIF) fund that intermediates between the ultimate lender and borrower. Such loans are generally senior secured, variable rate, and may comprise multiple credit facilities. The Private Credit market has been growing at a fast pace across the world, and India is no exception. Globally, the market started gaining pace after the financial crisis in 2008 as banks retreated from riskier lending to small and mid-sized businesses and to companies backed by Private Equity.

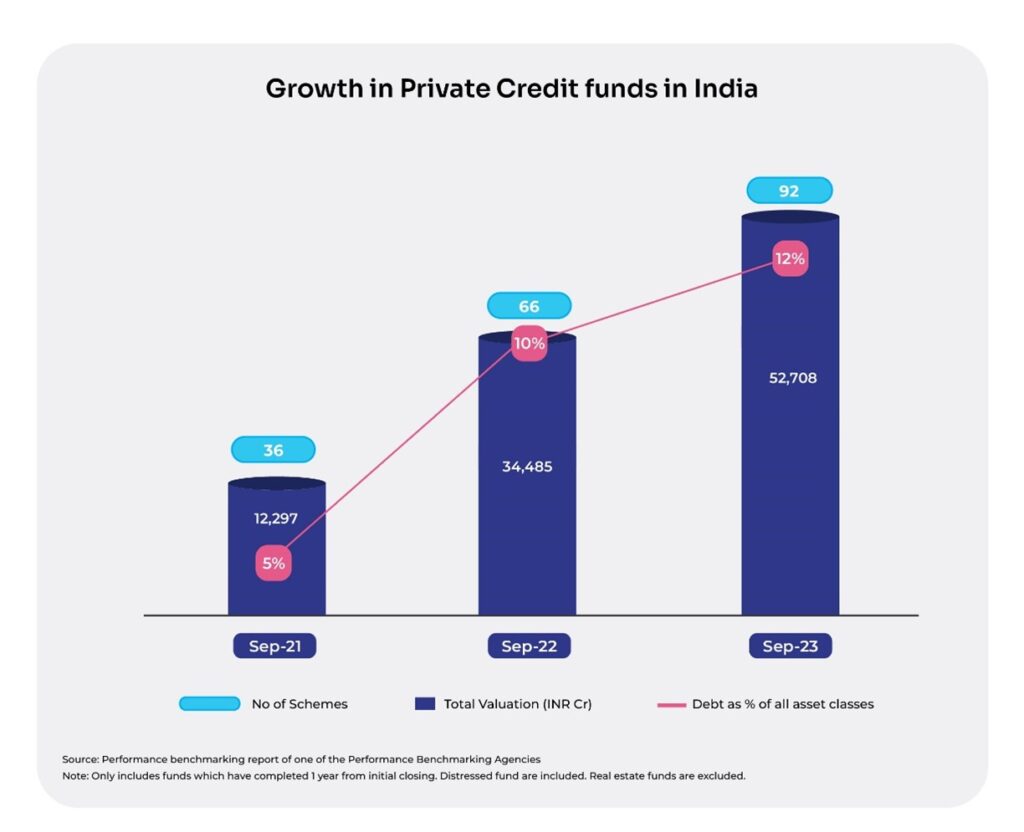
The growth in the Indian Private Credit market is driven by factors such as increasing demand for tailored debt solutions by mid-market enterprises, transformation in regulatory landscape, growing HNI population in the country (6% YoY in 2024), better risk and inflation adjusted returns compared to traditional investments, among others.

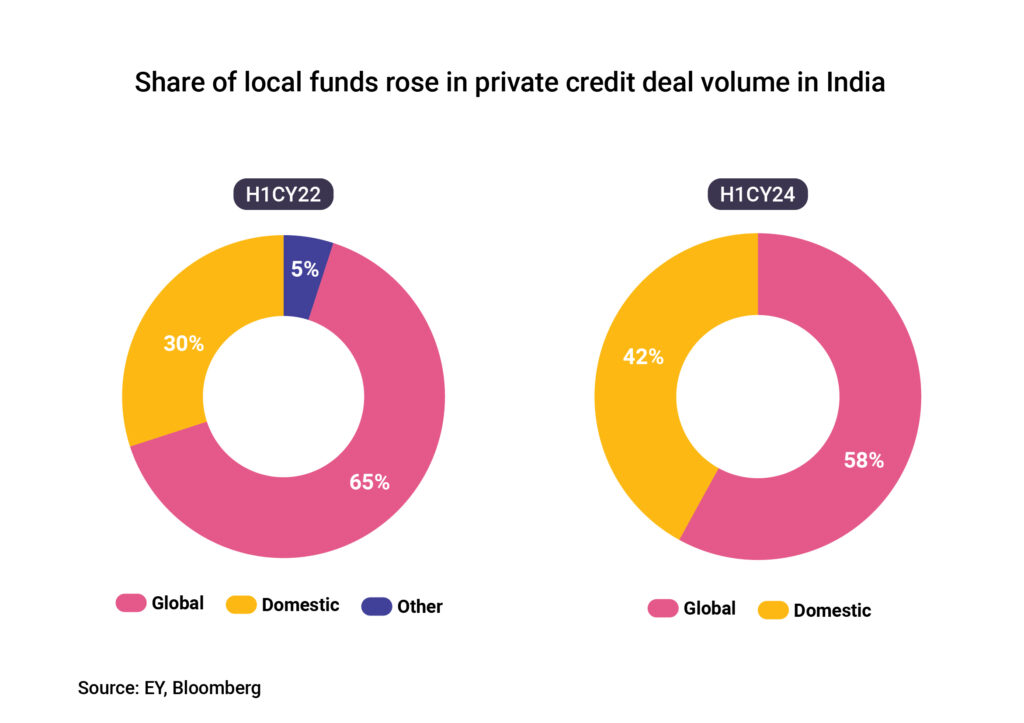
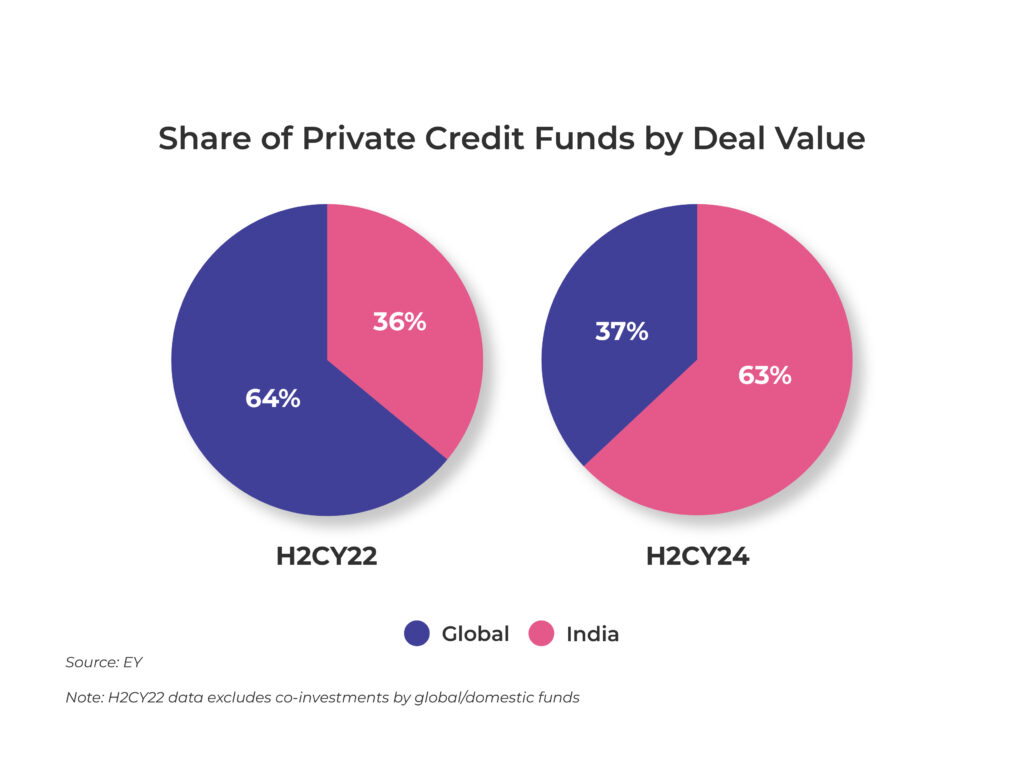
With respect to the market share in the Private Credit space, there has been a trend reversal in the last few years. Domestic private credit funds started stealing the pie from global counterparts due to several factors such as the local expertise of asset managers, growing awareness of Private Credit as an asset class and increase in the number of domestic funds in the market, among other factors. The market share of domestic funds by deal value nearly doubled in H2CY24 compared to H2CY22.

The nature of private credit investments

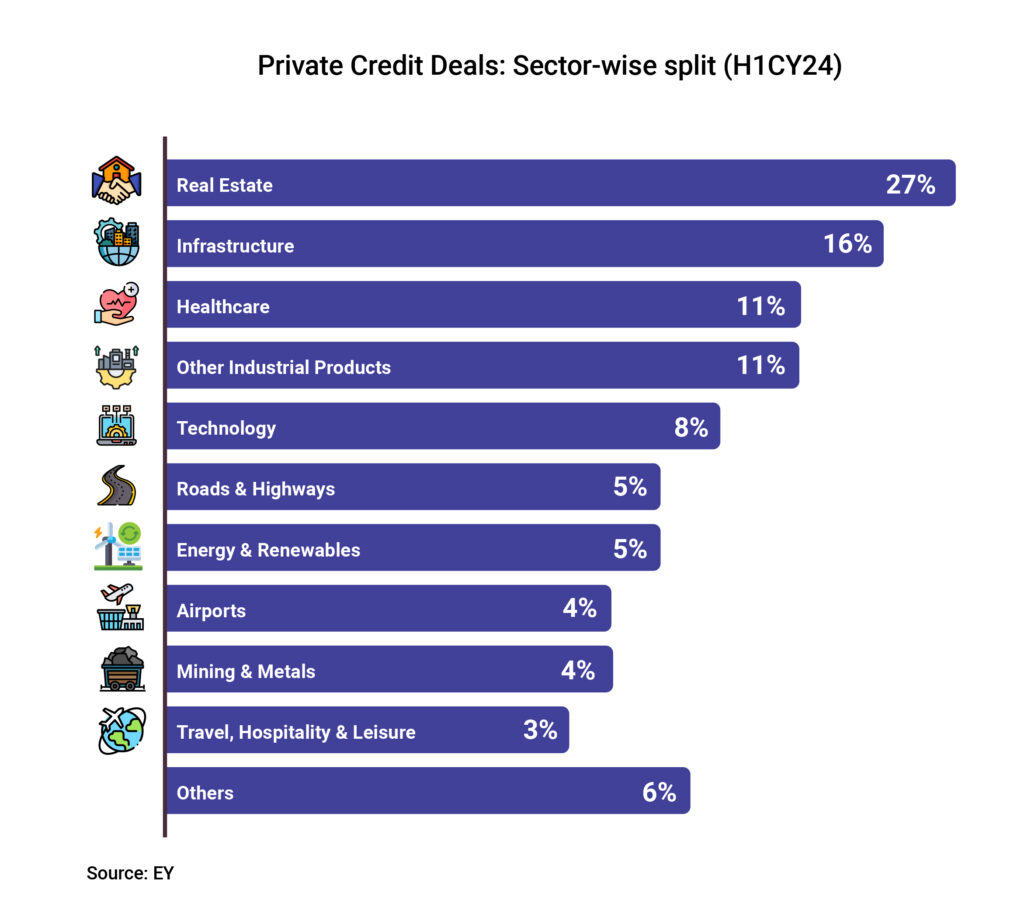
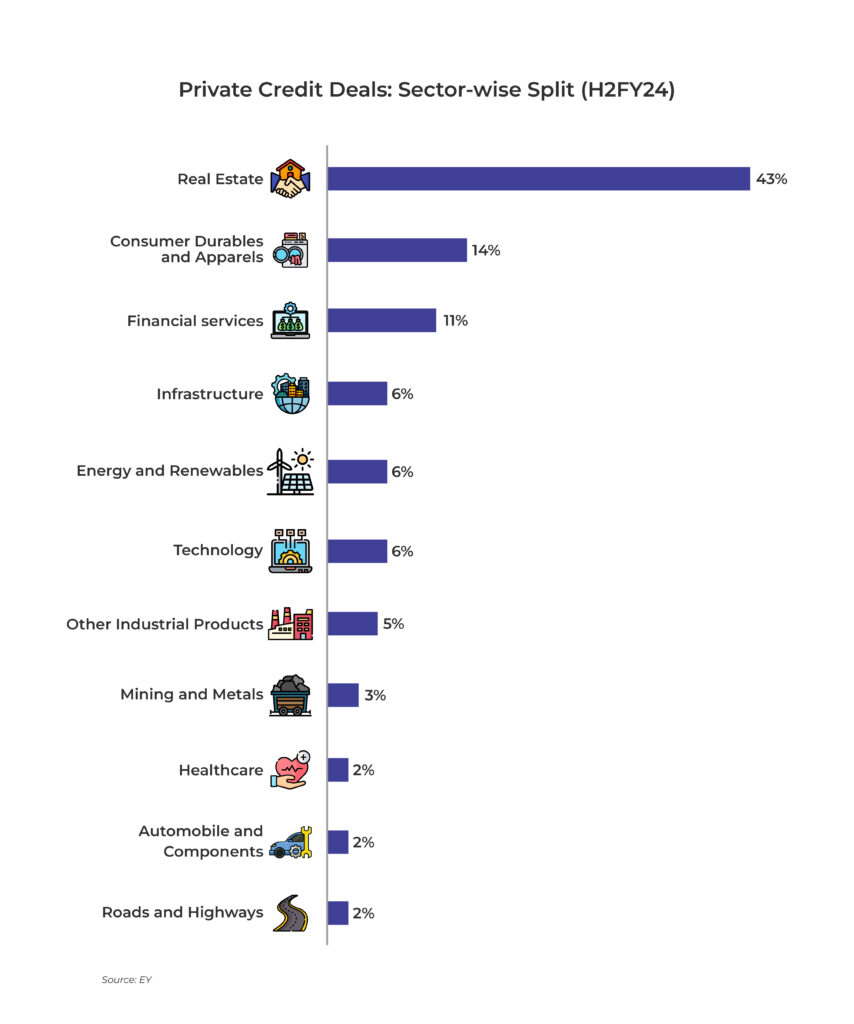
In the second half of 2024, India’s Private Credit market gained significant momentum as investments totaled ~INR 28,390 Cr which are deployed across 67 deals. Like before, real estate dominated the space, in terms of value, followed by consumer durables and apparels, and other sectors. Overall, in CY24, investments totaling ~INR 79,147 Cr were deployed across 163 deals, reflecting a YoY growth of ~7% compared.

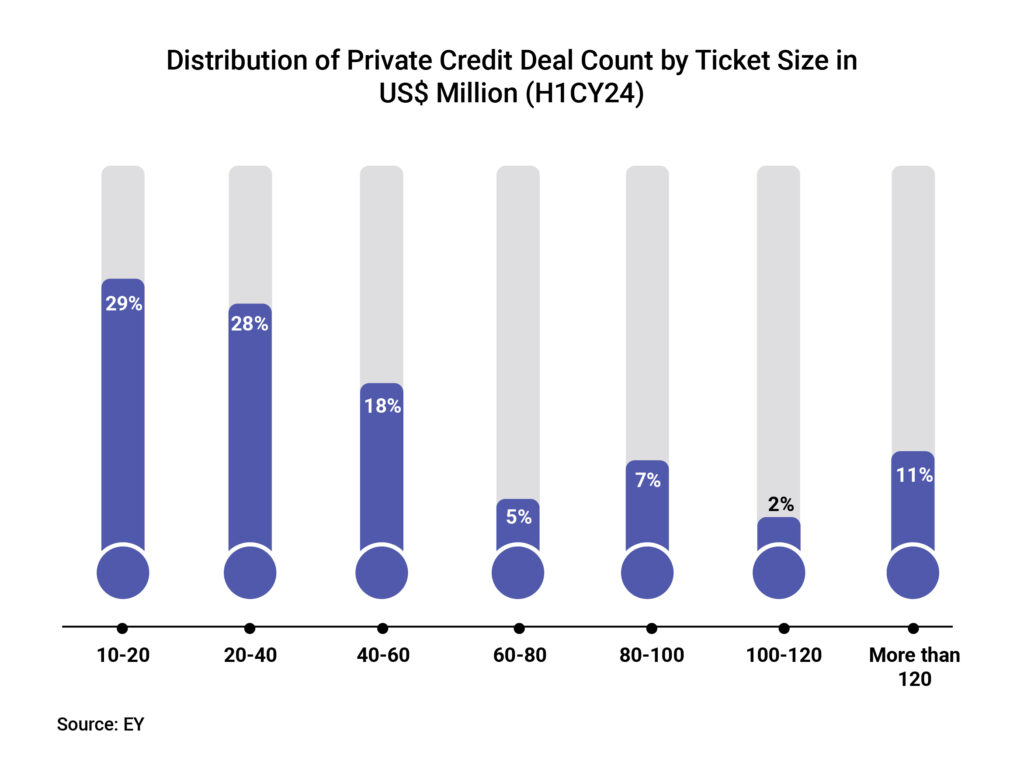
As depicted in the chart below, private credit deals in the range of US$10 million to US$40 million accounted for more than 50% of all private credit transactions in H1CY24. However, in H2CY24, deals exceeding $100 million accounted for ~50% of all the transactions.

Conclusion

Several Private Credit exits in H1CY24 and H2CY24 depicted a vibrant market with significant returns and evolving strategies. Going forward, confidence in the asset class is expected to grow with more and more high-net-worth individuals (HNIs) and family offices backing domestic funds and with a faster pace of growth in the economy.


Disclaimer: The information provided in this article is for general informational purposes only and is not an investment, financial, legal or tax advice. While every effort has been made to ensure the accuracy and reliability of the content, the author or publisher does not guarantee the completeness, accuracy, or timeliness of the information. Readers are advised to verify any information before making decisions based on it. The opinions expressed are solely those of the author and do not necessarily reflect the views or opinions of any organization or entity mentioned.

Why should you consider debt alternatives to diversify your investment portfolio?

Diversification in investing is the key to mitigating market volatility and reducing portfolio risk thereby ensuring stable returns over time. As Sir John Templeton rightly mentioned, “The only investors who shouldn’t diversify are those who are right 100% of the time.”.

A balanced asset allocation in a portfolio can smooth out the inevitable dips and bumps due to changes in market conditions averting significant losses. The primary objective of designing a balanced portfolio is to avoid over-concentration in a single asset class while taking into account the investor’s preference for risk tolerance.

In investing, asset classes are broadly divided into equity, debt, and cash. However, diversification can happen across asset classes or within an asset class. In debt investing, diversification can include different types of debt instruments and funds.

A balanced portfolio in debt investing can be designed as per the maturity, credit risk, and risk preference of investors. At a granular level, it can include direct exposure to government securities, corporate bonds, commercial papers, etc., or indirect exposure to such securities via different types of debt funds.

Debt alternative investment funds (AIFs), which fall under Category II of SEBI Regulations for AIFs, 2012, invest in debt / debt instruments of listed as well as unlisted companies. They can invest in a diverse range of debt securities, including corporate bonds, non-convertible debentures, commercial papers, government securities, and other fixed-income instruments. Investments made by debt AIFs are governed by the fund’s investment strategy and risk-return spectrum with the objective of providing income to the investors.

In general, debt funds face three types of risks:

Interest Rate / Duration Risk: Interest rate risk occurs due to changes in market interest rates. When interest rates decline, the demand for debt securities issued at higher coupon rates goes up resulting in higher valuation of debt securities. Conversely, when interest rates rise, demand for securities issued at lower coupon rates goes down reducing the valuation of securities. This inverse relationship between interest rates and security prices results in interest rate risk. Further, the impact of changes in interest rates depends on the remaining maturity of debt securities. In general, bonds with longer duration are more sensitive to changes in interest rates than the same with short duration.

Liquidity Risk: Liquidity risk refers to the risk of inability to liquidate the investments at fair value before maturity. This type of risk is applicable to debt funds which are open-ended in nature.

Credit / Default Risk: Credit risk refers to the risk of default by the issuer of fixed-income securities in the fund. This happens when the issuer entities are unable to make repayments on time.

Unlike common debt mutual funds in the market, debt AIFs being close-ended in nature, do not carry mark-to-market (MTM) or interest rate risk nor do they face liquidity risk because investors can’t redeem their investments before maturity (they can transfer their units to other investors via a straightforward transfer document in a secondary transaction).

Hence, the primary risk faced by debt alternatives is credit risk, which makes them an ideal investment vehicle to diversify your portfolio. However, choosing a highly professional fund manager with deep local expertise, excellent sourcing ability, and a dedicated risk management team ensuring tight monitoring is highly useful in such cases to ensure minimization of losses due to credit risk. Regulatory steps like the enactment of the Insolvency and Bankruptcy Code and the introduction of the Account Aggregator framework also brought confidence in the market and enabled transparency and scope for efficient decision-making about borrowing entities.

These apart, the Finance Act 2023 provided the long-awaited level playing field to all debt asset managers of various pooled investment vehicles by putting an end to indexation benefit for incremental debt MF investments. This enabled the investors to make decisions about their portfolio allocation within debt purely based on the risk-reward spectrum and asset manager’s track record rather than post-tax returns.


Disclaimer: The information provided in this article is for general informational purposes only and is not an investment, financial, legal or tax advice. While every effort has been made to ensure the accuracy and reliability of the content, the author or publisher does not guarantee the completeness, accuracy, or timeliness of the information. Readers are advised to verify any information before making decisions based on it. The opinions expressed are solely those of the author and do not necessarily reflect the views or opinions of any organization or entity mentioned.

Why wealthy investors are turning to private debt funds

Markets, for all their noise and novelty, are cyclical in nature. Optimism builds quietly, peaks loudly, and then often without warning gives way to unease. At the time of global market volatility, investors particularly those who have already played the equity cycle are asking a different question: where can I find steady, risk-adjusted returns without being at the mercy of global sentiment swings?

For those of us who’ve worked across asset classes, through crises and calm alike, the answer increasingly lies in the private credit space. More specifically, in well-constructed Alternative Investment Funds (AIFs) that are deeply rooted in India’s real economy.

Over the past more than a decade, private debt AIFs have evolved from a niche concept into an integral part of India’s capital formation story. What distinguishes them is their ability to generate predictable outcomes in an otherwise unpredictable environment. Thanks to their low correlation to public markets.

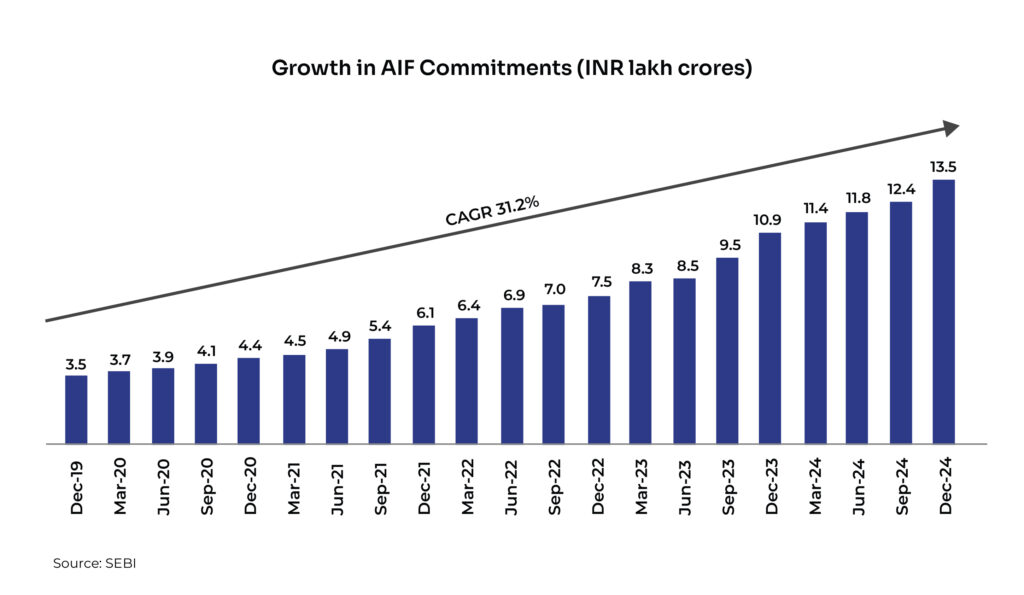
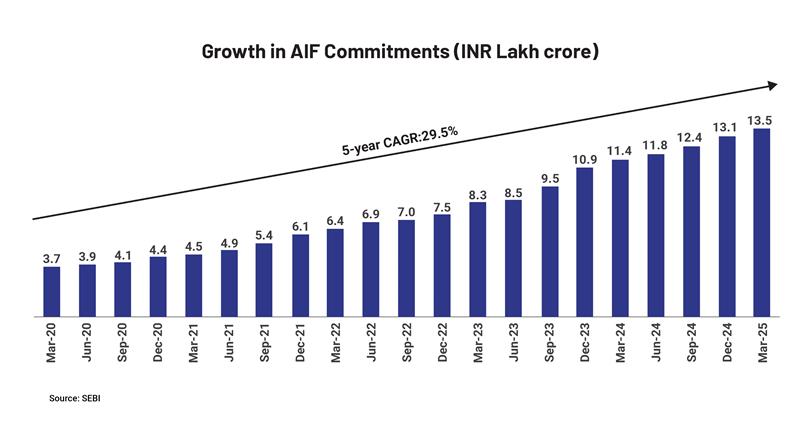
Private debt AIFs can access opportunities that are less susceptible to macro shocks. Their portfolio doesn’t need to be marked to market every day, nor does it invite knee-jerk redemptions in the face of geopolitical risk, in the end, stability matters. It is for these reasons sophisticated investors (HNIs, UHNIs, family offices) in India are reallocating steadily into AIFs as depicted by the exponential growth in commitments, which denotes the amount clients are willing to invest in AIFs.

As India’s economy deepens and diversifies, so too must our investment approach. The contours of growth are shifting from urban centres to hinterlands, from conventional banking to bespoke credit, and from public markets to private enterprise. In this evolving landscape, Alternative Investment Funds offer more than just protection from volatility; they offer purposeful participation in India’s next phase of economic expansion.


Disclaimer: The information provided in this article is for general informational purposes only and is not an investment, financial, legal or tax advice. While every effort has been made to ensure the accuracy and reliability of the content, the author or publisher does not guarantee the completeness, accuracy, or timeliness of the information. Readers are advised to verify any information before making decisions based on it. The opinions expressed are solely those of the author and do not necessarily reflect the views or opinions of any organization or entity mentioned.

The Pulse – Insights on key macroeconomic data and events (May 2025)

“The one instrument that has relative political autonomy is monetary policy.” –  Mohamed El-Erian


Executive Summary

The US Federal Reserve kept rates on hold and indicated that the central bank would likely be reactive instead of pre-emptive in the current uncertain environment. The US Fed’s statement noted the strength in economic activity, however, with rising stagflation risk. President Trump’s policies will continue to take centre stage and the impact of the same will likely determine the Fed’s next move. Meanwhile, the longer-end US treasury continued its weakness in May with yields rising on the back of the ‘Big Beautiful Bill’, with the US 30-year treasury breaching 5%, before a modest recovery. Moody’s also stripped the US of its pristine AAA sovereign rating citing fiscal concerns. In addition to tariffs flip flop, the focus is shifting to US fiscal policy with markets attaching significant term premiums seen in higher longer-end yields. Fading US exceptionalism, fiscal concerns, asset re-allocation, and tariff uncertainty – all of them are supporting softer USD and higher US yields. Barring sharp negative economic shocks, the US Fed will also not be in a hurry to act. Uncertainty continues to weigh on markets for now.

On the domestic front, geo-political tensions dominated the earlier part of the month with volatility in local currency assets. Markets regained their calm once the tensions eased, with rates rallying and currency moderating. Data-wise, inflation continued to moderate, strengthening the case for a deeper rate-cut cycle. Liquidity conditions continued to ease with additional Open Market Operations by the central bank. The Q4GDP growth came in better than expectations while domestic concerns remain due to headwinds from trade disruptions and global slowdown. On the currency front, INR benefits from an overall weaker USD. However, we believe the central bank will likely buffer up its reserves, which they spent since the peak in September-October last year (US$100 billion as per market estimates to defend INR).

Retail inflation drops to its lowest in nearly 6 years, food price-led downward trajectory may continue

India’s retail inflation, which is measured by the consumer price index (CPI) slipped further by 18 basis points month-on-month (MoM) to 3.16% YoY in April 2025, the lowest since July 2019. This can be attributed to a sharp MoM decline of 91 basis points in food inflation to 1.78%, which is the lowest since October 2021. However, core inflation, which excludes volatile food and energy prices, remained unchanged at 4.1% compared to the previous month. The fall in food inflation is driven by subdued food prices of vegetables, pulses, fruits, meat and fish. With this, the retail inflation stayed within the RBI’s medium-term target for three straight months.

The wholesale inflation fell to its lowest level in 13 months to 0.85% in April 2025 due to softening food inflation. It was lower than market estimates of 1.4% and 1.19% in April 2024. All three major segments of WPI – primary articles, fuel & power, and manufactured products – witnessed a moderation in inflation. Inflation for primary articles contracted to 1.44% in April for the first time in nearly two years primarily due to crude oil and natural gas inflation that fell to a 22-month low of 15.55% in April. Inflation in manufactured products, which accounts for over 60% of the overall basket, slowed to 2.62% in April from 3.07% in March. The fuel and power category witnessed a deflation of 2.18% in April against an inflation of 0.2% in March driven by a decline in prices of LPG, petrol, and diesel.

The deceleration in inflation is expected to provide RBI the needed comfort to continue with the rate cut cycle, with another 25-bps cut in FY26 being likely. Since the beginning of this calendar year, the central bank reduced the repo rate by 100 bps to 5.5% with a larger-than-expected cut of 50 basis points in June. The downside potential in India’s inflation trajectory remains strong due to lower global oil prices (with an expected pass-through) and an anticipated normal monsoon and higher foodgrain production, along with a favourable base. The rate cut cycle could get even deeper if the domestic economy experiences a slowdown below RBI’s growth projections for the year (6.5%).

Industrial output growth at 8-month low, mining and electricity sectors slow down

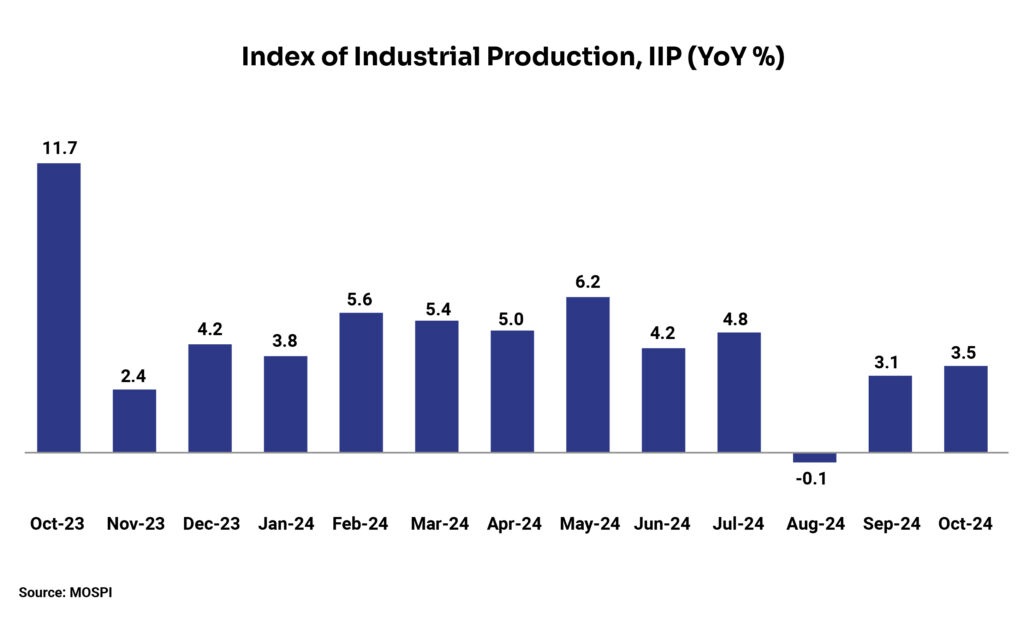
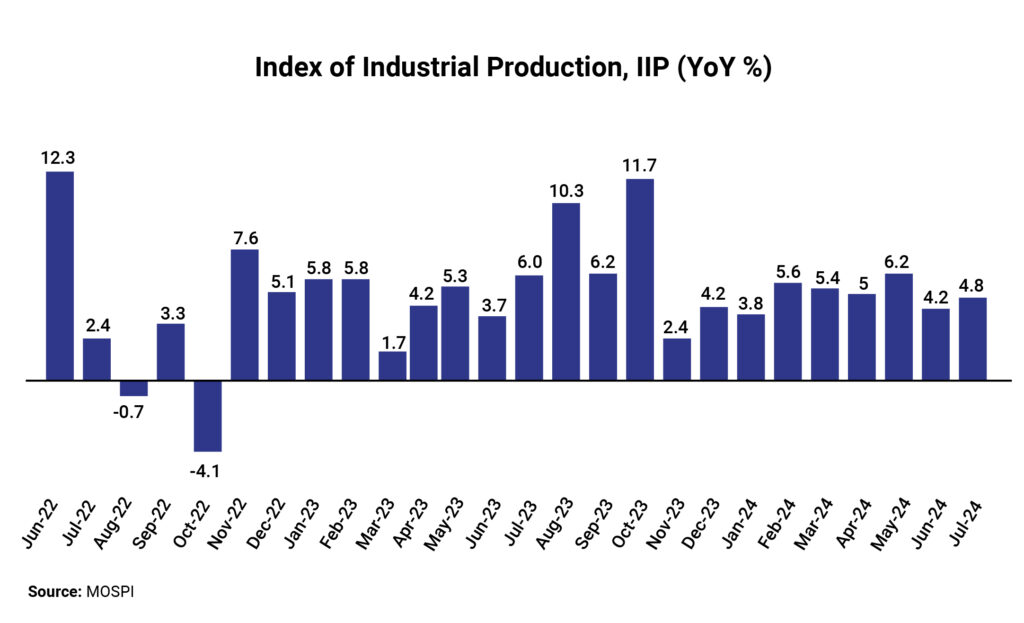
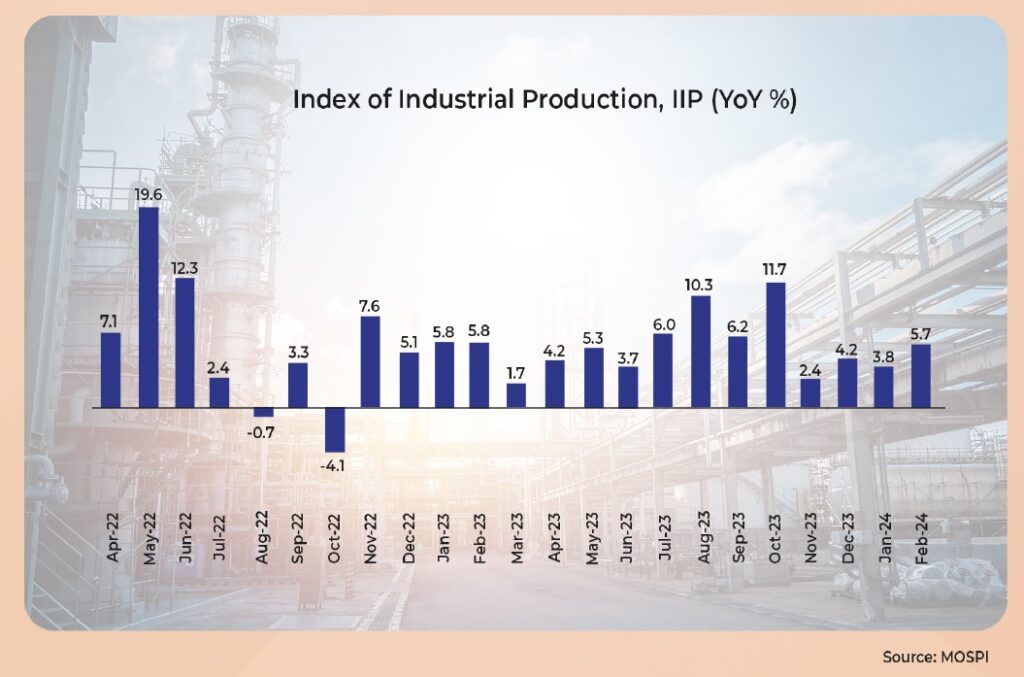
The growth in India’s industrial output, which is measured by the Index of Industrial Production (IIP), fell to an 8-month low of 2.7% YoY in April 2025 from an upwardly revised 3.9% in March 2025. This decline is attributed to the deceleration in mining and electricity sector growth. Mining sector output shrank 0.2% YoY, the lowest since August 2024, while the electricity sector output growth slowed to 1.1% YoY considering the early start of monsoons. This happened despite the 3-month high growth in the manufacturing sector, the largest in the IIP core sectors, to 3.4% YoY in April 2025. Within the sector, 16 of 23 industry groups showed positive growth in April 2025.

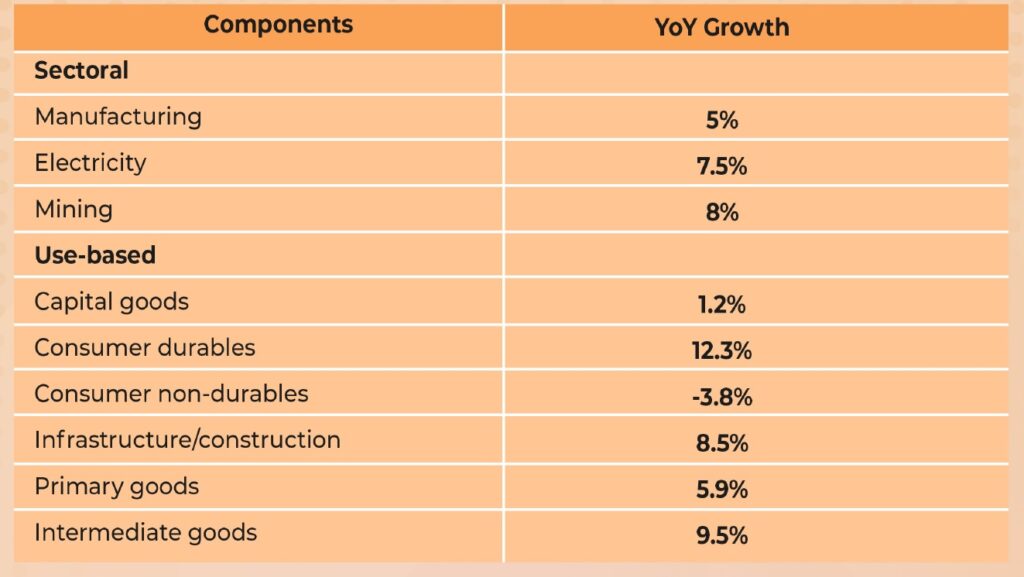
By use-based classification, capital goods reported the strongest growth of 20.3% YoY, which was an 18-month high, followed by consumer durables (6.4%), intermediate goods (4.1%), and construction goods (4%). Consumer non-durable goods remained in the negative territory with a 1.7% fall in output, indicating weakness in private consumption. While external headwinds remain a concern, domestic demand led by government spending, favourable rural outlook, and low energy prices is expected to boost domestic growth.

India’s Q4 Growth Suprises, FY26 outlook remains positive

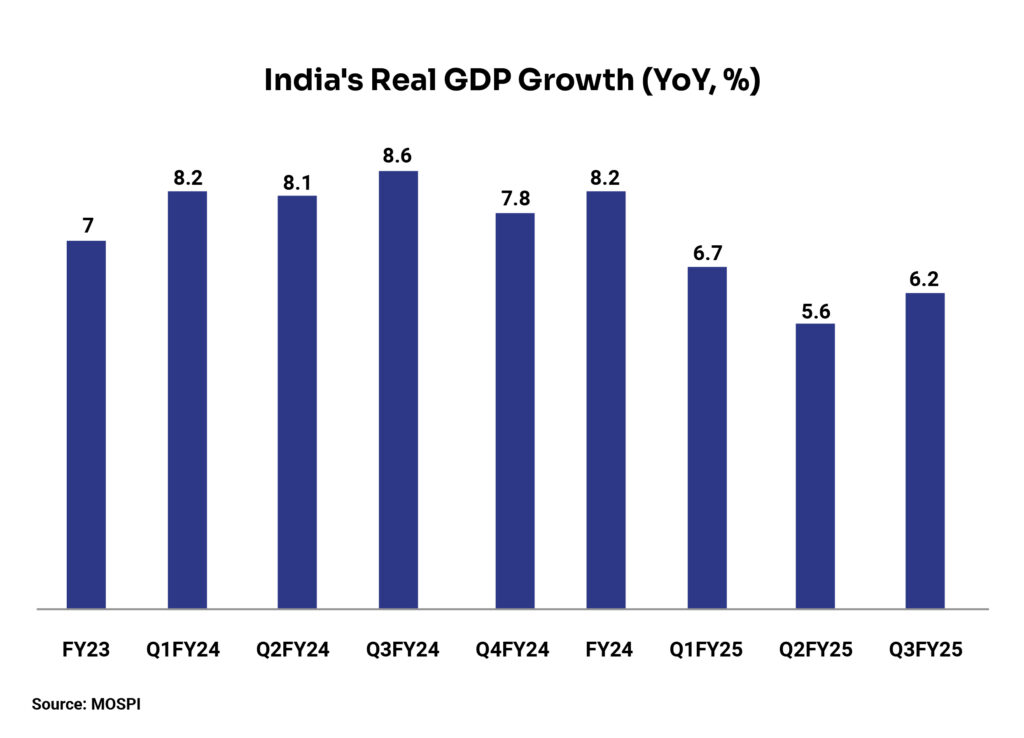
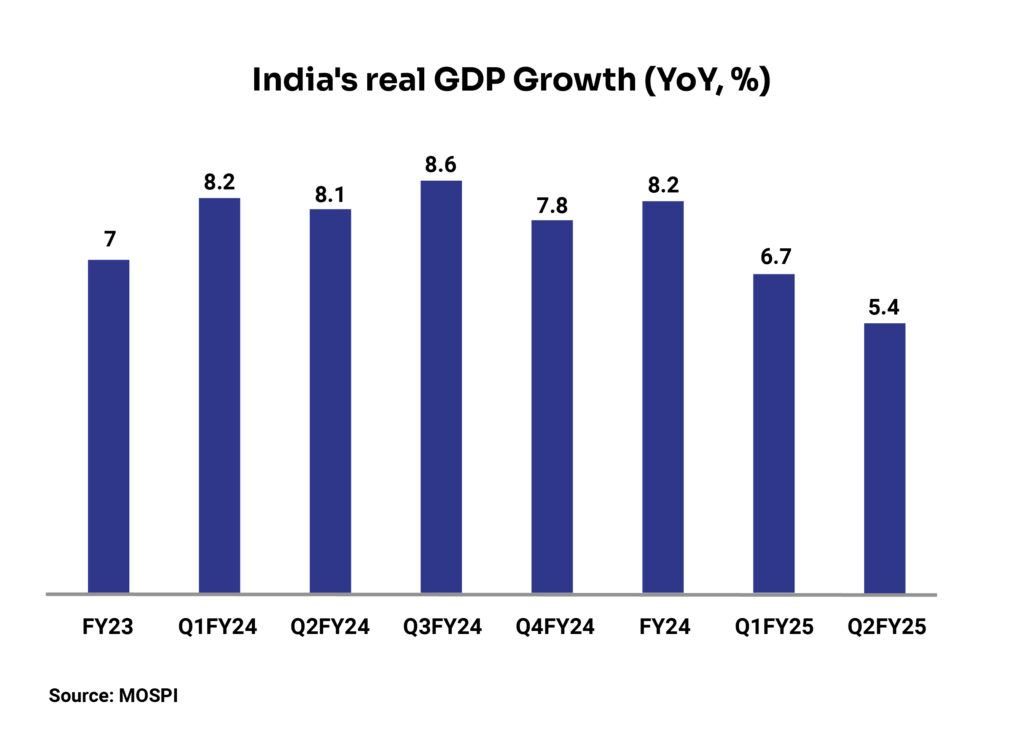
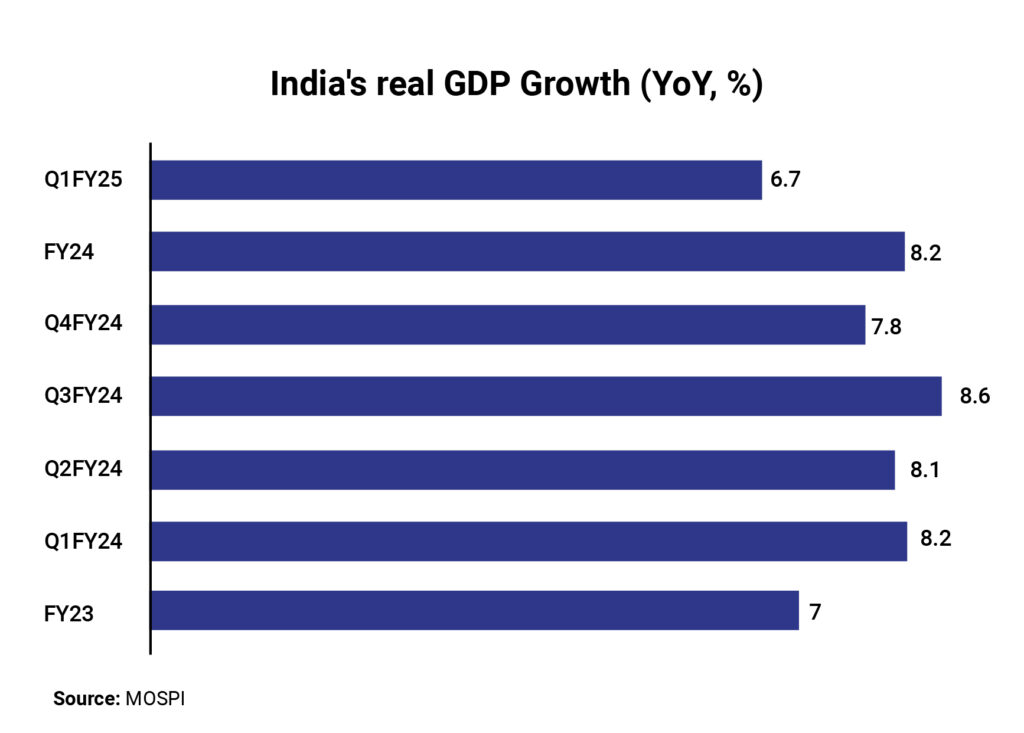
India’s real GDP growth in Q4FY25 came in at 7.4% YoY, surpassing the market estimates by 40 basis points as well as the previous quarter’s growth of 6.4%. The 5-quarter-high growth is attributed to higher agriculture output led by foodgrain production and acceleration in industrial activity led by manufacturing, construction, and mining activities even though private consumption demand has slowed down due to weak urban demand.

The higher-than-expected Q4 growth led to an expected growth of 6.5% YoY for FY25, which is not overwhelming though as it decelerated to a 4-year low. The slowdown is attributable to lower growth in Industrial (5.9% in FY25 vs. 10.8% in FY24) and Services (7.2% in FY25 vs. 9% in FY24) activities. The agriculture sector was the shining star in the year with growth accelerating to 4.6% in FY25 from 2.7% in FY24 due to record Kharif production, favourable monsoon, and improved rural demand.

Going forward, the GDP growth is expected to be positively driven by a recovery in urban demand led by tax cuts and sustained low inflation level, buoyant rural demand on the back of above-normal monsoon and higher foodgrain production, lower crude prices, and continued monetary easing by the central bank (at least an additional 25 bps cut after June meeting). However, geopolitical tensions and a fall in demand for India’s exports due to a slowdown in the US economy will be concerns affecting the growth in the current fiscal year.

Global crude oil market falters, further dips are likely

Global crude oil prices (Brent) declined ~21% from the January peak of ~US$82/barrel to ~US$65/bbl on June 5th. This is the first time in nearly four years that crude oil prices have dipped below US$70 owing to several factors. However, the downward trajectory is expected to continue!

Demand side concerns due to a potential slowdown in the US, China, and global growth led to the primary fall in prices. The Organisation for Economic Cooperation and Development (OECD) recently lowered its global economic growth outlook from 3.3% in 2024 to 2.9% in 2025 and the next year, with the slowdown expected to be heavily concentrated in the US, Canada, Mexico and China. What added fuel to the fire was the Organization of the Petroleum Exporting Countries Plus (OPEC+) move on May 3 to a collective output hike of 4,11,000 barrels per day (bpd) from June. The oil cartel decided to raise production for the third month in a row leading to further dips in crude prices. OPEC+ steadily reversed nearly half of the 2.2 million bpd “voluntary” output cuts announced by eight of its members in 2023, which was meant to raise global oil prices. It is highly likely that the full 2.2 million bpd cut will be materialised by October 2025. The International Energy Agency (IEA) predicted oil demand to grow by a meagre 0.73% adding to the pain of an oversupplied market.

US inflation falls to its lowest level in over 4 years

Consumer price inflation in the US dropped to 2.3% in April 2025 from 2.4% in March, which is the smallest annual increase since February 2021. The consumer price index rose 0.2% in April on a seasonally adjusted basis below the market forecast of a 0.3% increase. The prices for gasoline and fuel oil fell sharply (-11.8% and -9.6% MoM, respectively) leading to a 3.7% decline in the energy index, which continued its declining trajectory. The other factor contributing to the slowdown in inflation was the food index, which fell 2.8% MoM primarily driven by a 12.7% decrease in egg prices.

The US Federal Reserve held the repo rate steady in its last meeting citing upside inflation risks. The US Fed kept the federal funds rate unchanged at 4.25%-4.5%, extending its pause in rate cuts since January. Hence, despite falling inflation, the US Fed is unlikely to cut rates in the near term due to concerns about tariff-led inflation.


Disclaimer:

The details mentioned above are for information purposes only. The information provided is the basis of our understanding of the applicable laws and is not legal, tax, financial advice, or opinion and the same subject to change from time to time without intimation to the reader. The reader should independently seek advice from their lawyers/tax advisors in this regard. All liability with respect to actions taken or not taken based on the contents of this site are hereby expressly disclaimed.
Why private credit funds make sense for MFDs?

As per a recent EY report, in April-September 2024, India witnessed an investment of USD 3.3 billion in private credit deals. Further, in CY 2024, private credit deals reached USD 9.2 billion over 163 transactions, a 7% increase over the previous year.

Although, on the global level, private credit is dominated by institutional players, India is witnessing growing participation from individual investors through Category II AIFs focused on private credit.

What are private credit funds?

Broadly speaking, private credit means the loan extended to a private company, which may not otherwise be able to access the traditional loan market due to their exposure or some short- or medium-term financial issues.

The private credit funds provide non-bank loans to private companies, which majorly are mid-market firms. These loans are often structured, negotiated privately, and are not traded on public markets.

Generally, private credit funds provide higher than conventional debt products, compensating for the relative illiquidity and higher credit risks.

How do they matter to MFDs?

Private credit funds offer differentiated investment vehicles for wealthy investors who do not want to indulge with traditional debt products. These funds allow MFDs to provide high-yield options, believes Kolkata MFD Vikash Baid, Managing Partner, Trust Capital LLP.

Vikash feels that many MFDs now manage above Rs.200 crore. These MFDs handle at least 10-15 HNIs. And debt funds offered by mutual funds do not offer attractive yields due to their structure. “If these MFDs will not sell private credit funds, someone else will. Many HNIs like private credit funds as they offer stability to portfolio and visibility of cash flows,” he adds.

Munish Randev, Founder and CEO of CERVIN Family Office, said, “Private credit makes a lot of sense when the interest rates are already down because in that case traditional debt instruments offer only about 6-7% returns, which may not satisfy seasoned investors.”

These funds provide sophisticated investment strategies, which means that MFDs, by introducing them to their clients, can build deeper trust and long-term loyalty, he added.

Apart from that, closed-ended nature of many private credit AIFs may result in a more predictable business cash flow for the MFDs, said Munish.

Here are the key benefits for MFDs:

  • Traditional debt instruments available with the MFDs have struggled to deliver attractive post-tax real returns while the private credit funds offer yields in the range of 10–15%, depending on the risk-return profile and structure
  • For HNIs, family offices, and risk-aware clients, such products become an alternative that delivers meaningful income without entering equity-like volatility
  • Incorporating private credit funds allow MFDs to diversify their clients’ portfolios beyond traditional equity and debt
  • With these products, MFDs can introduce their clients to non-mainstream, institutional-grade opportunities making their offerings different than others
  • These products can help the MFDs in expanding their business to the HNI and wealthy clients for whom differentiation and exclusivity is a major factor for strong and permanent relationships
  • Higher ticket size and longer lock-in period means larger AUM and more predictable cash flow for business

In conclusion, private credit funds can help the MFDs become more relevant to a newer, more evolved investor class. Its longer lock in periods will result in longer association with the clients which can result in more strong and long-lasting relationships.


Disclaimer: The information provided in this article is for general informational purposes only and is not an investment, financial, legal or tax advice. While every effort has been made to ensure the accuracy and reliability of the content, the author or publisher does not guarantee the completeness, accuracy, or timeliness of the information. Readers are advised to verify any information before making decisions based on it. The opinions expressed are solely those of the author and do not necessarily reflect the views or opinions of any organization or entity mentioned.

Private Credit AIFs: A look into the market and strategies

Private credit provides an alternative source of financing for businesses with unique funding needs and irregular cash flows. Such financing takes place via asset managers involving a private credit/alternative investment fund (AIF) that intermediates between the ultimate lender and borrower.

Globally, the private credit market started gaining pace after the financial crisis in 2008 as banks retreated from riskier lending to small and mid-sized businesses and to companies backed by Private Equity. A decade later, a massive debt crisis in India caused the Reserve Bank of India to put a tight leash on NBFCs enabling private credit players to expand their horizon.

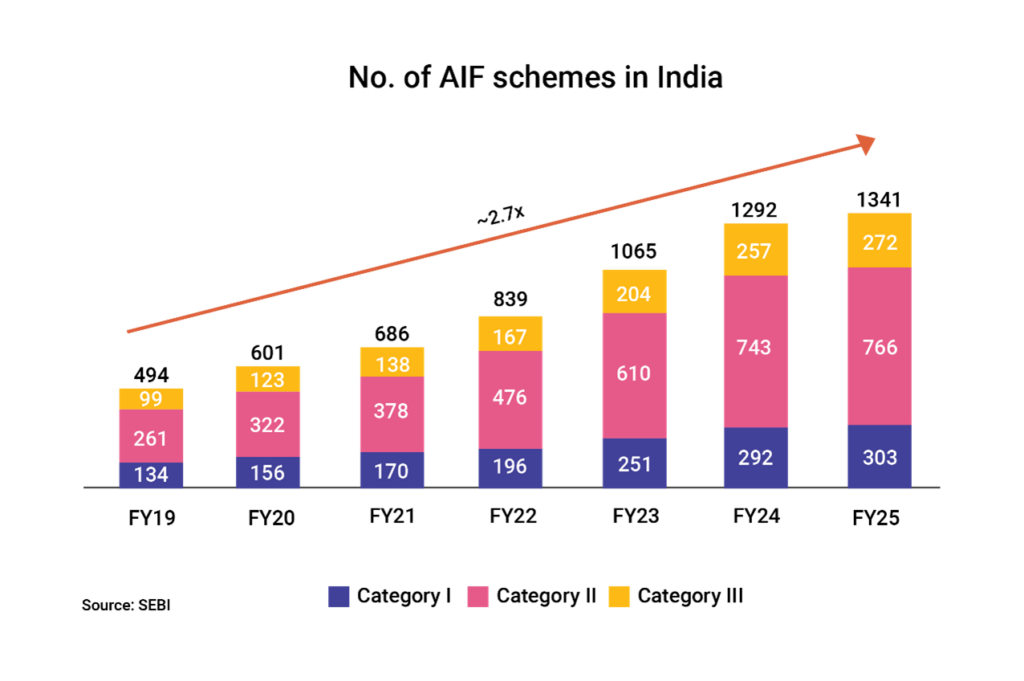
At a broader level, domestic AIFs have continued to exhibit secular growth in the recent past with majority of the incremental funds raised in Category II and Category III. In Category III, the ratio of investments in listed securities to unlisted securities is significantly higher (~95:5) with equities predominating such investments. Meanwhile, the growth in Cat II funds has been contributed by the Private Credit segment with debt investments contributing 35 to 40% to the segment as per data released by SEBI.

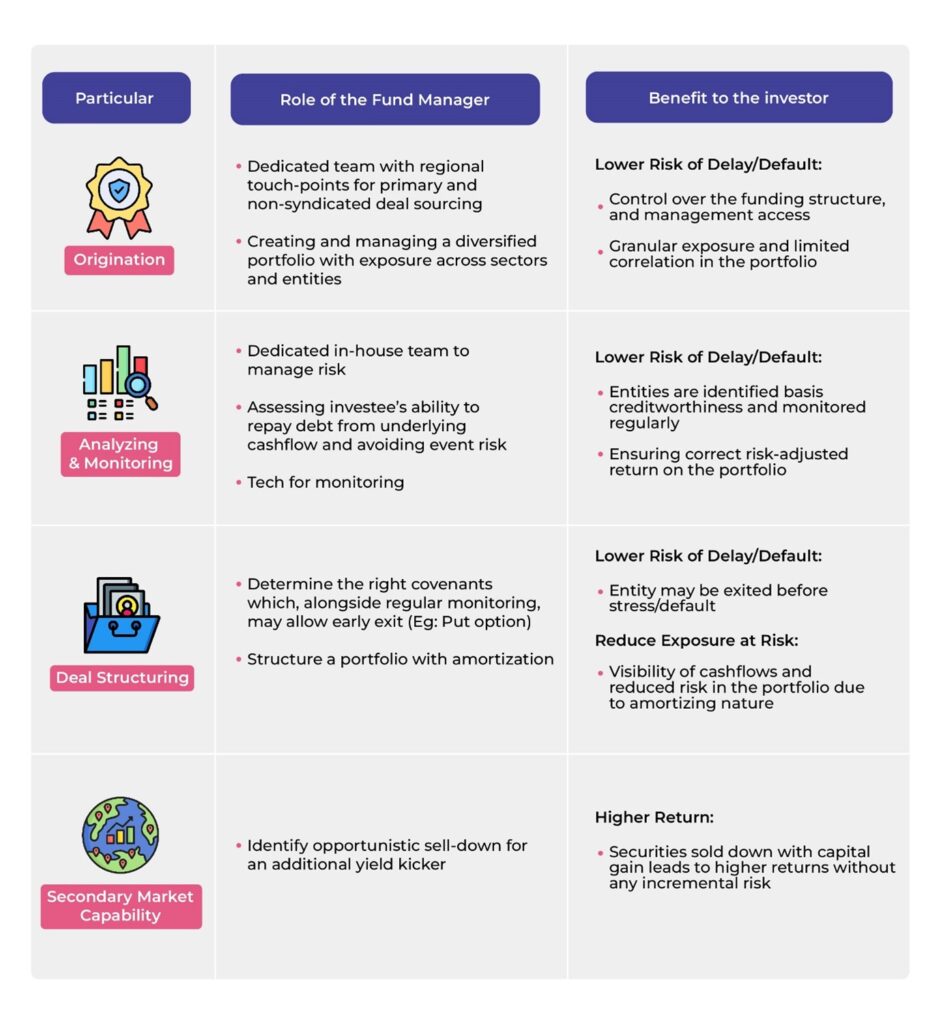
Private Credit AIFs have also become increasingly attractive to HNIs, family offices, and institutions to generate real returns. However, investing in the space requires a highly professional fund manager involving a dedicated team with regional touchpoints for primary and non-syndicated deal sourcing and possessing the capability and tech for high-level risk management and monitoring.

The strategies adopted by Private Credit AIFs are determined by the type of entities the funds invest in and their stage in the business cycle. Broadly, the following are the strategies adopted by such funds:

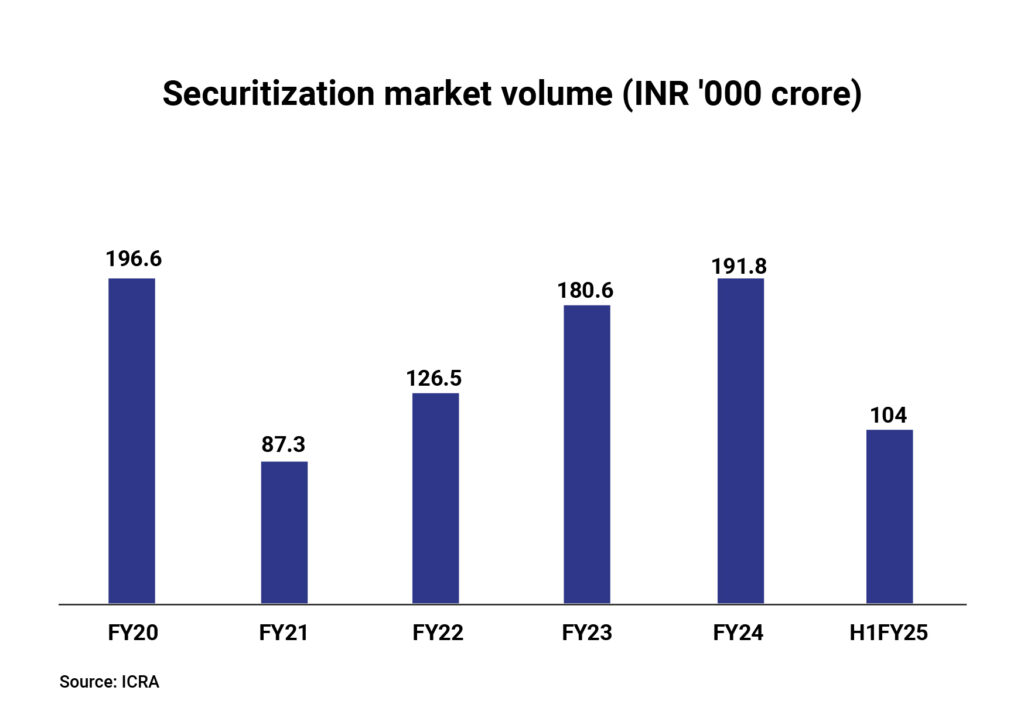
  • Structured Debt: Structured Debt funds use a mix of fixed-income and equity strategies and provide a degree of both capital protection and capital appreciation to investors. These types of debt funds invest the majority of the portfolio in fixed-income securities and offer principal repayment along with interest payments. Some structured debt funds also imply pooling similar debt obligations and selling off the resulting cash flows via a securitization process. The pooled assets are repackaged as interest-bearing securities, which are issued to investors.
  • Performing Credit: Performing Credit strategies seek to make debt investments in mid-market operating companies. While banks meet their standard funding needs, private credit AIFs who understand this space and can take a ground-up approach stand to benefit by offering structured solutions for specific requirements such as working capital correction, last mile capex, and product development financing, among others. The investee companies in such funds have strong business models owned by accomplished promoters and are typically repaying debt through operational cashflows. These strategies seek to generate high risk-adjusted returns while at the same time providing predictability and stability.
  • Venture Debt: Venture Debt strategies invest in companies that already have venture capital backing to provide them funding for working capital or capital expenses, such as equipment purchases. Unlike Performing Credit, venture debt is available to start-ups and growth companies that might not have positive cash flows or significant assets to use as collateral.
  • Distressed Debt: Distressed Debt aka Special Situations strategies invest in mid-market companies that have an element of distress, dislocation, or dysfunction and are perceived to be undervalued by the manager. The investment is done with the intention to either gain control or exert influence over the investee firm. The returns are dependent on the manager’s ability to exit the business after a successful turnaround.


Disclaimer: The information provided in this article is for general informational purposes only and is not an investment, financial, legal or tax advice. While every effort has been made to ensure the accuracy and reliability of the content, the author or publisher does not guarantee the completeness, accuracy, or timeliness of the information. Readers are advised to verify any information before making decisions based on it. The opinions expressed are solely those of the author and do not necessarily reflect the views or opinions of any organization or entity mentioned.

The Pulse – Insights on key macroeconomic data and events (April 2025)

“My gut tells me that uncertainty for the path of the economy is extremely elevated.” – Jerome Powell, US Fed Chair


Executive Summary

Tariffs dominated the month with liberation day tariffs turning out to be more severe than market anticipation. This triggered a strong risk off market reaction. Typical risk-off moves are associated with a stronger dollar and softer US yields, but this time it was different with fading US exceptionalism theme dominating market sentiments, strong sell-off in longer tenor US treasury yields, and a weaker dollar. The eventual pause on tariffs saw some normalcy return to the market with risk assets rallying. However, the chain of events has shaken investor confidence about US supremacy, depicted by a sharp rally in gold this year (almost 30% YTD), and US treasuries and the dollar losing value. Markets will likely continue to watch the tariff space as it progresses towards the pause deadline.

On the domestic front, the central bank followed up with another unanimous rate cut in April with the underlying dovish tone. In addition to the cuts, the series of liquidity infusion operations into the banking system led to a sharp rally in the rate curve. INR also appreciated against the dollar on the chatter of large inward flows. Market positioning of USD-INR was also long, which exacerbated the move as market participants stopped out. However, a recent chain of events with respect to geo-political tensions poses a risk to domestic markets and the space will be watched closely for escalations. So far, the sell-off is contained across asset classes domestically. We expect RBI to intervene whenever necessary to stem any sharp currency depreciation pressures.

Retail inflation falls to near 6-year low, more repo rate cuts are likely

India’s retail inflation declined marginally by 27 basis points (bps) on a month-on-month (MoM) basis to 3.34% in March, which is the lowest point in nearly 6 years. Although marginal on a MoM basis, the fall is much more pronounced (287 bps) when compared to the 2024 peak. The lower inflation is largely attributed to the decline in food inflation led by falling prices of vegetables, eggs, pulses, spices, and meat and fish. In the food basket, the deceleration in vegetable prices have been more intense as they went up by 42% YoY in October 2024 and dropped to a 21-month low of -7% YoY in March 2025.

The drop in food inflation also led the producer’s prices or wholesale inflation to decline to a 4-month low of 2.05% in March. Wholesale food prices eased from 2.38% in February to 2.05% in March driven by decline in vegetable prices.

With the 67-month low inflation print, the average inflation in Q4FY5 stood at 3.7%, which is lower than RBI’s prior estimate of 4.4%, while the average inflation for FY25 stood at 4.6%, lower than the same by 20 bps. Extreme heat during the summer may pose upside risks, however, a favourable base expects to keep inflation in check.

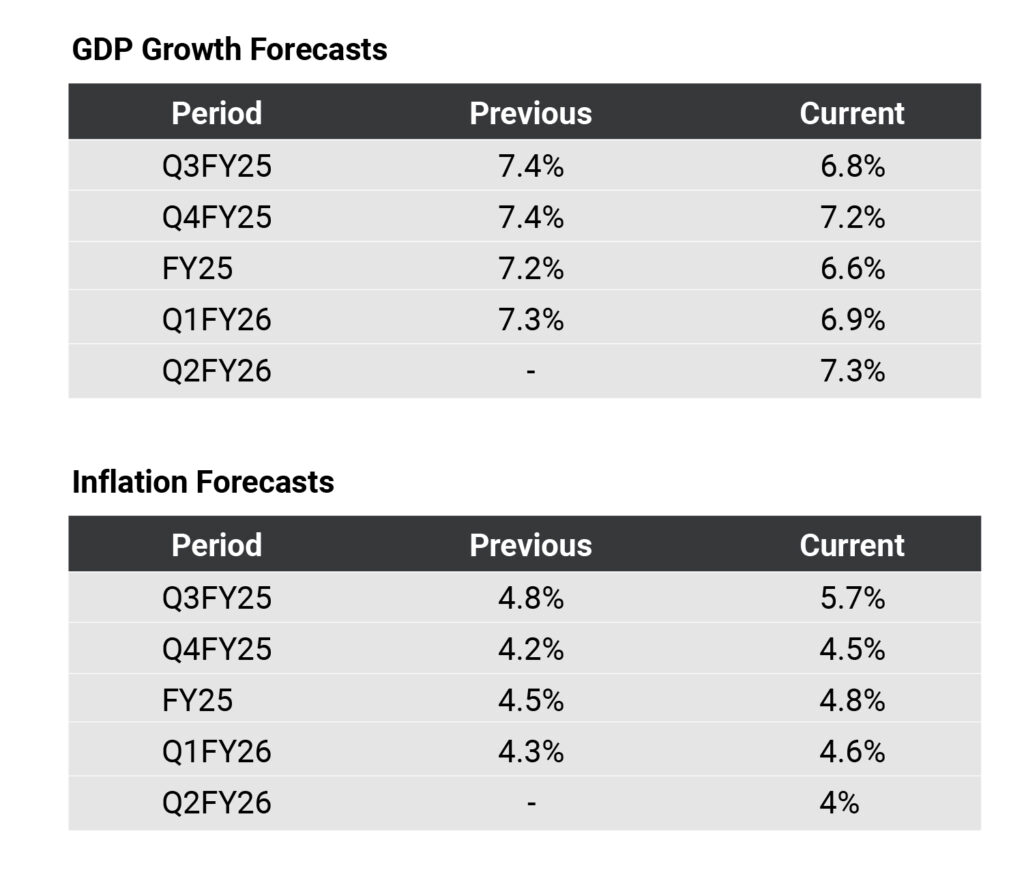
The deceleration in inflation is expected to provide RBI the needed comfort to continue with the rate cut cycle. Since the beginning of this calendar year, the central bank reduced repo rate by 50 bps to 6% with the early-April cut of 25 basis points. Due to a downside potential for domestic inflation led by lower global oil prices (with an expected pass through), expected normal monsoon and higher foodgrain production, a cumulative repo rate cut of another 50 bps is expected in this fiscal year. The rate cut cycle could get even deeper if the domestic economy experiences a slowdown below RBI’s growth projections for the year (6.5%).

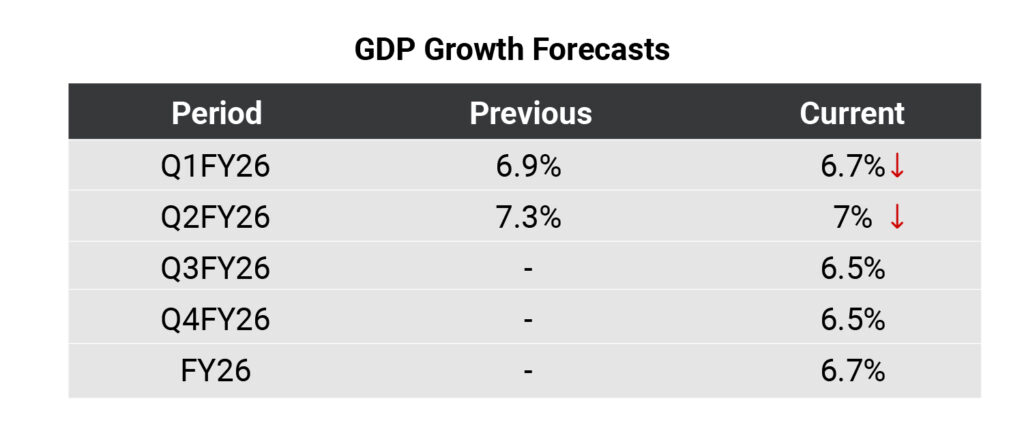
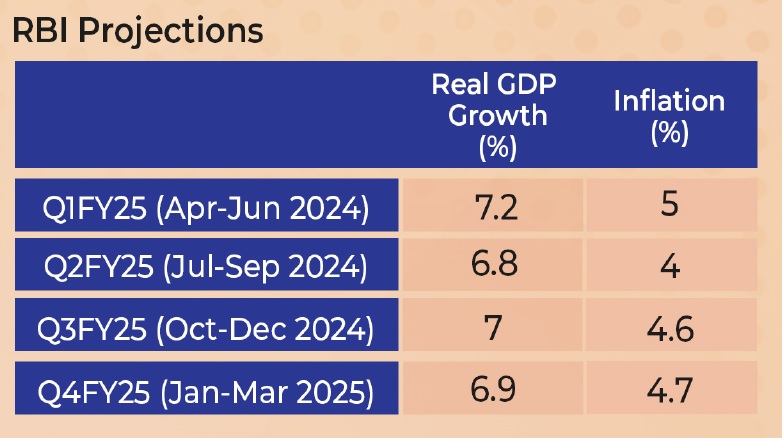
Following are the revisions in real GDP growth and Inflation forecasts announced by the RBI Monetary Policy Committee:

India`s industrial output growth dips to 4-year low

India’s industrial output, which is measured by the Index of Industrial Production (IIP), recorded a growth of 4% in FY25, reflecting a sharp deceleration from 11.4% in FY22. This slowdown in the industrial activity can be attributed to global economic uncertainty that is hampering trade and export growth, weak consumption demand, and a decline in private and government capital expenditure. Moreover, the data released by National Statistics Office (NSO), highlights the YoY slowdown in all the three sectors.

Manufacturing sector (largest in IIP basket) grew 3% YoY in March 2025 (versus 2.8% in February), but the growth slowed down significantly from 5.9% in March 2024. Electricity sector, considering the summer months, rose 6.3% in March 2025 (against 3.6% in February) but the growth was lower than 8.6% in March 2024. On the other hand, the mining sector growth dipped to 0.4% in March 2025 compared to 1.3% a year ago. In March 2025, the drop in the mining sector output was largely offset by the improvement in manufacturing and electricity sector.

India’s industrial output growth surpassed in March from the downwardly revised estimate of 2.7% in February driven by MoM growth in two of its three components, manufacturing, and electricity. While there has been an improvement in the IIP numbers post August 2024-low, they have become volatile in the following months. Looking ahead, the growth in IIP would be likely be determined by the intensity and impact of trade tariffs and favourable domestic drivers.

India’s unemployment rate at 7-year low, factors like upskilling and economic resilience at play

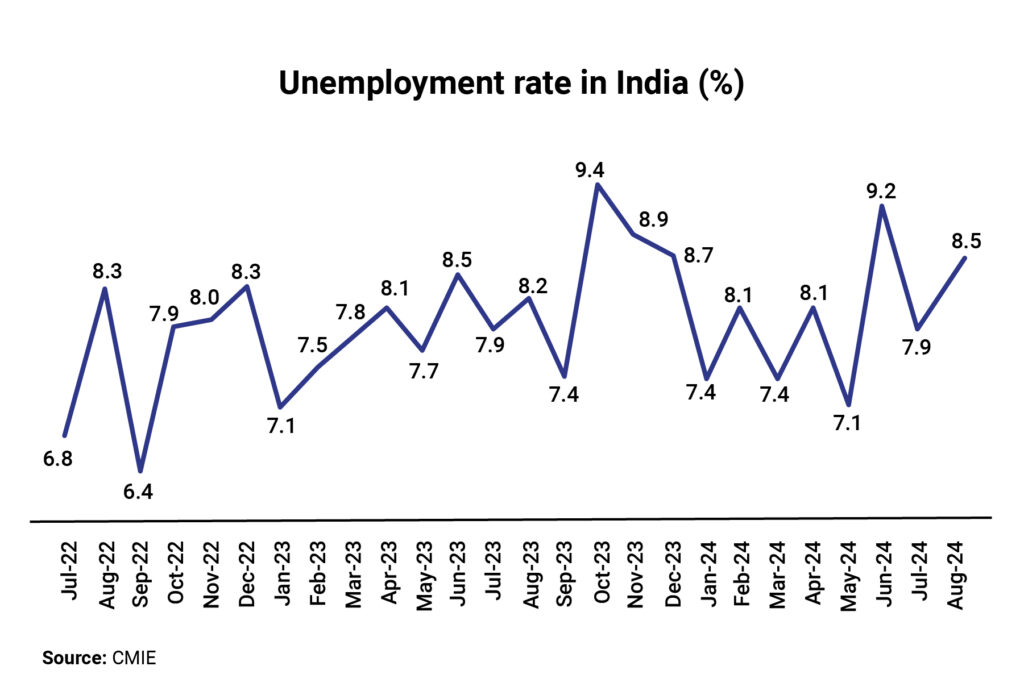
The unemployment rate in India declined to a 7-year low of 3.2% in 2024 from 6% in 2018 according to the Periodic Labour Force Survey 2023-24. The labour force participation rate (LFPR), which is measured as a percentage of people in the labour force i.e. the people who are working, seeking or are available for work, grew to 60.1% in 2024 from 49.8% in 2018. Thanks to the stable economic growth post pandemic, increasing women participation in the workforce, growing youth population, improved employment opportunities, and the government initiatives to develop skills and foster entrepreneurship.

In addition, the significant fall in urban and rural unemployment to 5% and 2.5% in 2024 from 7.8% and 5.3% in 2018, respectively has contributed towards the drop in the unemployment rate. As technologies evolve, there is a necessity to balance its impact on the workforce and to equip them with the necessary skills. Investing in technological advancement and implementing more flexible labour regulations could further strengthen the labour market.

US heads for negative quarterly growth 1st time in 3 years, trade deficit at record high

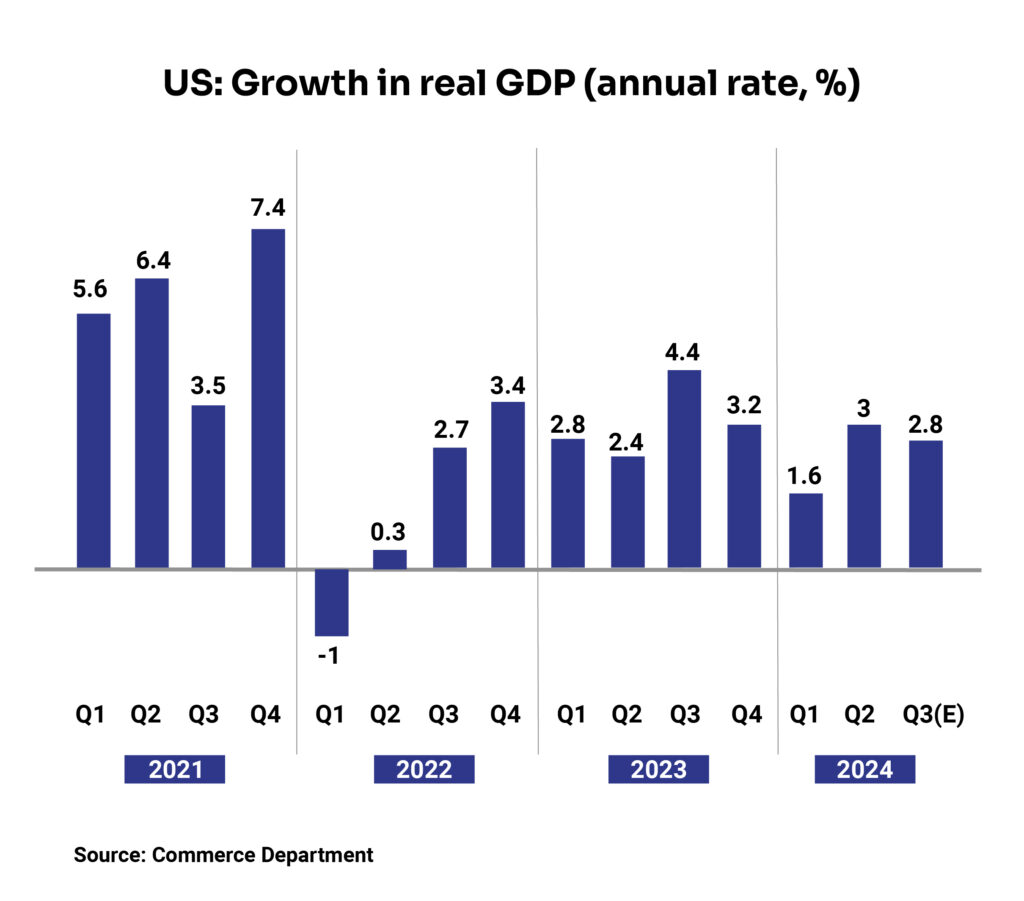
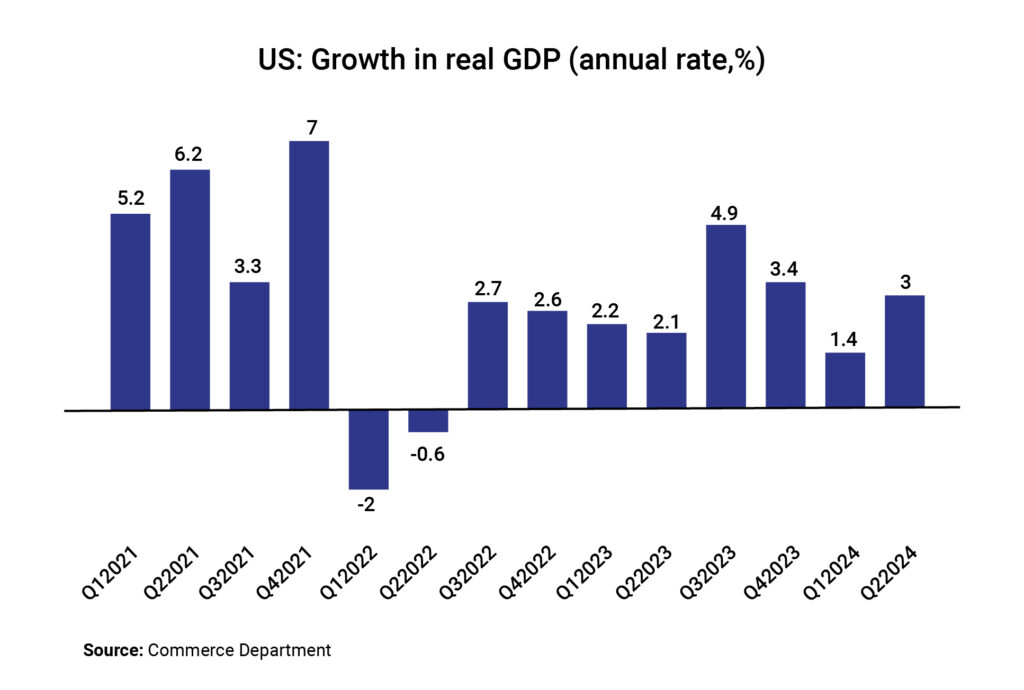
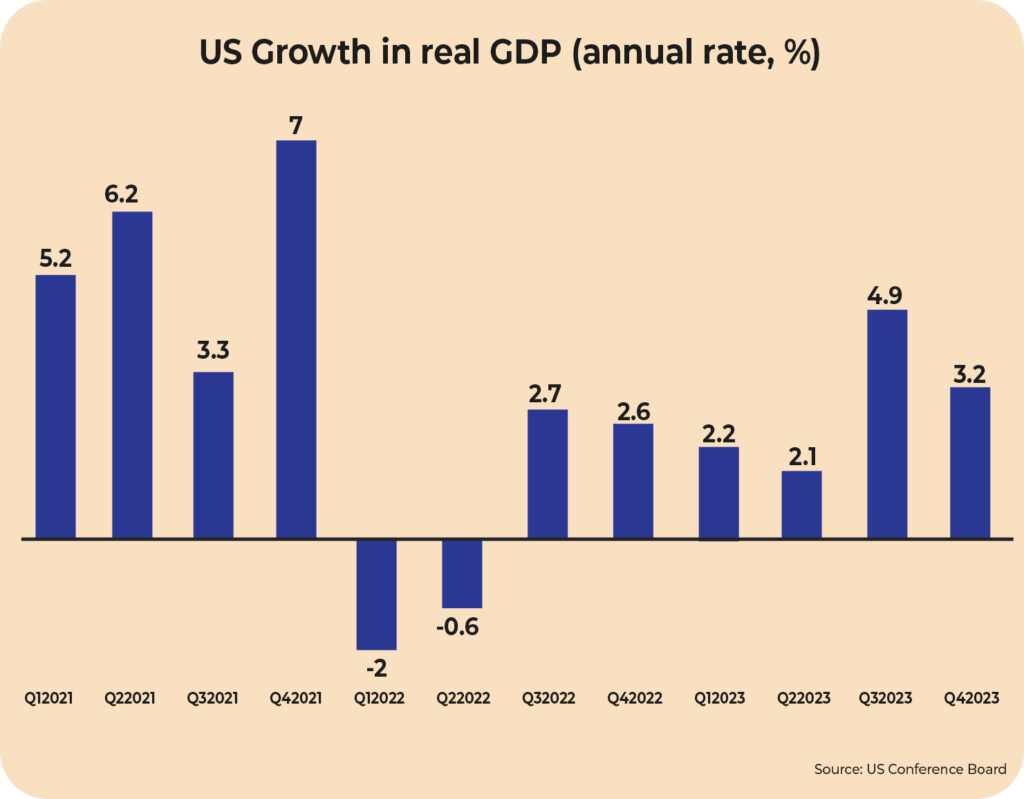
The US economy shrank for the first time in three years as advance estimates by the Bureau of Economic Analysis depicted a 0.3% annualised fall in GDP in the first quarter of 2025. It’s the first negative quarterly growth since the first quarter of 2022. Trump’s tariff play led to an unexpected rise in imports, as observed by many economists across the board. Imports surged 41.3% during the quarter, driven by a 50.9% increase in goods, which was the highest growth recorded, except during Covid times, since 1974. This happened as businesses front-run tariffs before its implementation in early April.

Apart from imports (with a 5-percentage points impact), the 5.1% decline in government spending due to cuts from the Department of Government Efficiency (D.O.G.E.) impacted the GDP growth by 0.3 percentage points. These were partially offset by growth in investment, consumer spending, and exports. Personal consumption rose (1.8%) but recorded the slowest gain since Q2 2023 while it rose 4% in the prior quarter. Private domestic investment surged nearly 22% driven by a 22.5% rise in equipment spending ahead of the tariff implementation.

It is yet to see whether the economy could rebound in the current quarter, which is enough to avoid a stagflation (a period of tepid growth and high inflation) after the drag from import goes away.

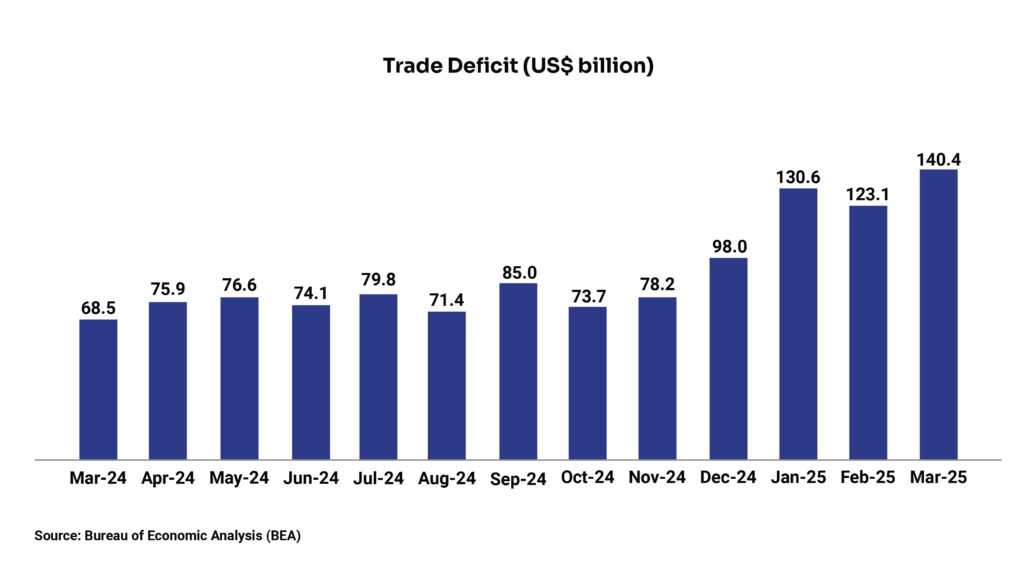
The higher import caused the US trade deficit to hit a record high of US$140.5 billion in March. Imports rose 4.4% to an all-time high of US$419 billion while exports went up 0.2% to US$278.5 billion, which was also a record high. The biggest contributor to imports was consumer goods, especially pharmaceutical, most of which originated from Ireland.

US inflation continues to ease but Fed awaits further cuts

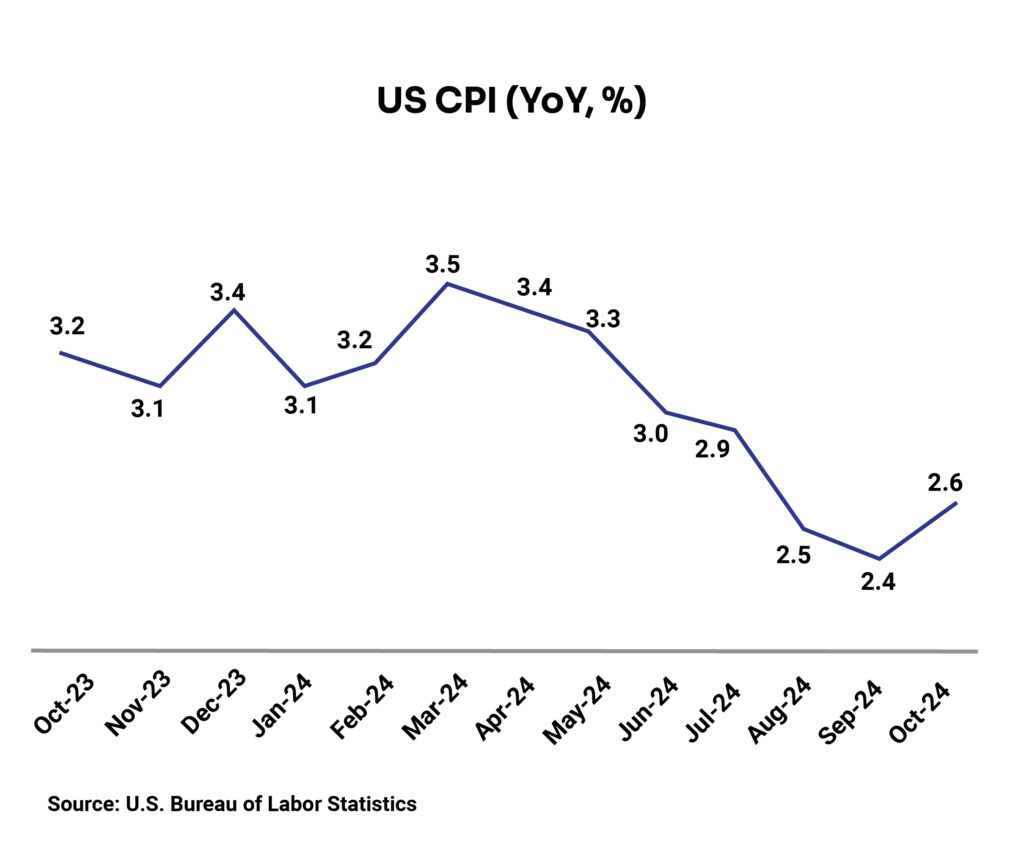
Consumer price inflation in the US came in at 2.4% YoY in March 2025, continuing the easing trajectory since the beginning of the year. The consumer price index declined a seasonally adjusted 0.1% in March, translating to a 12-month rate of 2.4% down from the January peak of 3%. Falling energy prices kept the inflation in check. Gasoline prices fell over 6% in the month leading to a broader 2.4% decline in the energy index. The secondary factor for the lower inflation was the drastic fall in travel-related costs, including airfares (fell 5.3% MoM) and hotel room tariffs (down 3.5%).

The US President has urged the Fed to cut interest rates, but the central bank held them steady in its recent meeting citing upside inflation risks. The US Fed kept the federal funds rate unchanged at 4.25%-4.5%, extending its pause in rate cuts since January. The Fed Chair Jerome Powell said a “great deal of uncertainty” remains about the implications of President Donald Trump’s tariff policy. As per market consensus, the US fed is unlikely to cut rates until June.

Disclaimer: The information provided in this article is for general informational purposes only and is not an investment, financial, legal or tax advice. While every effort has been made to ensure the accuracy and reliability of the content, the author or publisher does not guarantee the completeness, accuracy, or timeliness of the information. Readers are advised to verify any information before making decisions based on it. The opinions expressed are solely those of the author and do not necessarily reflect the views or opinions of any organization or entity mentioned.

Building a Scalable Data Lake with AWS S3 and Open-Source Technologies for the BFSI Sector

In today’s digital world, financial technology (fintech) companies manage vast amounts of structured and unstructured data. To handle this efficiently, data lakes have become essential. A data lake serves as a centralized repository that stores and processes large volumes of data, enabling organizations to perform forecasting, risk assessments, and compliance checks. It also helps companies gain insights into customer behaviour and drive innovation by allowing easy experimentation with new data sets.

To build a scalable and efficient data lake, Amazon Web Services (AWS) offers a powerful combination of services, including Amazon S3, Apache Airflow, and Apache Spark, which can run on AWS EMR (Elastic MapReduce) or EKS (Elastic Kubernetes Service). This article explores how these technologies work together to create a robust data processing system and their applications in the Banking, Financial Services, and Insurance (BFSI) sector.

AWS S3: The Foundation of a Data Lake

Amazon S3 is an object storage service designed for scalability, security, and durability. It provides a strong foundation for a data lake by supporting structured, semi-structured, and unstructured data formats. One of the key advantages of S3 is its high durability, ensuring that data is stored securely with minimal risk of loss.

Security is a critical aspect of any data lake, and Amazon S3 offers built-in access control mechanisms. It supports user authentication and provides fine-grained access management through bucket policies and access control lists. Additionally, S3 allows cross-region replication, enabling organizations to duplicate their data across different regions. This feature helps improve operational efficiency, meet compliance requirements, and reduce latency by storing data closer to users.

Airflow: Managing ETL Pipelines

Once data is stored in S3, organizations need a workflow management tool to automate Extract, Transform, and Load (ETL) processes. Apache Airflow is an open-source platform that enables users to programmatically create, schedule, and monitor workflows.

Airflow uses a Directed Acyclic Graph (DAG) approach, where each task in the workflow runs independently. DAGs can be scheduled and triggered based on specific events, with alerts for failures or errors. This makes Airflow an ideal solution for designing ETL pipelines, ensuring data is processed in an organized and automated manner before being analyzed.

Apache Spark: Big Data Processing at Scale

To process vast amounts of data efficiently, organizations rely on Apache Spark. Spark is an open-source, distributed computing system designed for high-speed data processing. It is particularly useful for fintech companies that deal with large datasets and need real-time analytics.

Spark operates using Resilient Distributed Datasets (RDDs), which are distributed collections of immutable objects. RDDs allow efficient data partitioning across multiple nodes in a cluster, enabling fast parallel processing. This makes Spark a powerful tool for building high-performance data pipelines that handle massive amounts of data with ease.

Amazon EMR: Simplifying Big Data Processing

Amazon EMR is a managed cluster platform that simplifies running big data frameworks like Apache Hadoop and Apache Spark on AWS. EMR allows companies to process and analyze vast amounts of data without the complexity of managing underlying infrastructure.

The core component of EMR is the cluster, which consists of multiple Amazon EC2 instances, known as nodes. Each node has a specific role within the cluster, contributing to distributed computing. EMR makes it easier for data engineers to run Spark jobs efficiently while ensuring scalability and cost-effectiveness.

Amazon EKS: Managing Containerized Workloads

For organizations looking for an alternative to EMR, AWS also provides Elastic Kubernetes Service (EKS), a managed Kubernetes service. EKS allows users to deploy and manage containerized applications efficiently without handling the complexities of Kubernetes infrastructure.

EKS provides multiple benefits, including:

  • No Kubernetes management overhead: AWS handles the control plane, reducing the need for manual maintenance.
  • Easy cluster scaling: Organizations can scale their Kubernetes clusters dynamically based on demand.
  • Cost savings: Since AWS manages the Kubernetes masters, companies only pay for the worker nodes they use.
  • High availability: EKS ensures uptime across multiple availability zones to prevent failures.
  • Enhanced security: EKS integrates with AWS security tools like Identity and Access Management (IAM) and Virtual Private Cloud (VPC) for better access control.

Applications in the BFSI Sector

The BFSI sector, including lending institutions and asset management companies, rely heavily on data-driven decision-making. Here’s how a data lake built with AWS S3, and open-source technologies can benefit these businesses:

  1. Lending and Credit Risk Analysis
  • Financial institutions can use a data lake to aggregate borrower data from multiple sources, including transaction histories, credit scores, and alternative data sources like social media behaviour.
  • Apache Spark enables real-time analysis of this data, helping lenders assess credit risk and detect fraudulent applications.
  • Machine learning models running on Spark and trained on historical lending data can predict loan defaults and suggest appropriate risk mitigation measures.
  1. Asset Management and Investment Strategies
  • Asset management firms use data lakes to store and analyze vast amounts of financial market data, including stock prices, economic indicators, and portfolio performance metrics.
  • By leveraging Spark on EMR or EKS, these firms can run predictive analytics and algorithmic trading models to optimize investment strategies.
  • Apache Airflow ensures that market data ingestion, processing, and reporting workflows run efficiently, reducing latency in decision-making.
  1. Regulatory Compliance and Fraud Detection
  • Compliance teams use AWS S3 to store structured and unstructured regulatory data, ensuring adherence to financial laws and regulations.
  • Spark’s ability to process large datasets in real time helps detect fraudulent transactions by identifying anomalies in customer behaviour.
  • Automated workflows in Airflow can generate compliance reports and trigger alerts when potential violations occur.
  1. Customer Personalization and Engagement
  • BFSI companies analyze customer transaction data stored in S3 to personalize banking and investment recommendations.
  • Spark’s in mem data processing & machine learning libraries help segment customers based on spending patterns, enabling targeted marketing campaigns.
  • Real-time customer insights enhance user experience by offering proactive financial advice and product recommendations.

Integrating these Technologies for a Scalable Data Lake

By leveraging AWS S3 for storage, Airflow for workflow automation and Spark for high-speed data processing on EMR or EKS, organizations can build a scalable and efficient data lake. This architecture enables fintech firms to store, process, and analyze data seamlessly while maintaining security and compliance.

With this powerful combination, companies can gain deeper insights into customer behaviour, improve risk assessment models, and drive business innovation – all while handling the ever-growing volume, variety, and velocity of financial data.


Disclaimer: The information provided in this article is for general informational purposes only and is not an investment, financial, legal or tax advice. While every effort has been made to ensure the accuracy and reliability of the content, the author or publisher does not guarantee the completeness, accuracy, or timeliness of the information. Readers are advised to verify any information before making decisions based on it. The opinions expressed are solely those of the author and do not necessarily reflect the views or opinions of any organization or entity mentioned.

The Pulse – A monthly digest of key macroeconomic events (March 2025)

“We believe that it will have a short-lived impact on inflation, but for growth, a trade war will be extremely detrimental” – Luis de Guindos, Vice President, European Central Bank


Executive Summary

Uncertainty continued to weigh on markets through the month with impending liberation day tariffs, with yields ending marginally softer for the month on softer data points. Fed kept rates on hold and the median dot plot remained broadly the same since the last reading indicating the central bank is not in a rush to act. However, projections showed signs of stagflation worries, with lower growth forecast and higher inflation forecast. The tariff announcement on key trading partners turned out to be more severe than what the market was pricing, triggering a sharp reaction across asset classes – stocks crashed, bond yields fell, and the dollar index traded weaker. The actual implementation deadline is still a couple of days away and there would be likely some negotiations and possible retaliations, in some instances.

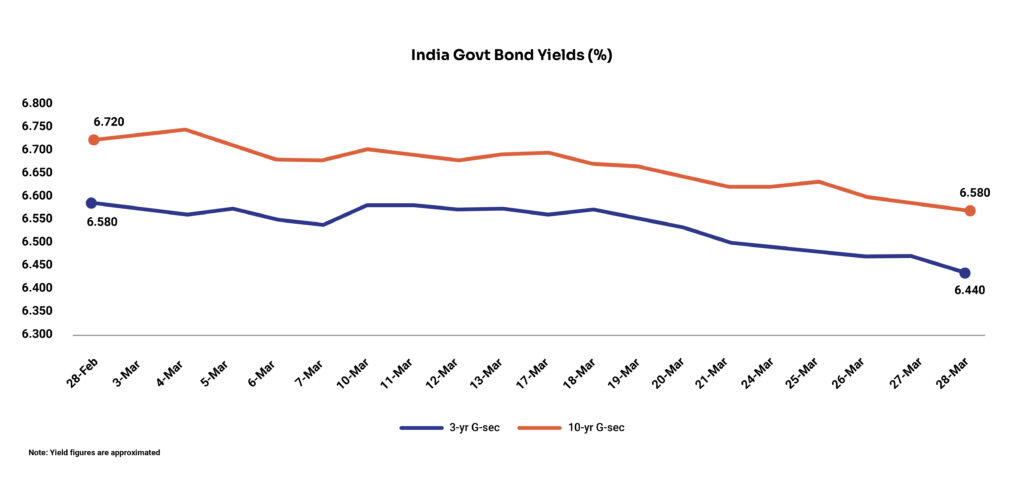
In continuation with measures to ease banking system liquidity, RBI announced more tranches of Open Market Operations and another foreign currency swap earlier last month. Steps were pre-emptive ahead of the seasonal year-end squeeze in March, being the fiscal year-end. There were positive data surprises last month with inflation coming in lower at 3.6%, led by softer food inflation, and IIP improved to 5%, led by a pick-up in the manufacturing sector. On the currency front, sharp lower movements in USD-INR caused the currency pair to drop ~2.3% last month, while FPI flows turned positive (including both debt and equity). With softer inflation and potential growth slowdown, we expect RBI to cut rates by another 25 bps and change its stance to accommodative in the upcoming April meeting.

Domestic Updates

India’s retail inflation plunges to 7-month low, wholesale inflation spikes

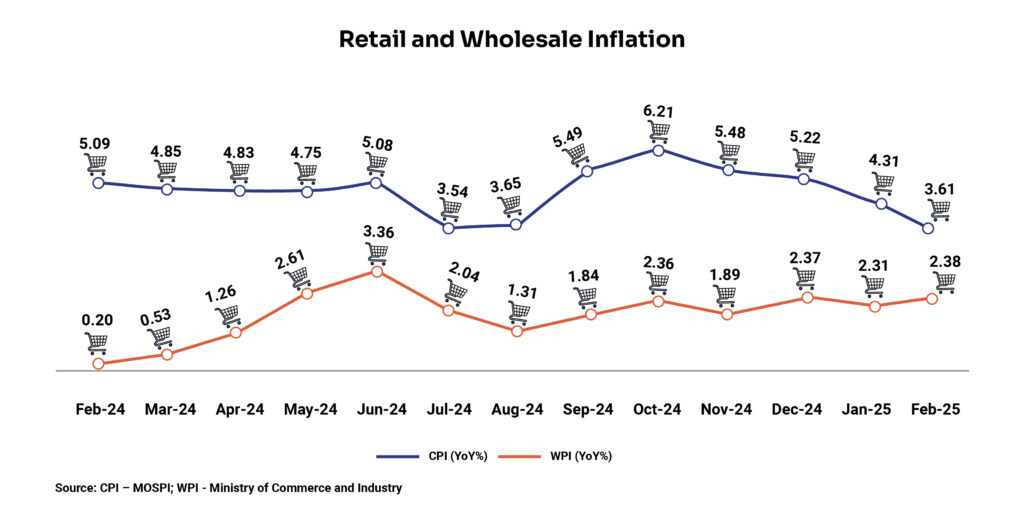
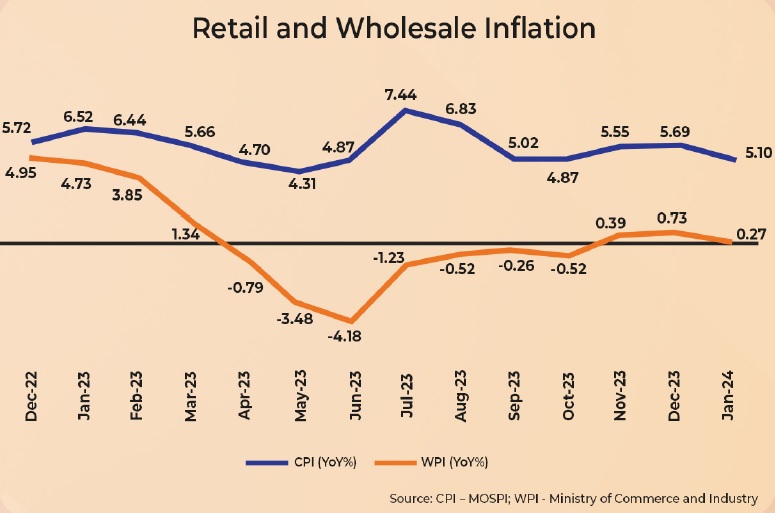
The retail inflation in India, measured by the change in the Consumer Price Index (CPI), moderated to a 7-month low of 3.61% YoY in February from 4.31% YoY in January. This is the first time since September 2024 that the inflation has dropped below the RBI`s medium-term target of 4%. The softening is attributable to food inflation that eased to 3.75% YoY in February, the lowest since May 2023. Vegetable deflation stood at 1.07% YoY in February compared to an inflation of 11.35% YoY in January. Along with vegetables, lower prices in eggs, meat, fish, pulses, and dairy products contributed towards the fall in inflation.

However, inflation based on the Wholesale Price Index (WPI) rose to an 8-month high of 2.38% YoY in February from 2.31% YoY in January led by lower deflation in fuel and power prices and higher costs in the manufacturing sector. The deflation for fuel and power declined to 0.71% YoY in February from 2.78% YoY in January whereas inflation for manufactured products increased to 2.86% YoY in February from 2.51% YoY in January. However, the food inflation declined to 5.94% in January from 7.47% in January, partially offsetting the rise in wholesale price inflation.

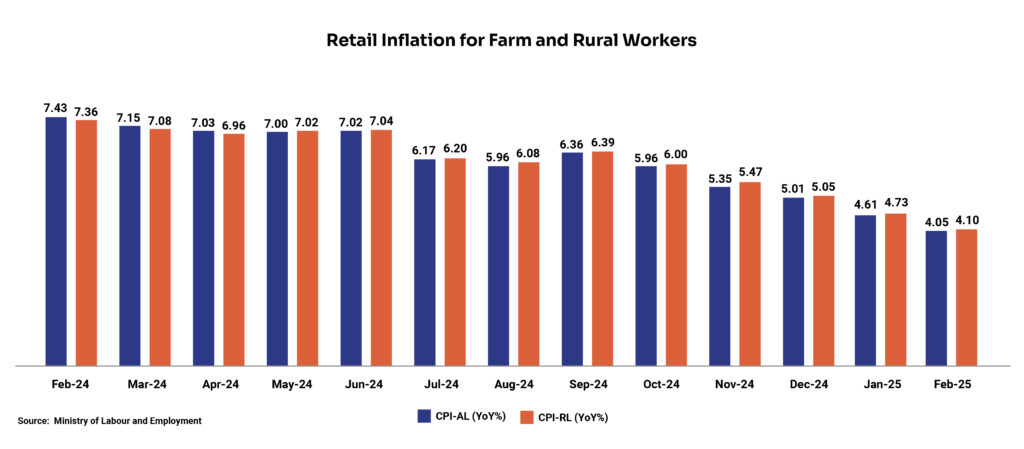
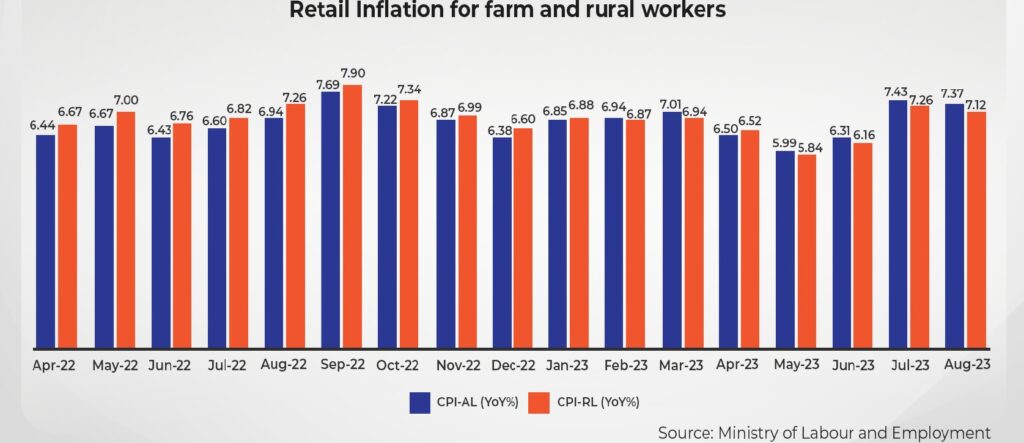
Meanwhile, retail inflation for farm and rural workers eased to 4.05% YoY and 4.10% in February respectively, from 4.61% YoY and 4.73% in the previous month. The retail inflation for farm and rural workers during the month is the lowest since November 2021.

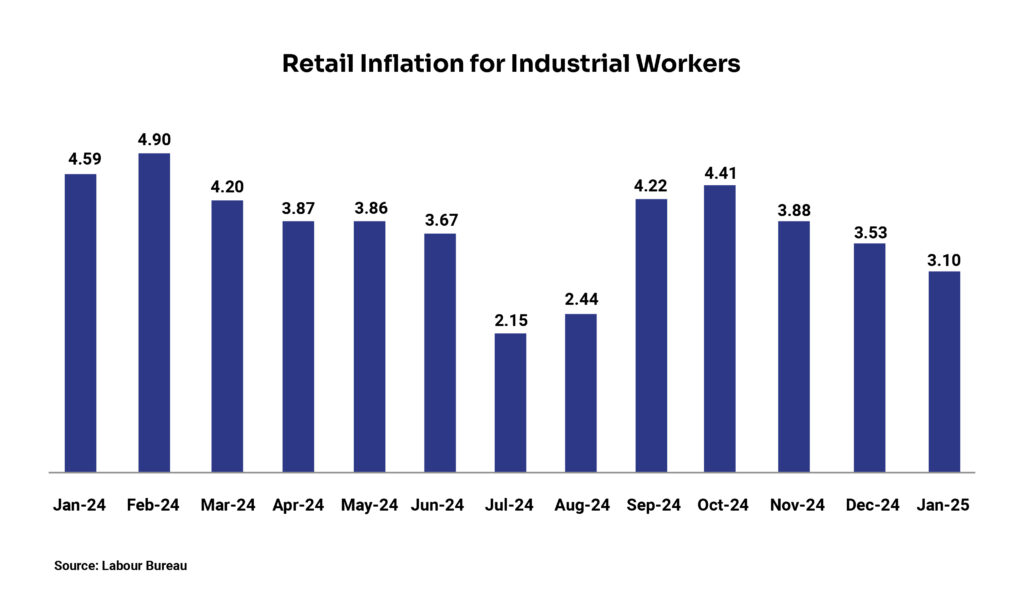
The retail inflation for industrial workers (IW) measured by the CPI-IW, moderated to a 5-month low of 3.10% in January 2025 from 3.53% in December.

India’s industrial output growth accelerates

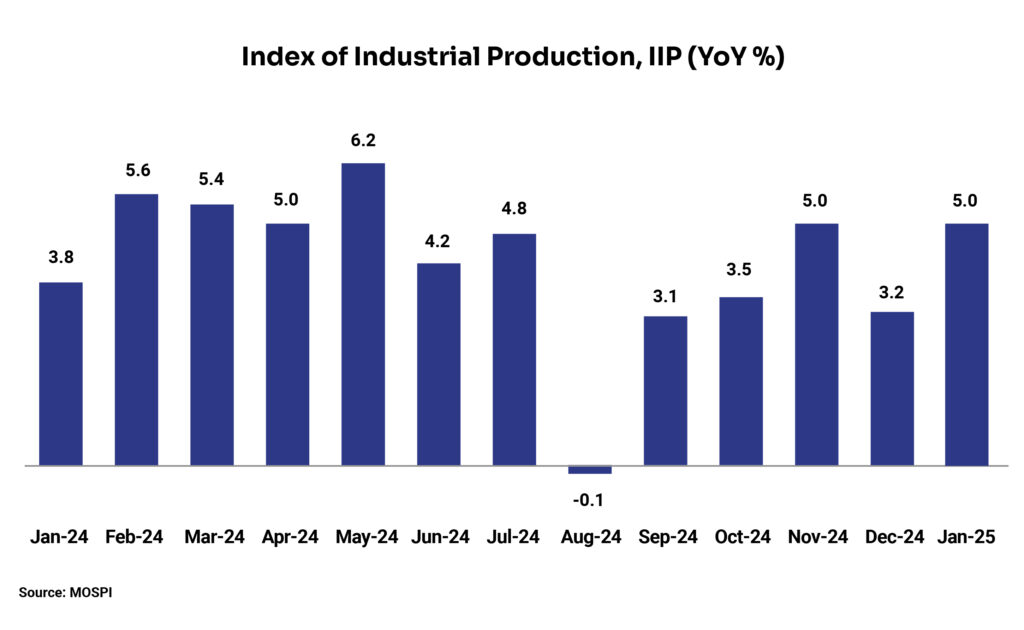
India’s industrial output, as measured by the Index of Industrial Production (IIP), grew 5% YoY in January 2025 compared to 3.5% in December primarily driven by the manufacturing sector. The manufacturing sector (largest in the IIP basket) output increased 5.5% in January compared to 3% in December as higher government spending in January provided support to industrial growth. Mining and electricity output grew 4.4% and 2.4%, respectively, during the month under review.

India`s GST collections register a sluggish growth

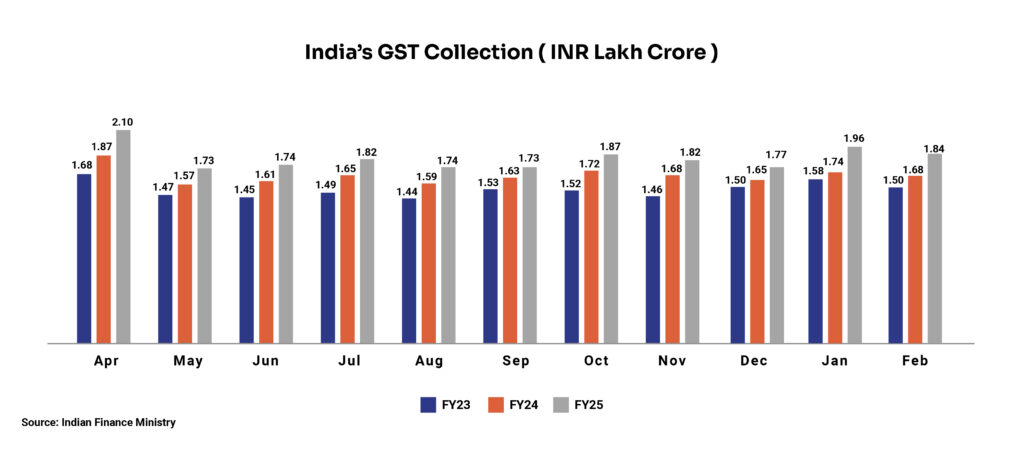
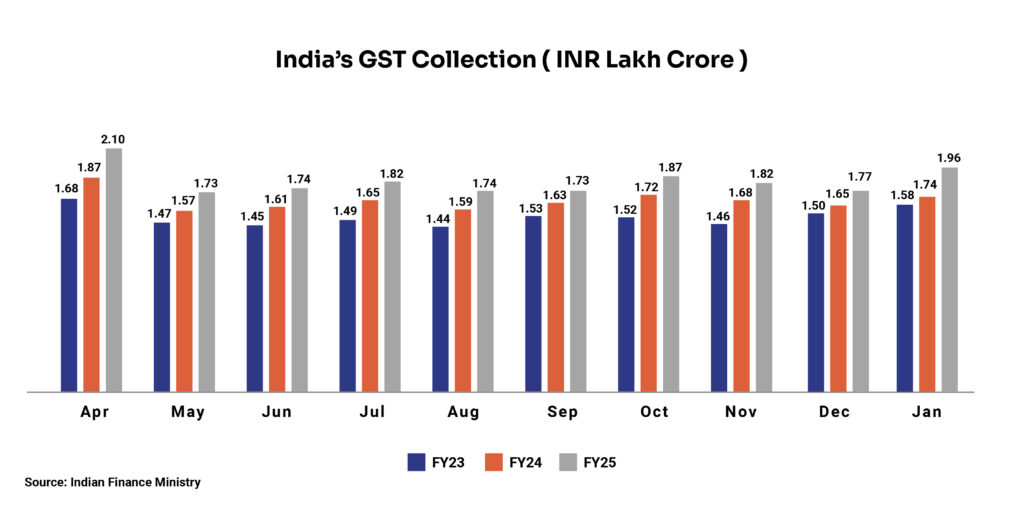
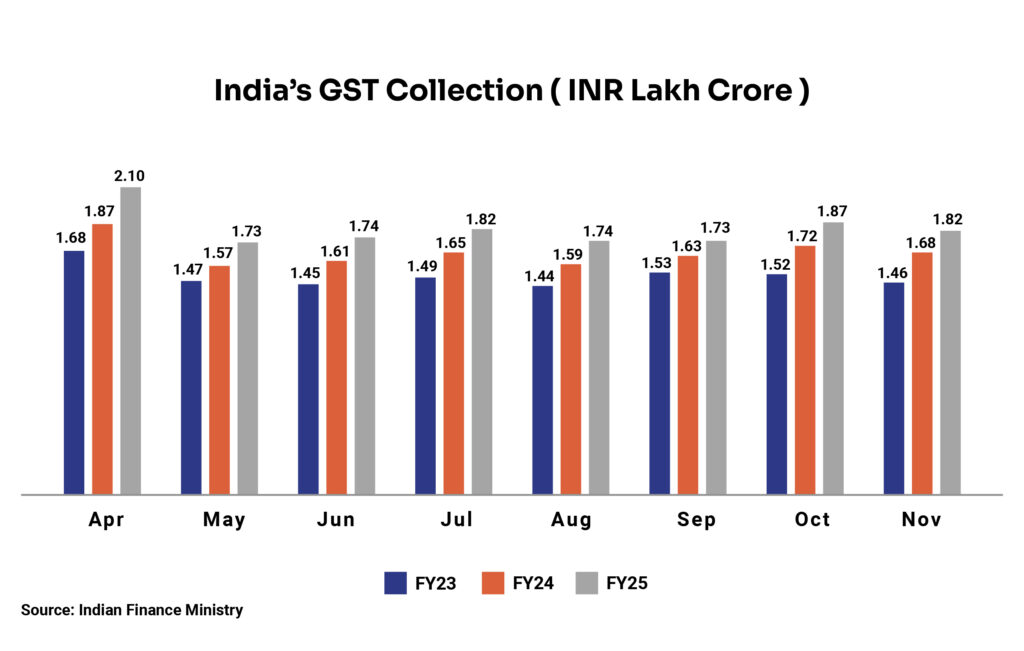
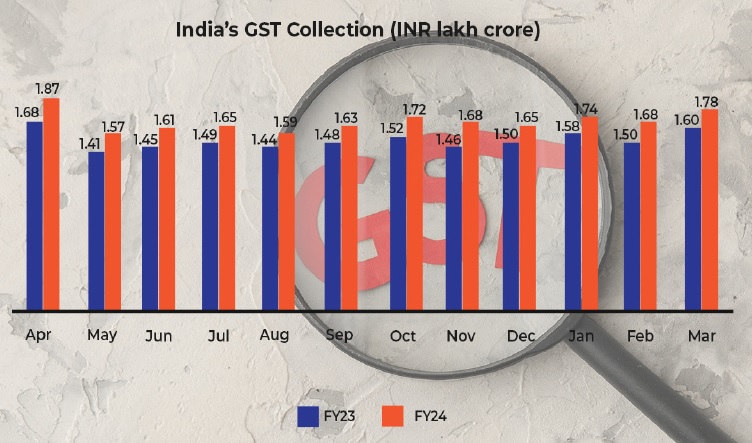
India’s GST collection grew 9.1% YoY to INR 1.84 lakh crore in February driven by an increase in domestic revenue. The GST from domestic sources increased by 10.2% YoY to INR 1.41 lakh crore in February. The top five states by collection remained the same with Maharashtra recording the highest collection (INR 30,637 crore) followed by Karnataka (INR 14,117 crore), Gujarat (INR 11,402 crore), Tamil Nadu (INR 10,694 crore), and Haryana (INR 9,925 crore). Net GST revenue grew 8.1% YoY to 1.62 lakh crore in the month under review.

OECD revised India’s GDP growth forecast downwards

The Organisation for Economic Co-operation and Development (OECD) lowered India’s FY26 growth forecast to 6.4% from its earlier estimate of 6.9% in December citing rising global uncertainty. The forecast for FY27 has also been lowered to 6.6% from the earlier estimate of 6.8%.

Meanwhile, Ministry of Statistics and Programme Implementation (MOSPI) has revised the growth estimates for FY25 to 6.5% from 6.4% projected in January. The ministry`s outlook is based on recovery in the agricultural and service sector during the December quarter.

Gross FDI inflows nosedive in Q3FY25

Gross foreign direct investment (FDI) in India dipped 5.6% YoY to US$10.9 billion in the October-December 2024 from US$11.5 billion in the October-December 2023, due to global uncertainties. Total FDI, including equity inflows, reinvested earnings and other capital, grew 21.3% YoY to US$62.4 billion in 9M FY25. In April-December 2024-25, major countries that contributed to equity inflows were Singapore, the US, the Netherlands, the UAE, Cayman Islands and Cyprus.

India’s trade deficit shrinks

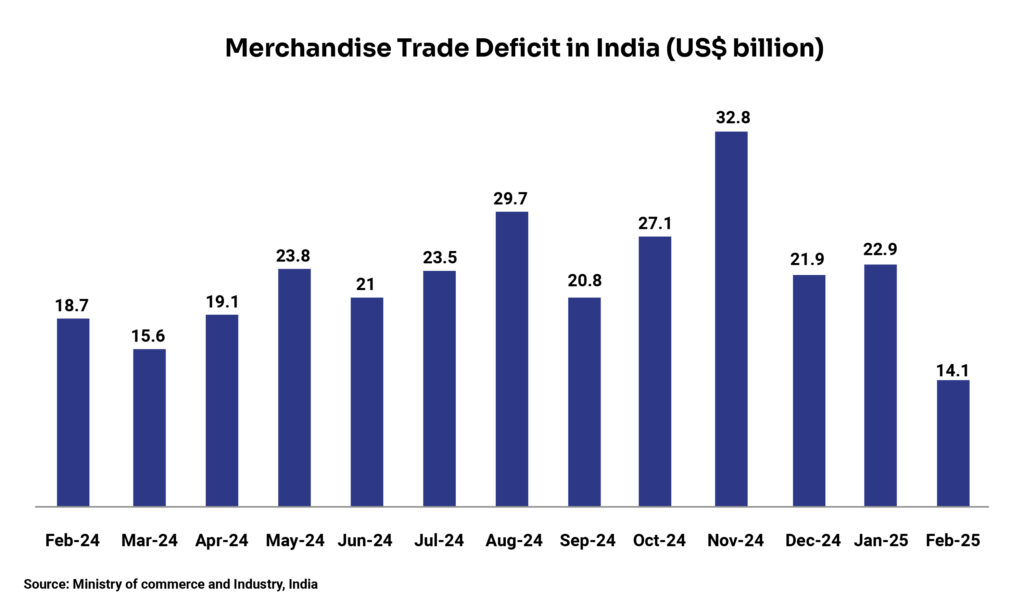
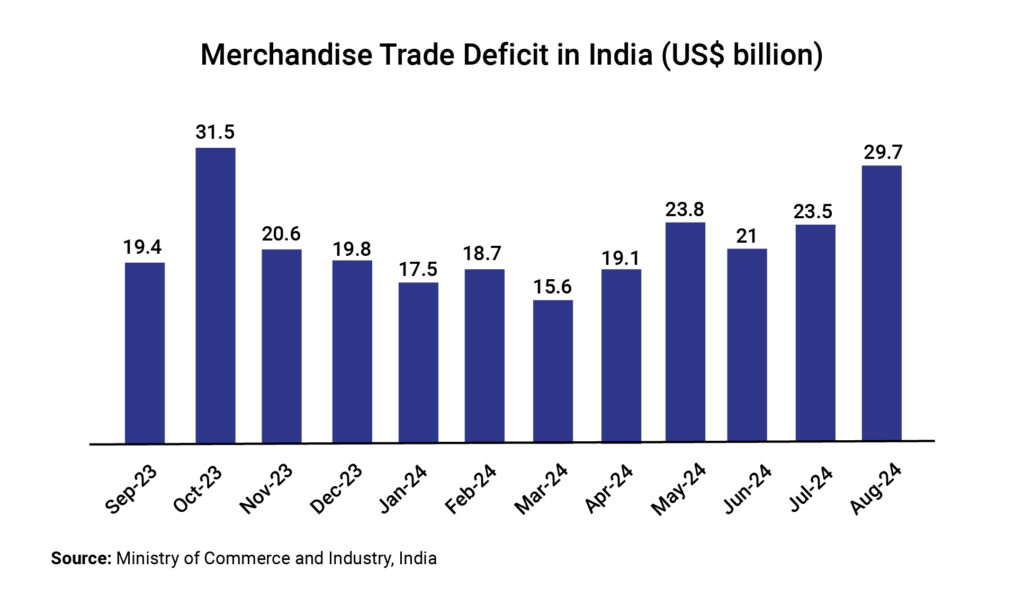
India’s merchandise trade deficit, the gap between the imports and exports, declined to US$14.1 billion in February from US$22.9 billion in January driven by sharp decline in imports. This is the lowest deficit since August 2021. Merchandise imports fell 16% YoY to US$50.96 billion while exports fell 11% YoY to US$36.91 billion.

India’s unemployment rate skids

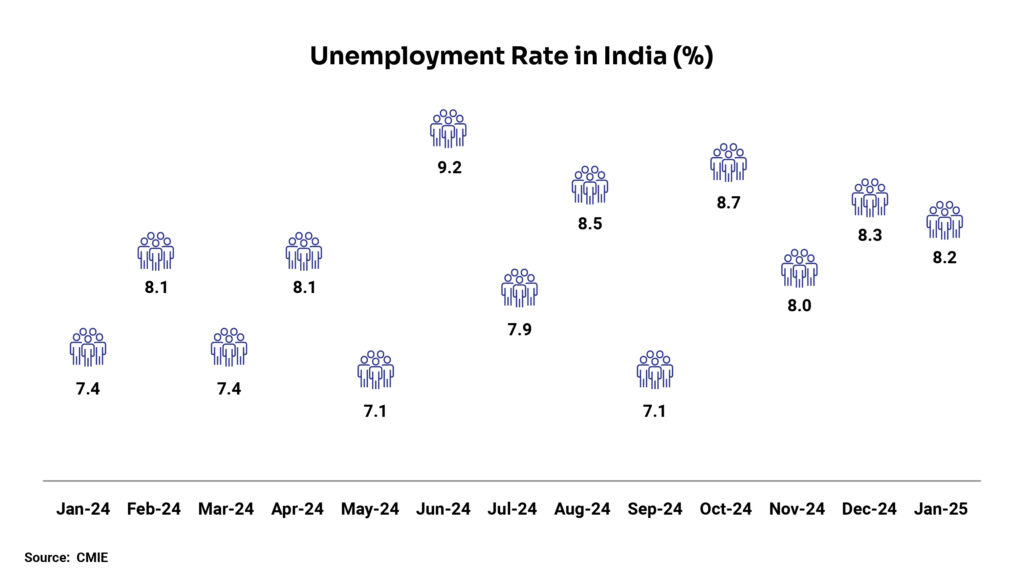
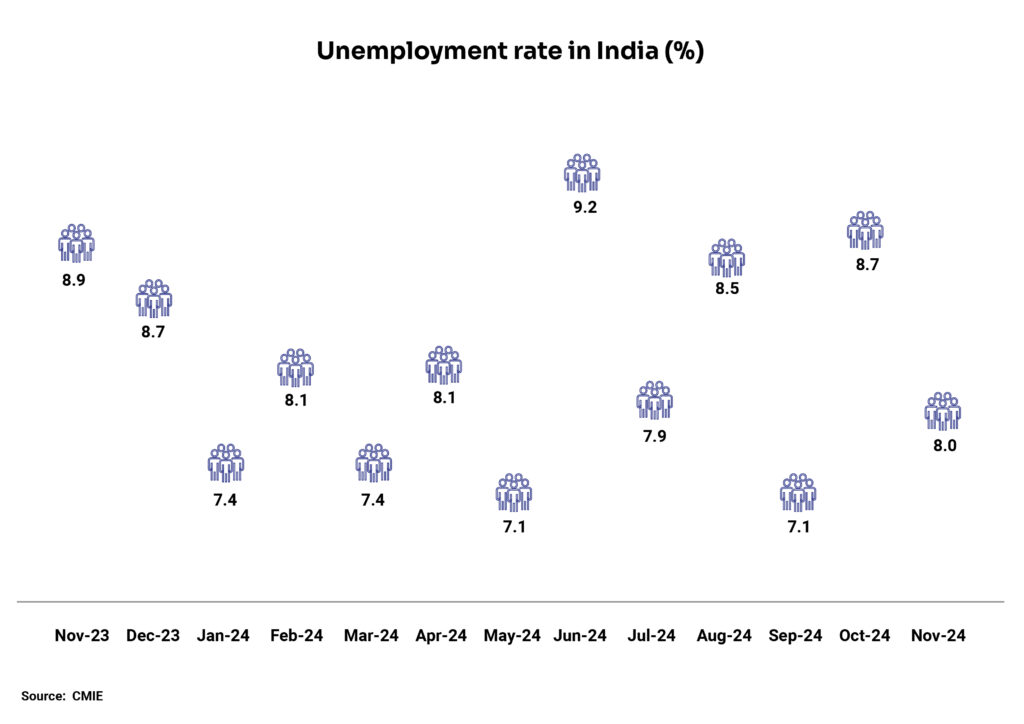
The unemployment rate in India slid to 8.2% in January 2025 from 8.3% in December, according to the survey by the Centre for Monitoring Indian Economy (CMIE). The average unemployment rate in India for the 2018-2024 period was 8.18%. The unemployment rate reached an all-time high of 23.5% in April 2020 and it reached an all-time low of 6.4% in September 2022.

India’s net direct tax collection growth slows

India’s net direct tax collection grew 13.13% YoY to INR 21.26 lakh in March slowing from 14.69% in February, according to the latest data released by the income tax department. Gross direct tax collections were up 16.15% to INR 25.87 lakh crore in FY25 from INR 22.27 lakh crore in FY24. During the same period, corporate tax collection was at INR 12.4 lakh crore, while Securities Transaction Tax (STT) collection, a component of direct tax, grew sharply by 55% YoY to INR 53,095 crore.

Passenger vehicle sales drop significantly

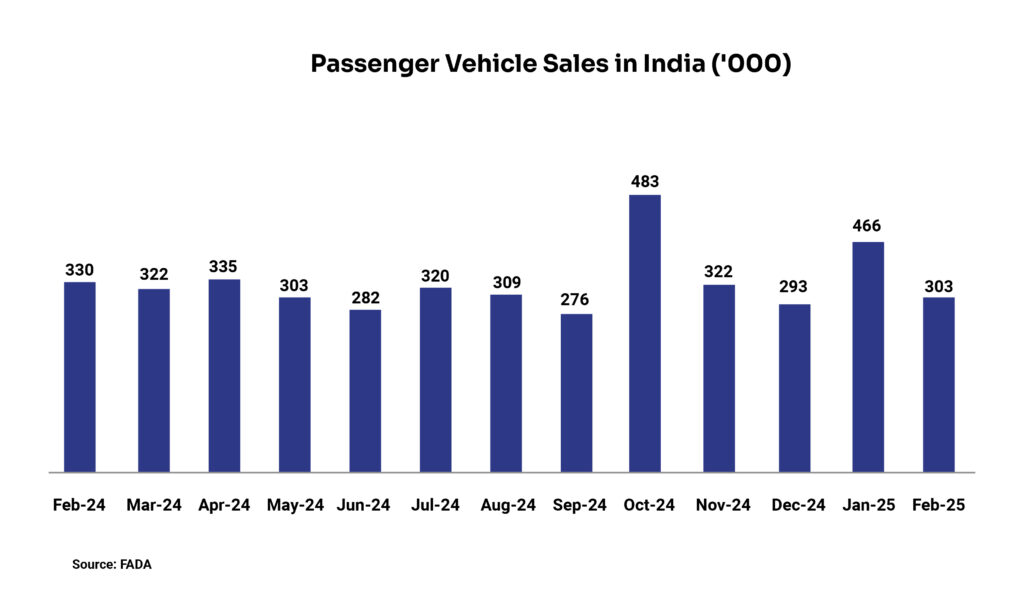
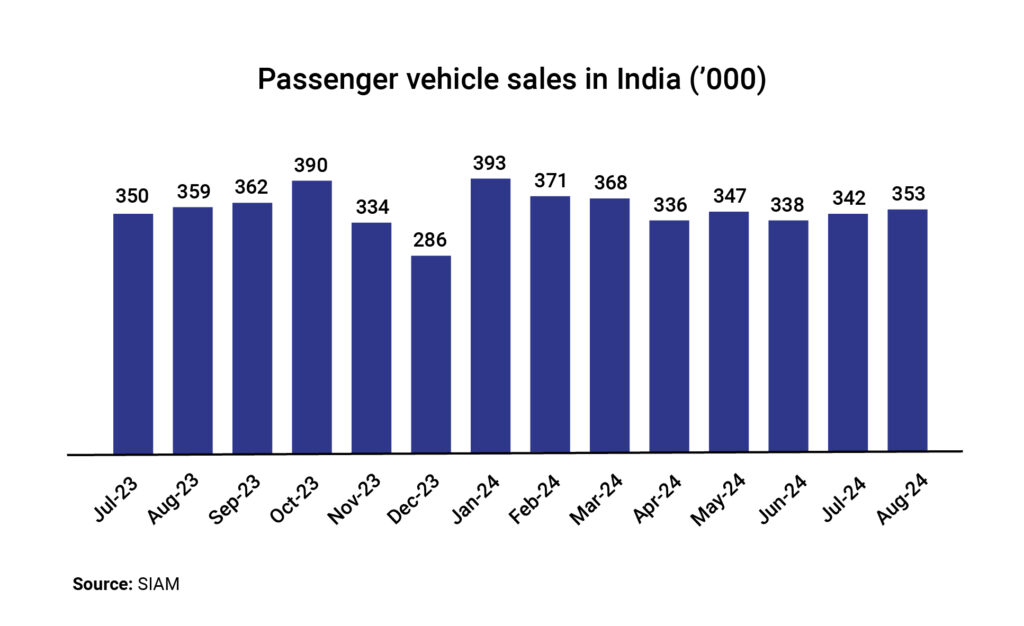
Total passenger vehicle (PV) sales in India fell 10.34% YoY to 303,398 units in February from 465,920 units in January, as per the data from the Federation of Automobile Dealers Association (FADA). The auto dealers attribute this decline to delayed conversions and other challenges. All the categories registered a decline – 2-wheeler sales were down 6% YoY, 3-wheeler segment fell 2%, commercial vehicles sales dropped 8.6%, and the tractor segment dipped 14.5% YoY.

Global Update Roundups

Monetary Policies

  • US: The US Fed kept the federal funds rate unchanged at 4.25% – 4.5% for the second time in a row in its March 2025 meeting, noting that the economy is expanding, and the unemployment rate remains under control while acknowledging the rising concern about the economic outlook at the same time. “We do understand that sentiment has fallen off pretty sharply, but economic activity has not yet,” the Federal Reserve Chair Jerome Powell said. “The economy seems to be healthy”.
  • ECB: The European Central Bank (ECB) cut its benchmark interest rates by 25 basis points to 2.65% from 2.9% while lowering the deposit facility rate to 2.5%, and the marginal lending rate to 2.9%. The move aims to boost economic growth amid rising concerns on persistent inflation and sluggish recovery in the Eurozone fearing a looming trade war.
  • BoJ: The Bank of Japan (BoJ) kept interest rates unchanged at 0.5%, in an effort to buy more time for gauging the effect of higher US tariffs on the export-intensive economy. “Japan’s economy is recovering moderately, albeit with some weak signs,” the BOJ stated.
  • China: China has kept its benchmark interest rates unchanged for the fifth straight months, in line with market expectations. The one-year loan prime rate (LPR), a benchmark rate for corporate and household loans, was kept steady at 3.1%, while the five-year LPR, a reference for property mortgages, has been retained at 3.6%. This happened as economic recovery and declining lender profit margins limit the need for further easing.
  • BoE: The Bank of England (BoE) kept the benchmark interest rate unchanged at 4.5%, treading caution about the persistent inflation, slowdown in economy, and global economic uncertainties. The country’s inflation remained above the central bank’s 2% target and is set to move higher in the next few months.

GDP growth

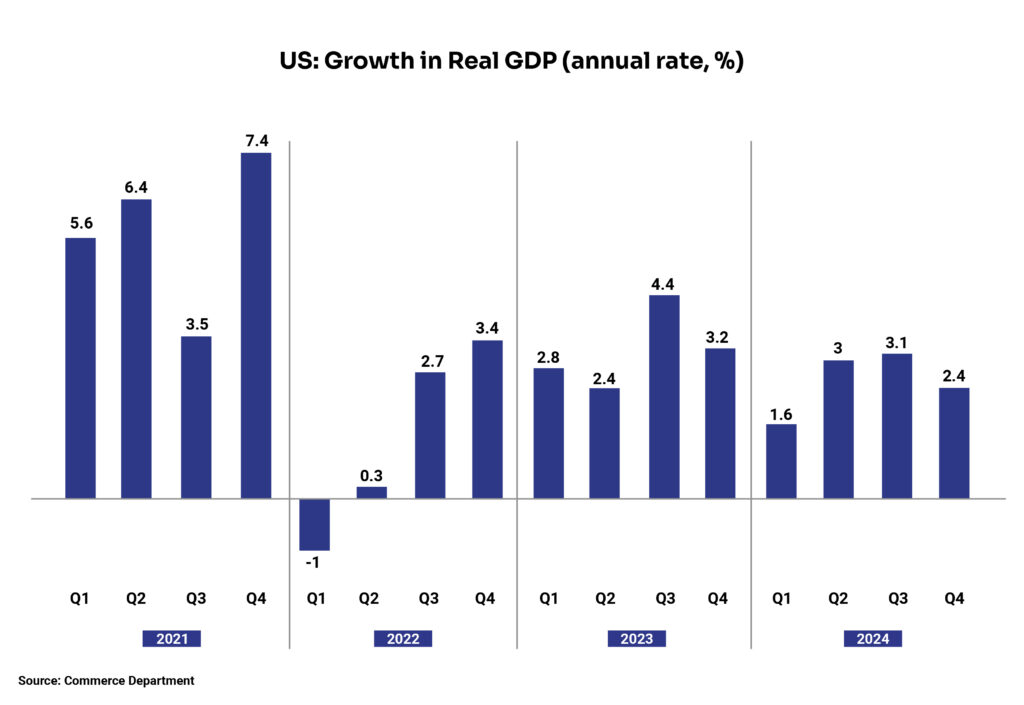
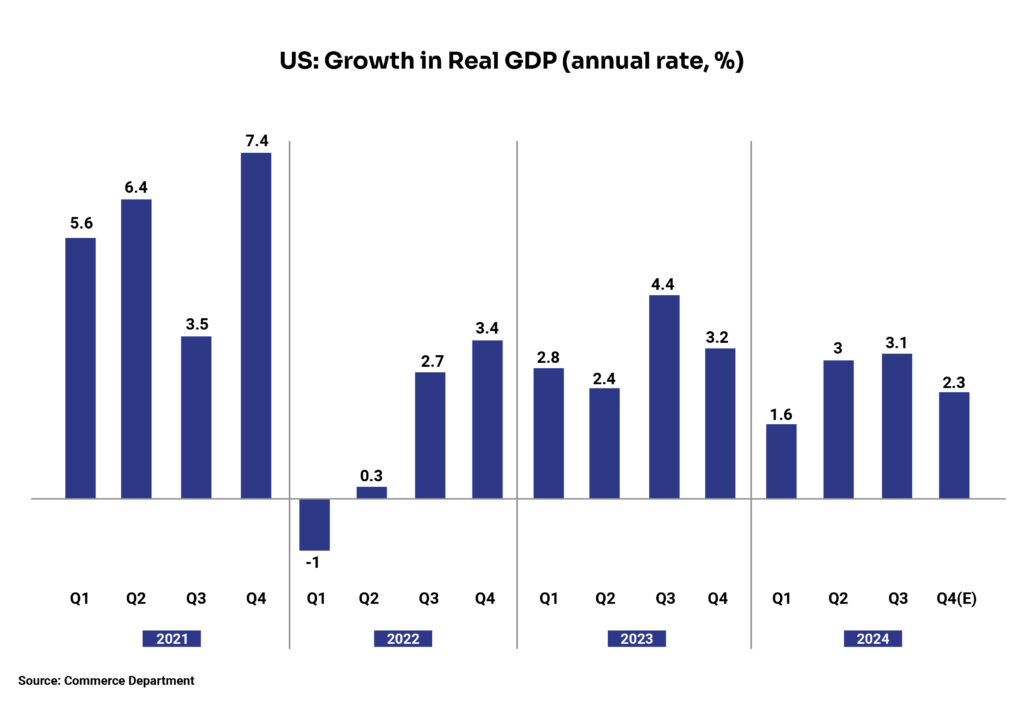
  • US: The US economic growth declined at an annualised rate of 2.4% in Q4CY24 from the previous quarter’s growth of 3.1% but was slightly higher than the consensus estimate of 2.3%. The slowdown in growth is a result of weakened exports, while imports surged, and a 9% decline in business investments. On the other hand, there was a slight increase in government and consumer spending, at an annual rate of 4.2%, in the fourth quarter.
  • Japan: Japan’s economy grew 0.6% QoQ in Q4CY24 from the previous quarter’s 0.4% (upwardly revised), the third consecutive quarter-on-quarter growth. This growth is attributable to increase in government spending by 0.4%, and business investments by 0.6% (compared to a 0.1% drop in Q3), which is above the expectations of 0.5%.
  • Euro Area: The seasonally adjusted GDP grew 0.2% in the Euro area and 0.4% in the EU on a QoQ basis in Q4CY24. Among the member states, Ireland recorded the highest growth (3.6% QoQ) followed by Denmark (1.6%), and Portugal (1.5%).
  • UK: The UK economy grew 0.1% QoQ in Q4CY24, in line with the previous estimate, and compared to the flat reading of Q3CY24. The improvement is led by increase in household spending, gross capital formation, public expenditure, and service sector output.

Unemployment

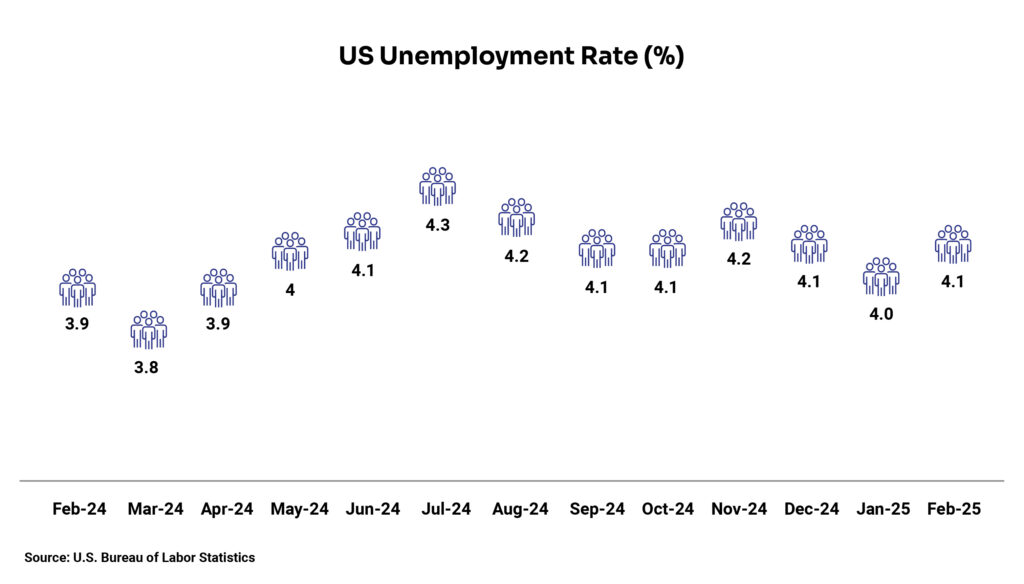
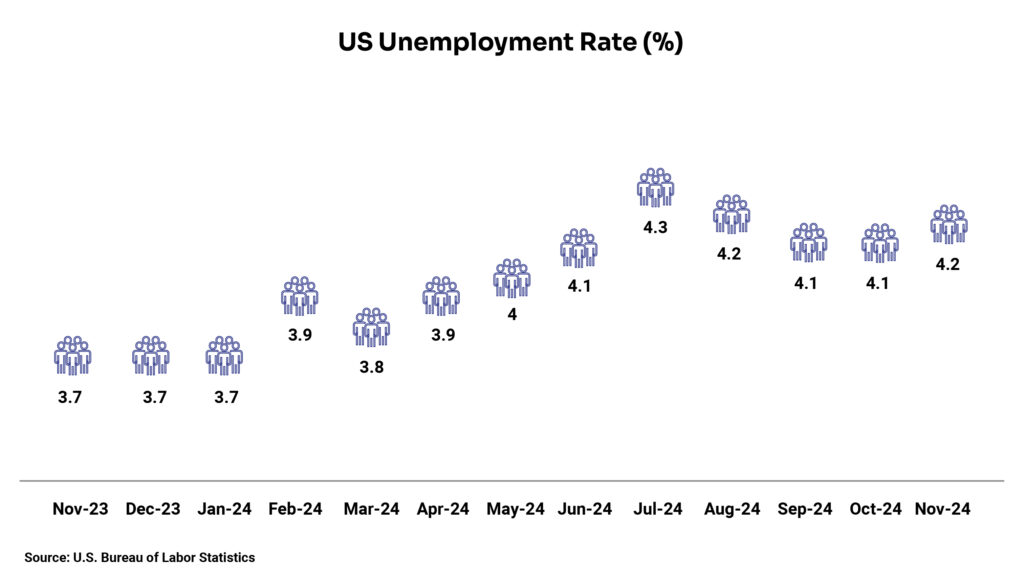
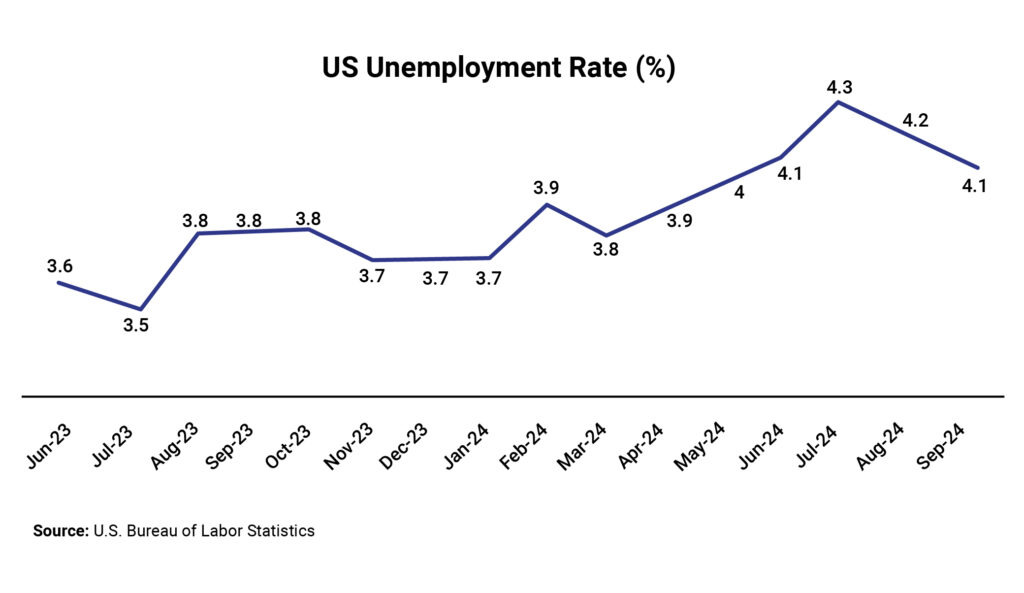
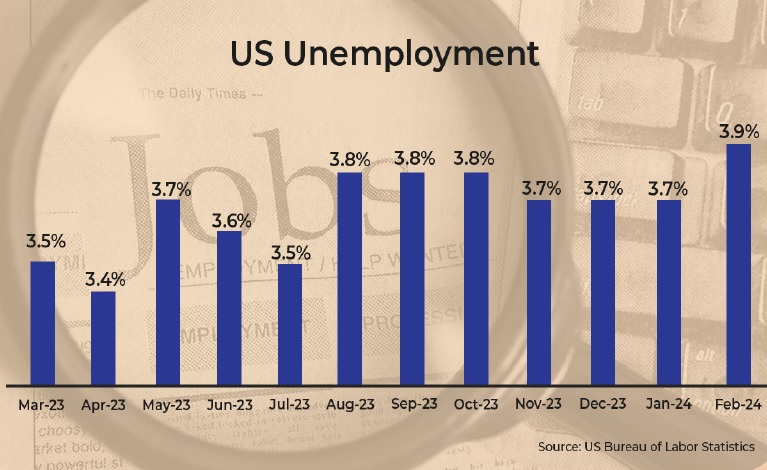
  • US: Unemployment rate in the US was 4.1% in February, slightly above the market expectations and January`s reading of 4%. The number of unemployed individuals grew to 7.05 million in February from 6.85 million in the previous month. The labour force participation rate dropped to 62.4% while the employment-population ratio declined to 59.9% in February.
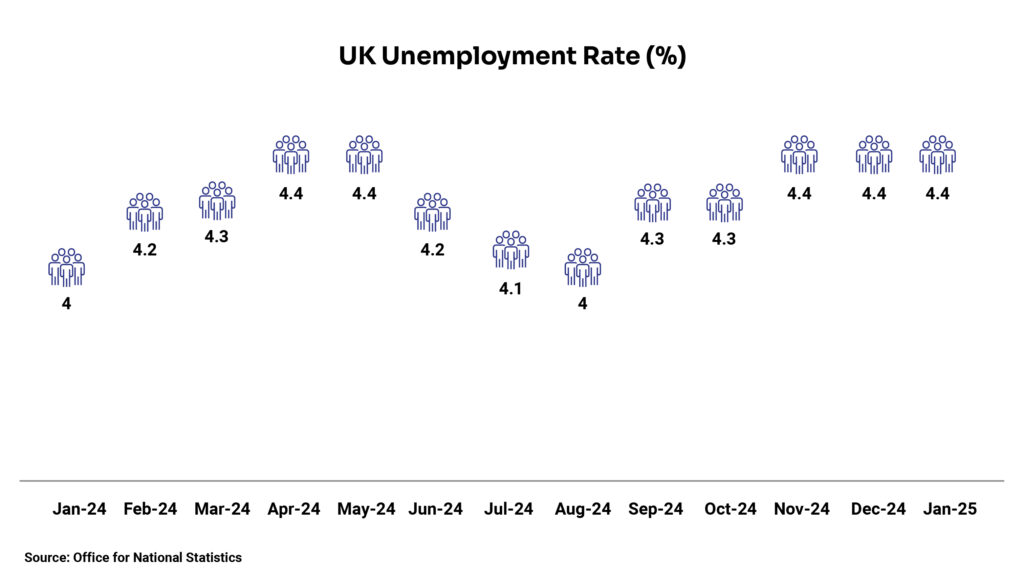
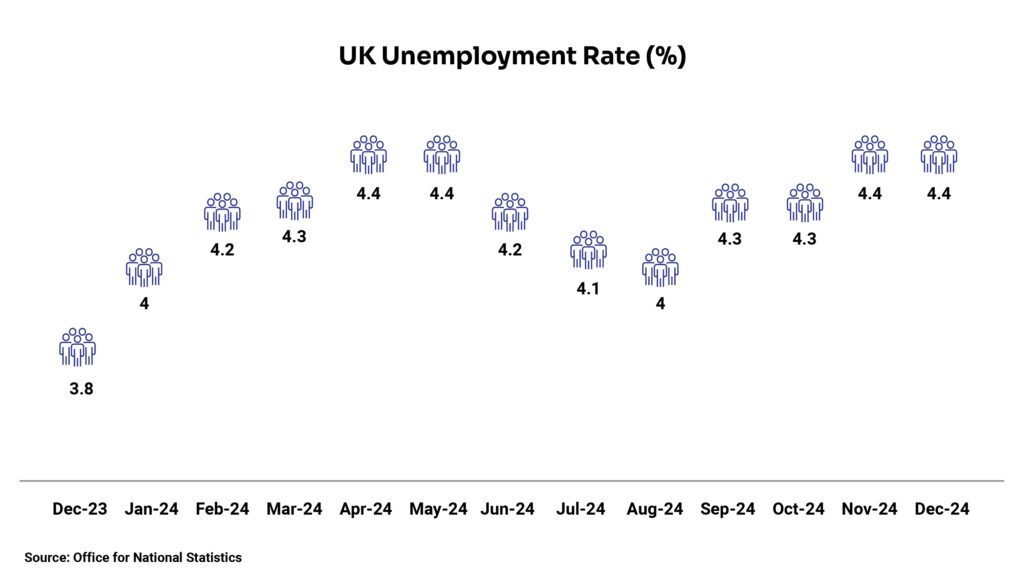
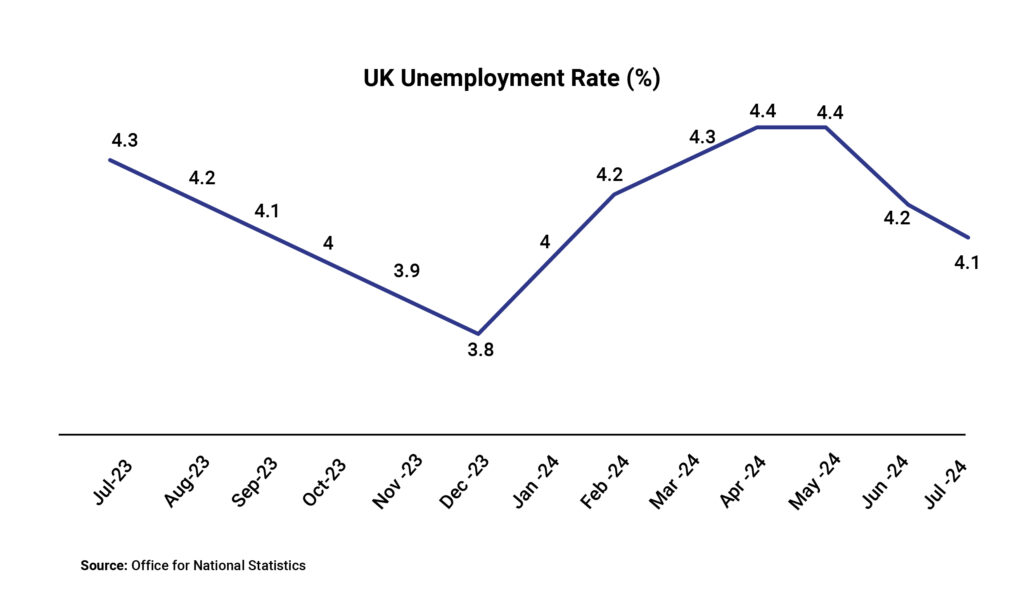
  • UK: The unemployment rate in the United Kingdom remained steady at 4.4% in January 2025, in line with market expectations. With this, unemployment remained at the highest level for the third consecutive month as the number of individuals unemployed for up to 12 months increased. The economic activity rate remained unchanged at 21.5%.
  • Canada: The unemployment rate in Canada remained unchanged at 6.6% in February but came in below market expectations of 6.7%. The number of unemployed individuals decreased to 1.4 million in February from 1.5 million in the previous month. The labour force participation rate dropped to 63.5%.
  • China: The unemployment rate in China came in higher at 5.4% in February compared to the January’s reading of 5.2% and market estimates of 5.1%. This is the highest unemployment rate since February 2023. The jobless rate for local registered residents stood at 5.6%, non-local registrants at 5%, and for non-local agricultural registrants at 5.1%.
  • Japan: The unemployment rate softened to 2.4% in February compared to 2.5% in January and against the market forecasts of no change. The number of unemployed individuals fell by 3.4% to 1.68 million in February, while the number of employed individuals also declined by 0.2% to 68.16 million. The non-seasonally adjusted labour force participation rate stood at 63.2% in February. The jobs-to-applications ratio fell to 1.24 in the month under study from 1.26 in the previous month.
  • Euro: The unemployment rate in the Euro Area decreased to a new low of 6.1% in February compared to market consensus and January`s reading of 6.2%. The number of unemployed individuals decreased by 70,000 MoM to 10.5 million.

Inflation readings

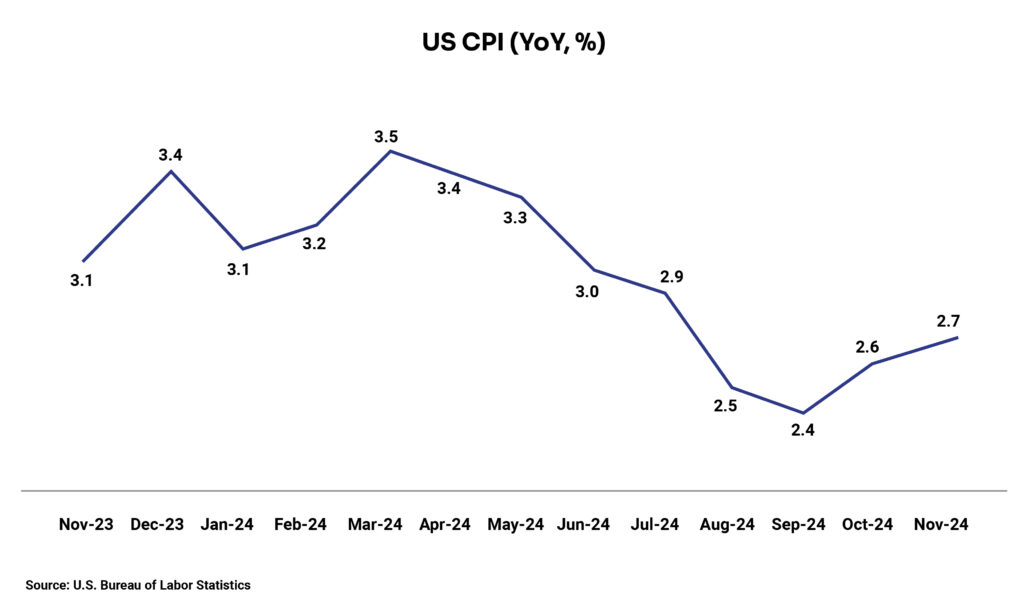
  • US: The inflation rate in the US edged down to 2.8% YoY in February from 3% in January. It was lower than the consensus estimates of 2.9%. The decline is attributed to the fall in energy costs (0.2% YoY) led by lower gasoline and fuel oil prices. Moreover, inflation for shelter, used cars and trucks, and transportation slowed down during the month Annual core inflation declined to 3.1% (compared to 3.3% in the previous month), which is the lowest since April 2021.
  • Eurozone: The consumer price inflation in the Euro Area fell to 2.3% YoY in February from 2.5% in January and below the market forecast of 2.4%. Factors that contributed to the decrease include services (3.7% vs. 3.9% in January) and energy (0.2% vs. 1.9%). Moreover, core inflation, which excludes volatile food and energy prices, eased to 2.6%, its lowest level since January 2022.
  • UK: The annual inflation rate in the UK eased to 2.8% YoY in February from 3% in January and lower than the expectations of 2.9%. The largest contributor towards this decline came from prices of clothing that fell for the first time since October 2021. Core inflation, which excludes volatile energy, food, alcohol, and tobacco prices, fell to 3.5% YoY in February from 3.7% in January.
  • China: China recorded a deflation of 0.7% YoY exceeding market estimate of a 0.5% deflation and reversing January`s inflation of 0.5%. This is the first deflation since January 2024 amid fading seasonal effects from the Spring Festival in late January. Food prices, mainly pork, and fresh vegetables fell sharply. Core inflation dropped 0.1% in February compared to a 0.6% rise in January.
  • Japan: Japan’s annual inflation shrank to 3.7% YoY in February from a 2-year high of 4% in January. The fall is led by the sharp decline in prices of electricity and gas. Furthermore, inflation softened for healthcare, recreation, and miscellaneous items. The core inflation rate fell to 3.0% in February from January’s 3.2%.

Consumer confidence

  • US: The consumer confidence dimmed further to 92.9 in March 2025 from 98.3 in February and came in lower than the forecast of 94.2. This 7.2-point contraction marks the 4th consecutive month of decline. In February, consumer views about the future business conditions and income fell to the lowest level. Moreover, the index that measures future expectations dropped 9.6 points to 65.2, the lowest reading in 12 years below the 80-level, indicating possibility of a recession ahead.
  • UK: The GfK consumer confidence index in the UK grew by 1 point to -19 in March 2025, making it the second consecutive monthly increase. While the improvement in the consumer confidence exceeded market expectations of -21, it remained in the negative area reflecting caution by the consumers.
  • Euro: The consumer confidence in the Euro Area declined by 0.9 points to -14.5 in March 2025, the lowest in 3 months and in line with the initial estimates. This decline is fuelled by pessimism about future economic and financial situation while there was a slight improvement in consumers intent to make major purchases.

Balance of Trade

  • US: The US reported an all-time high trade deficit of US$131.4 billion in January 2025 from US$98.1 billion in December 2024 (revised), surpassing the forecast of US$127.4 billion. Imports grew 10% to a record high of US$401.2 billion in anticipation of upcoming tariffs while exports increased 1.2% to US$269.8 billion.
  • UK: The UK’s trade deficit fell to £0.60 billion in January 2025 from £3.18 billion in December. It is the smallest trade gap since September. Exports grew 3.6% MoM to a 5-month high of £75.68 billion while imports were up 0.1% MoM to £76.28 billion.
  • Japan: Japan’s trade balance shifted to a surplus of JPY 584.5 billion in February compared to a deficit of JPY 415.43 billion in January, falling short of market estimates of a JPY 722.8 billion surplus. This reversal is driven by 11% YoY increase in exports to JPY 9,191.14 billion, while imports fell 0.7% YoY to JPY 8,606.63 billion.
  • China: China`s trade surplus increased to US$170.52 billion in January-February 2025 period from US$104.84 billion in December. This sharp increase was driven by imports that fell 8.4% YoY, while the exports grew 2.3% YoY.


Disclaimer: The information provided in this article is for general informational purposes only and is not an investment, financial, legal or tax advice. While every effort has been made to ensure the accuracy and reliability of the content, the author or publisher does not guarantee the completeness, accuracy, or timeliness of the information. Readers are advised to verify any information before making decisions based on it. The opinions expressed are solely those of the author and do not necessarily reflect the views or opinions of any organization or entity mentioned.

Alternative Investment Funds in India: The Growth Story

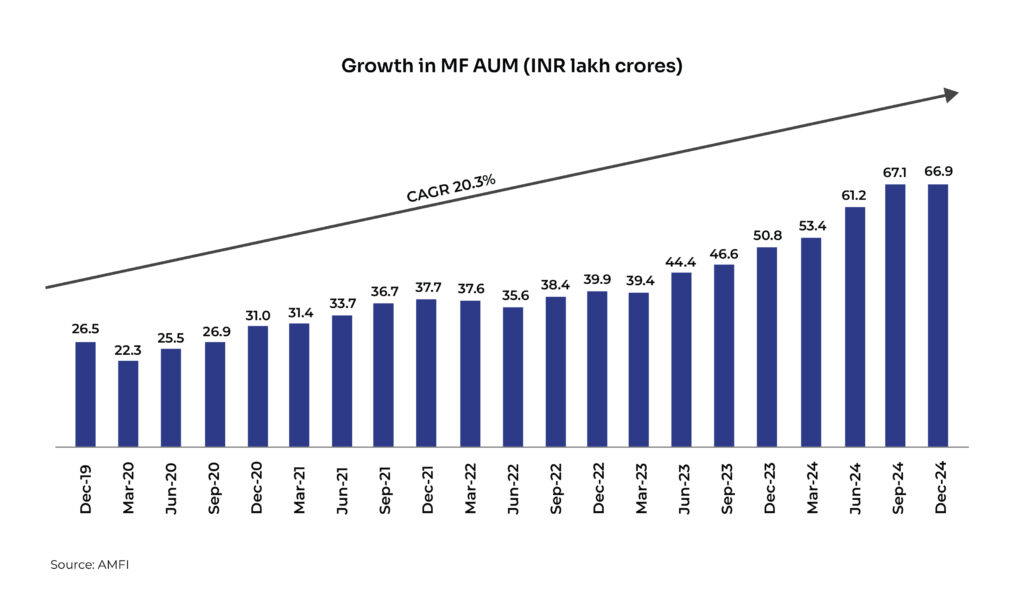
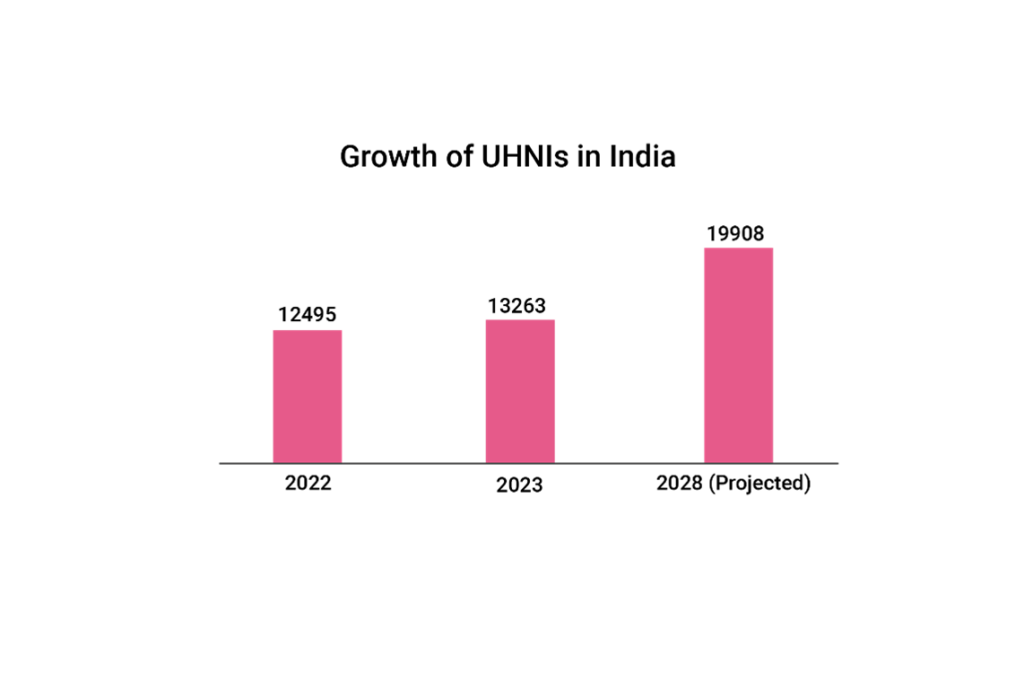
The growth of India’s alternative investment funds industry has been phenomenal over the past few years. The industry’s commitments raised, which denotes the amount clients are willing to invest in AIFs, clocked a 5-year CAGR of ~31% to ~INR 13.5 lakh crores as of Dec 2024. However, the mutual fund industry, which sits with an average AUM of ~INR 67 lakh crores (as on Dec 2024), achieved an AUM of the same level over four decades in mid-2009, after the first scheme (US-64 by UTI) was launched in 1964.

Over the last five years, the growth in the AIF industry has been super steady without any dent even during Covid-19, unlike mutual funds.

Within the AIF segment, Category II constitutes ~80% of industry commitments. As of Dec 2024, Cat II commitments jumped ~14% y-o-y to ~INR 10 lakh crore. Among other categories, Cat I commitments rose ~15% to ~INR 84,862 crore and Cat III commitments grew ~70% to ~INR 2 lakh crore as of Dec 2024.

What are the catalysts for growth?

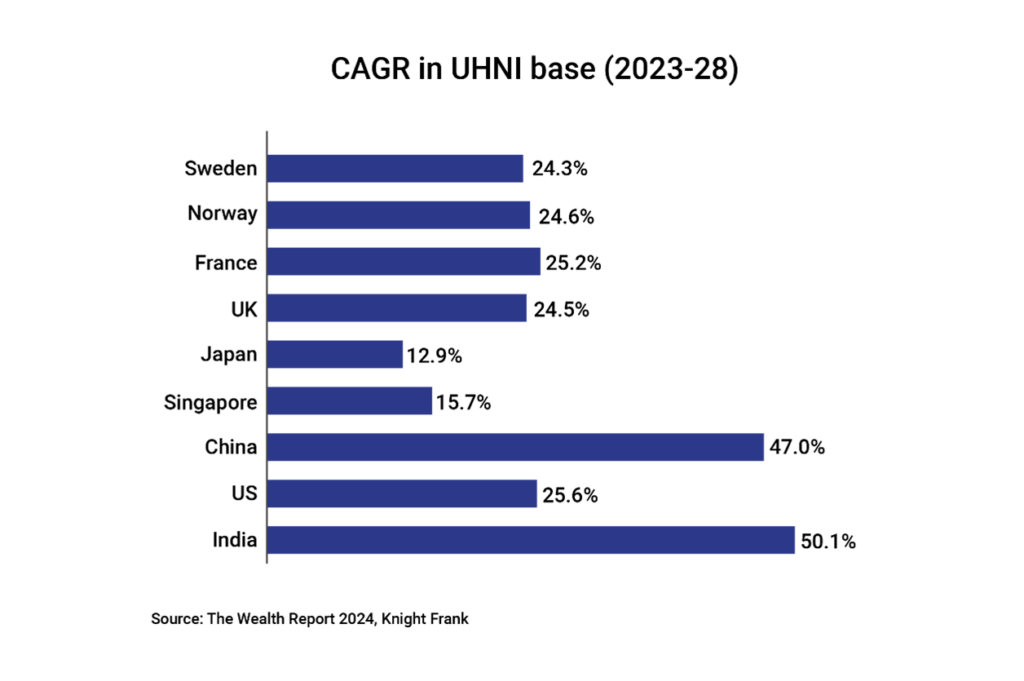
The major factor that is driving the growth in alternative investment funds is their low correlation to public markets. Hence, high net-worth individuals (HNIs) and family offices are increasingly preferring AIFs over other asset classes like traditional equity and bonds.

Economic uncertainties led by black swan events and geo-political tensions add a lot of volatility to the market, while inflation hedging is a must. Given these issues, alternative investment funds fit well into the criteria with higher risk-adjusted returns.

Among other factors that led AIFs to gain traction include the regulatory mandate to ensure sponsors’ “skin in the game”. The investments in the funds are managed by a team of seasoned finance professionals with local expertise and a competent investment committee with the ability to underwrite risk and ensure consistently higher returns.

AIFs have continued to exhibit secular growth with the majority of the incremental funds raised in the Category II and Category III AIFs. While Category III investments are predominantly concentrated in listed equities, the growth in Category II funds has been contributed by the Private Credit segment with debt investments contributing to 40% of the segment.

While banks continued to prioritise lending to retail and large corporate borrowers, mid-market corporates continue to prefer debt investments from Private Credit AIFs due to the tailored solutions being offered. From an investor standpoint, these AIFs have seen increased acceptance from domestic investors driven by tax parity with debt mutual funds and improved visibility on return outperformance.


Disclaimer: The information provided in this article is for general informational purposes only and is not an investment, financial, legal or tax advice. While every effort has been made to ensure the accuracy and reliability of the content, the author or publisher does not guarantee the completeness, accuracy, or timeliness of the information. Readers are advised to verify any information before making decisions based on it. The opinions expressed are solely those of the author and do not necessarily reflect the views or opinions of any organization or entity mentioned.

The Pulse – A monthly digest of key macroeconomic events (February 2025)

“There is no change in RBI’s approach. It does not look at any price level or band. It is our endeavour to curb excessive volatility. We should not be looking at daily movement or exchange rate.” – Sanjay Malhotra, RBI Governor on the depreciation of INR


Executive Summary

Last month saw risk-off moves and a relief rally in US treasuries, with the US 10-year treasury down by about 50 basis points (bps) from the highs in January this year. A weaker set of data points including soft consumer confidence surveys aided the move lower in yields. US curves echo the bleaker outlook developing around the US economy with tariffs still in play, however, with tariffs still in play higher inflation cannot be ruled out. For now, a weaker economic outlook is weighing on the yield curves.

On the domestic front, the Reserve Bank of India (RBI) Monetary Policy Committee reduced rates unanimously by 25 bps as was widely expected, maintaining a ‘Neutral’ stance and no specific liquidity measures. On the currency front, RBI maintained that the central bank is committed to smoothening the excessive volatility and does not target any specific levels. Later, through the month, the chatter of heavy intervention in the currency market saw some respite to the otherwise unidirectional upward movement in INR this year. A weaker Balance of Payment outlook with relentless FPI outflow continues to weigh on currency at the moment.

Domestic Updates

India’s retail inflation moderates to 5-month low, wholesale inflation abates

The retail inflation, measured by the change in the Consumer Price Index (CPI), fell to a 5-month low of 4.31% YoY in January 2025 from 5.22% YoY in December. This is attributable to food inflation that hit a record low of 6.02% YoY in January since August. Vegetable inflation more than halved to 11.35% YoY in January from 26.56% YoY in December contributing majorly towards the declaration of food inflation.

Inflation based on the wholesale price index (WPI) marginally declined to 2.31% YoY in January 2025 from 2.37% YoY in December because of a correction in inflation for primary articles along with fuel and power. Inflation for primary articles went down to 4.69% YoY in January from 6.02% YoY in December as food prices dropped while the inflation for fuel and power slowed to 2.78% YoY in January from 3.79% YoY in December.

Meanwhile, retail inflation for farm and rural workers softened further to 4.61% YoY and 4.73% in January 2025, respectively, from 5.01% YoY and 5.05% in the previous month. The retail inflation for farm and rural workers in January 2025 is the lowest since November 2021.

The retail inflation for industrial workers (IW) measured by the CPI-IW, eased slightly to 3.53% in December from 3.88% in November.

India’s industrial output growth slows to a 3-month low

The growth in India’s industrial output, as measured by the Index of Industrial Production (IIP), slowed to a 3-month low of 3.2% in December from 5% in November. The manufacturing sector output (largest in the IIP basket) grew 3% in December compared to 5.5% in November. The mining and electricity output grew 2.6% and 6.2%, respectively, in December.

RBI cuts repo rate for the first time in nearly 5 years

The RBI cut its repo rate, the rate at which the central bank lends to other banks, by 25 basis points (bps) to 6.25% for the first time in nearly 5 years (since May 2020). The earlier rate has been kept unchanged for 11 straight policy meetings. The last time the RBI cut rate was during the Covid-19 pandemic by 40 bps to 4%. In the latest meeting, all six members of the monetary policy committee (MPC) voted to cut the rate and maintain the monetary policy stance at “neutral” considering the easing of inflation towards the medium-term target of 4% and the need to support the sluggish economy. India’s real GDP growth declined to a 7-quarter low of 5.4% in July-September against RBI’s projection of 7%. The Economic Survey 2025 estimated a growth of 6.4% in FY25, 20 bps lower than the RBI projection in its previous policy.

Following are the revisions in real GDP growth and Inflation forecasts announced by the MPC:

India records highest GST collections since April 2024

India’s GST collection grew 12.3% YoY to INR 1.96 lakh crore in January 2025. This number marks the highest GST revenue since April 2024. The top five states by collection remained the same, compared to the prior month, with Maharashtra recording the highest collection (INR 32,335 crore) followed by Karnataka (INR 14,353 crore), Gujarat (INR 12,135 crore), Tamil Nadu (INR 11,496 crore), and Haryana (INR 10,284 crore). Net GST revenue grew 10.9% YoY to 1.72 lakh crore in January 2025.

India’s real GDP growth rebounds in Q3 FY25

India’s real GDP grew 6.2% in Q3 FY25, recovering from the 7-quarter low of 5.6% YoY in Q2 FY25. However, the growth is lower than the RBI’s estimate of 6.8%. The uptick was driven by an increase in government and private consumption along with a sharp increase in exports during the quarter. Moreover, the growth in the gross value added (GVA) of the agricultural sector stood at a 6-quarter high of 5.6% due to strong kharif harvest and better rabi sowing trends. The industrial sector recorded slower growth with mining, manufacturing, and construction growing at 1.4%, 3.5%, and 7%, respectively. The services sector remained a key driver of growth with trade, hotels, transport, and communication services rising by 6.7% and public administration, defence, and other services growing by 8.8%.

India’s trade deficit widens

India’s merchandise trade deficit, the gap between imports and exports, increased moderately to US$22.9 billion in January 2025 from US$21.9 billion in December. Merchandise exports fell 2.4% YoY to US$36.43 billion while imports surged 10.3% to US$59.42 billion. In the April 2024 – January 2025 period, imports rose 7.4% YoY while exports grew 1.4% YoY.

India’s unemployment rate improves

The unemployment rate in India fell to 8.1% in January 2025 from 8.3% in December, according to the survey by the Centre for Monitoring Indian Economy (CMIE). In January 2025, rural unemployment was at 7.7% while urban unemployment stood at 8.4%.

India’s forex reserves jump to a 2-month high

India’s foreign exchange reserves rose by US$4.76 billion to a 2-month high of US$640.48 billion as of February 21. The contributor to this growth is Foreign Currency Assets (FCAs), a major component of the forex reserves, which grew by US$4.25 billion to US$543.84 billion. Moreover, in the reported week, gold reserves went up by US$426 million to US$74.58 billion, as per RBI.

Cotton production expects to dip

The Cotton Association of India (CAI) forecasted that the cotton output for the 2024-25 season would decline by 7.8% to 301.75 lakh bales from 327.45 lakh bales in the previous season due to lower yields in Gujarat, Punjab, and Haryana. Cotton exports in the current season are estimated to decline 40% to 17 lakh bales against 28.36 lakh bales estimated for the 2023-24 season.

India’s direct tax collection slows down

The growth in India’s net direct tax collection decelerated to 14.69% YoY (to INR 17.8 lakh crore) in February 2025 from 15.88% as of January, according to the latest data released by the income tax department. The gross direct tax collections went up 19.06% to INR 21.88 lakh crore in 11M FY25 from INR 20.64 lakh crore in 11M FY24. During the same period, corporate tax collection was at INR 7.8 lakh crore, while Securities Transaction Tax (STT) collection, a component of direct tax, stood at INR 49,201 crore (65% growth YoY).

Passenger vehicle sales surge

Total passenger vehicle (PV) sales in India rose 15.5% YoY to 465,920 units in January 2025 from 293,465 units in December, as per the data from the Federation of Automobile Dealers Association (FADA). The auto dealers attribute this surge to buyers postponing their purchases until January 2025 to take advantage of new models with upgraded features, better pricing, and other potential incentives in the new year. The other categories began the year on a promising note too – 2-wheeler sales were up 4.2% YoY, the 3-wheeler segment grew 6.6%, commercial vehicle sales increased 8.2%, and the tractor segment increased 5% YoY in January.

Global Update Roundups

Monetary Policies

  • UK: The Bank of England (BoE) MPC announced a 25-bps cut in its benchmark rate to 4.5% in a 7-2 majority vote. This is the third time since 2020, that the central bank cut its benchmark rates in an effort to boost the sluggish economy despite elevated inflation levels. This marks the third rate cut since the easing cycle began in August 2024. In the fourth quarter ended December 2024, UK’s consumer price inflation stood at 2.5%, above the central bank target of 2% mainly due to higher fuel prices. Investors are pricing at least three quarter-point cuts by the end of 2025.
  • Australia: The Reserve Bank of Australia (RBA) announced its first rate cut since the pandemic joining central banks of other developed countries like the US and UK in the rate cut cycle. It has reduced interest rates by 25 bps to 4.1%. The RBA Governor Michele Bullock attributed the cut to subsiding inflation (last reported at 3.2%) and to support “subdued growth in private demand”.

Trump raised import tariffs on steel and aluminium

US President Donald Trump announced raising import tariffs on steel and aluminium to a flat 25% “without exceptions or exemptions”. It will apply to imports from Canada, Brazil, Mexico, South Korea, and other countries that had been entering the U.S. duty-free. As per White House officials, the tariff will be effective from the beginning of March. The US president stated that it will impose reciprocal tariffs on all countries that impose duties on U.S. goods, and he is also looking at tariffs on cars, semiconductors, and pharmaceuticals.

GDP growth

  • US: The second estimate of the Bureau of Economic Analysis suggested growth in the US economy at an annualised rate of 2.3% in the fourth calendar quarter of 2024, which is lower than the previous quarter’s growth of 3.1%. The slowdown in growth is expected to be caused by the weakening of exports and a slowdown in business investments. In 2024, the US GDP growth is pegged at 2.8%, slightly lower than 2.9% in 2023.
  • Japan: Japan’s economy grew 0.7% quarter-on-quarter in the fourth quarter of calendar year 2024 versus the previous quarter’s 0.4%, exceeding market expectations of 0.3%. This translated into an annualized growth of 2.8%, up from 1.7% in the previous quarter. The improvement is led by growth in private consumption, which recorded a QoQ growth of 0.1% against the expectations of a 0.3% contraction.

Unemployment

  • US: Unemployment rate in the US eased to 4% in January 2025 from 4.1% in December 2024, reaching its lowest level since May 2024 and below market expectations of 4.1%. This happened as the number of unemployed individuals declined by 37,000 to 6.85 million, while employment increased by 2,234 to 163.9 million. The labour force participation rate also rose to 62.6%.
  • UK: The unemployment rate in the United Kingdom remained steady at 4.4% in December 2024 compared to the prior month. With this, unemployment remained at the highest level in the full-year 2024 due to an increase in individuals unemployed for up to 12 months. It is also attributed to the economic activity rate that went down to 21.5% from 21.6% in the preceding period.
  • Canada: The unemployment rate in Canada eased to a 3-month low of 6.6% in January 2025 from 6.7% in December 2024 and came in below market expectations of 6.8%. The number of unemployed remained nearly unchanged from the previous month at 1.5 million. Net job additions were 76,000 during the month.

Inflation readings

  • US: The inflation rate in the US hardened to 3% YoY in January 2025 2.9% in December 2024 and exceeded the consensus estimates of 2.9%. The increase is attributed to the rise in energy costs (1% YoY) for the first time in 6 months led by higher gasoline, fuel oil, and natural gas prices. Increased prices of used cars and trucks and transportation also led to the rise.
  • Eurozone: The consumer price inflation in the Euro Area rose to a 6-month high of 2.5% YoY in January 2025. Factors that contributed to the increase include services (up 1.77 percentage points), food, alcohol & tobacco (up 0.45 pp), energy (up 0.18 pp), and non-energy industrial goods (up 0.12 pp).
  • UK: The annual inflation rate in the UK rose sharply to 3% YoY in January 2025 from 2.5% in December and surpassed expectations of 2.8%. Higher costs of food, non-alcoholic drinks, and air fares led to the rise. Core inflation, which excludes volatile energy, food, alcohol, and tobacco prices, increased 3.7% YoY in January from 3.2% in the previous month.
  • China: China’s annual inflation rate escalated to a 5-month high of 0.5% YoY in January 2025 from 0.1% in December, exceeding market expectations of 0.4%. The spike was driven by seasonal effects from the Lunar New Year. Food prices, mainly pork, and fresh vegetables, rose, while non-food prices, mainly housing, healthcare, and education quickened.
  • Japan: Japan’s annual inflation climbed to a 2-year high of 4.0% YoY in January 2025 from 3.6% in the previous month. The spike is led by the steepest rise in food prices in 15 months, elevated prices of electricity and gas, as well as upward pressure from housing, clothing, transport, furniture and household items, healthcare, recreation, and miscellaneous items.

Consumer confidence

  • US: Consumer confidence dropped sharply to 98.3 in February 2025 from a revised 105.3 in January and came in lower than the forecast of 102.7. This 7-point MoM drop is the biggest since August 2021. The decline is fuelled by pessimism about the future employment prospects, which worsened and reached a 10-month high followed by less optimism about future business conditions and income.
  • Japan: Japan’s consumer confidence index unpredictably fell to 35.0 in February 2025 from 35.2 in January and came in below the consensus of 35.7. It is the lowest reading since March 2023. The fall was driven by the weakened sentiment of almost all indicators – overall livelihood (31.9 vs. 32.2), income growth (39.7 vs. 39.9), and willingness to buy durable goods (27.2 vs. 27.5) while employment marginally grew 41.1 in February from 41.0 in January.
  • UK: The GfK consumer confidence index in the UK rose by 2 points to -20 in February 2025. The slight improvement is a result of optimism among the household about their personal finances and the broader economic outlook. All the five key measures that make the consumer confidence index, which is the relative level of past and future economic conditions including personal financial situation, the situation for major purchases, overall economic situation, and savings level, showed an uptick in February.
  • Euro: Consumer confidence in the Euro Area grew by 0.6 points to -13.6 in February 2025, the highest in 4 months and in line with the initial estimates. Consumers are more intent on making major purchases and their expectations from the economy have improved marginally.

Balance of Trade

  • US: The US trade deficit widened to US$98.4 billion in December 2024 from US$78.9 billion in November (revised), surpassing the forecast of US$96.6 billion. It’s the highest trade deficit reported since March 2022. Imports rose 3.5% to US$364.9 billion while exports declined 2.6% to US$266.5 billion. The goods deficit increased to US$123 billion while the services surplus declined to US$24.5 billion in December.
  • UK: The UK’s trade deficit declined to £2.82 billion in December from a downwardly revised £4.35 billion in November. It is the smallest trade deficit since September. Imports fell by 1.5% MoM to a 3-month low of £71.88 billion, while exports grew 0.7% to a 4-month high of £69.06 billion.
  • Japan: Japan reported a trade deficit of JPY 2,758.78 billion in January 2025 in sharp contrast to a trade surplus of JPY 130.94 billion in December, exceeding the market estimate of a JPY 2,100 billion deficit. Imports grew 16.7% YoY to JPY 10,622.52 billion, while exports rose 7.2% YoY to JPY 7,863.75 billion.


Disclaimer:

The details mentioned above are for information purposes only. The information provided is the basis of our understanding of the applicable laws and is not legal, tax, financial advice, or opinion and the same subject to change from time to time without intimation to the reader. The reader should independently seek advice from their lawyers/tax advisors in this regard. All liability with respect to actions taken or not taken based on the contents of this site are hereby expressly disclaimed.
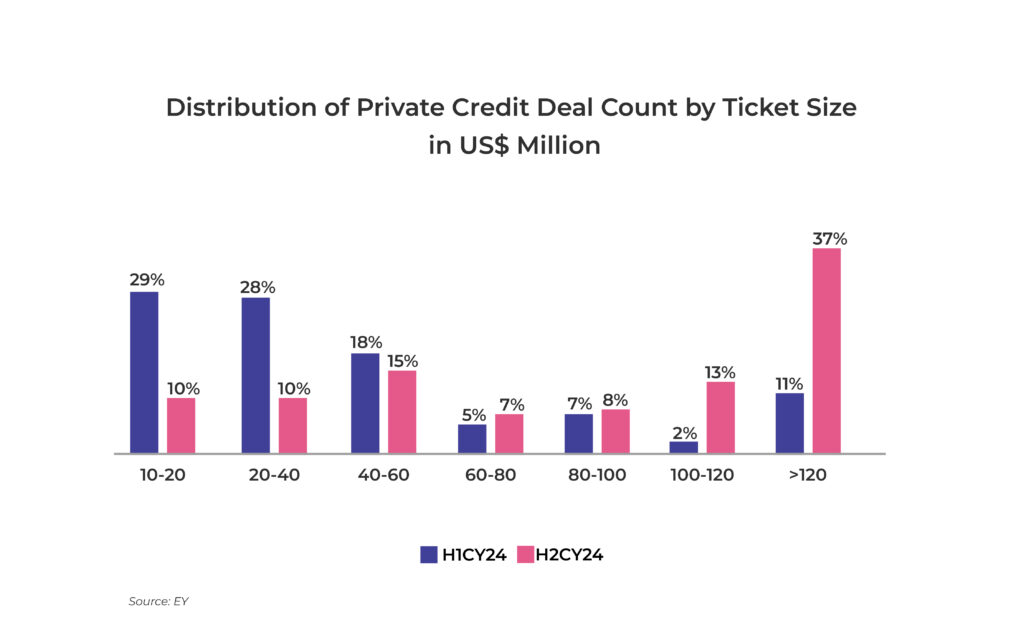
Understanding Expected Credit Loss for Enterprise Finance

The goal of the Expected Credit Loss (ECL) method is to assess credit risk and determine provisions for potential losses within co-lending portfolios. By adhering to IFRS 9 guidelines, the method ensures timely and accurate provisioning based on the risk profile of loans, enhancing the ability to manage and mitigate credit risk effectively.

Abstract:

The Expected Credit Loss (ECL) model is a forward-looking framework that assesses credit risk by considering a borrower’s likelihood of default, the exposure at the time of default, and the expected recovery following default. Utilizing historical data, borrower characteristics, and predictive modelling techniques, the ECL method provides precise estimates of potential credit losses. This empowers us to proactively allocate provisions, ensuring compliance with regulatory standards, and enabling more informed, data-driven decision-making.

Method:

Definition: ECL is a method of accounting for credit risk that is based on the loss that is likely to occur on a loan or portfolio of loans.

Expected Credit Loss = PD * EAD * LGD

Probability of Default (PD) Calculated by estimating the forward-looking probability of default for each loan.
Loss given default (LGD): The percentage loss that is expected to occur if the borrower defaults.
Exposure at default (EAD) Expected loss for each loan.

Note: dpd = Days past dues

Data preparation:

A decision tree model is created where the target variable is Probability of Default (PD) – specifically, whether a borrower defaulted within 12 months or not. The model will segment borrowers based on the likelihood of default. The process works as follows:

  1. Root Node Selection: The decision tree selects the most critical factor (e.g., borrower’s credit score) to split the borrowers into two groups – those likely to default and those who are not.
  2. Branching: For each group, further splits are made based on other factors like POS to disbursement ratio, age, or payment history.
  3. Leaf Nodes: At the end of the tree (leaf nodes), predictions are made regarding the likelihood of default for each borrower.

Probability Estimation:

Once the decision tree is trained, each borrower is assigned a Probability of Default (PD) based on the leaf node in which they land. The PD for each borrower corresponds to the likelihood that the borrower will default within the next 12 months, based on their features.  The leaf node where a borrower land indicates their risk level: If a borrower ends up in a leaf where many others defaulted, a higher PD is predicted. If they end up in a leaf where defaults are rare, a lower PD is predicted.

Interpretation of the Decision Tree:

The decision tree provides insights into which factors are most predictive of default. By interpreting the tree, financial institutions can make informed lending decisions. For example, if the model shows that borrowers with lower credit scores and higher loan amounts are more likely to default, this can be used to adjust lending policies.

EAD and LGD Calculation Using the Decision Tree

After building the decision tree with PD as the target variable, the next step is to calculate EAD (Exposure at Default) and LGD (Loss Given Default). For each loan in the training set, input the actual EAD (loan principal) and LGD (expected loss given default) values into the decision tree.

  • Calculate Expected EAD: The Expected EAD is calculated by aggregating the exposure at default, relative to the principal amount of the defaulting loans in each risk category (leaf node) of the tree. Loans with a higher PD contribute more to the Expected EAD.
  • Calculate Expected LGD: The Expected LGD is calculated by aggregating the loss given default for each risk category (leaf node) of the decision tree, based on the sum of the latest outstanding and exposure at the time of first default. Borrowers with a higher PD typically have a higher LGD, indicating a greater loss in the event of default.


Disclaimer: The information provided in this article is for general informational purposes only and is not an investment, financial, legal or tax advice. While every effort has been made to ensure the accuracy and reliability of the content, the author or publisher does not guarantee the completeness, accuracy, or timeliness of the information. Readers are advised to verify any information before making decisions based on it. The opinions expressed are solely those of the author and do not necessarily reflect the views or opinions of any organization or entity mentioned.

Private Credit AIFs: Lender of choice for mid-market enterprises

Debt plays a major role in the economic growth of a country as it offers a non-dilutive, lower cost alternative to companies looking to raise capital. The primary sources of debt are banks, NBFCs, and the public corporate bond market. Despite being the fastest-growing economy in the world, India still faces significant gaps in enterprise credit which cannot be serviced by traditional sources of capital. This is indicated by the fact that India’s domestic credit to the private sector has hovered around 50% of GDP compared to a consistently higher and steadily increasing world average of ~95%. This indicates a significant room for growth in debt in relation to the size of the Indian economy.

The mid-market enterprises (MMEs) in India are the pillars of growth. There are 15,000+ companies in the ecosystem contributing over 40% to India’s GDP, employing ~40% of the country’s workforce, and generating nearly 50% of its exports. However, majority of these companies have little or no access to the debt market.

Roadblocks to Growth

Traditional lenders such as banks and larger NBFCs are inflexible in enterprise lending and tend to serve the most vanilla needs through policy-based lending. On the other hand, mutual funds and insurance companies are restricted by their respective regulations and face lack of access to this space and limited ability to assess credit worthiness.

Most of these entities rarely have the expertise to navigate public capital markets, further exacerbated by the perils of asymmetrical information and smaller ticket sizes which may not garner investor interest.

Banks and NBFCs have largely pivoted towards retail lending with loans to industry growing at a slower pace than average disbursements. In the past 12 years, retail loans by banks clocked a CAGR of 16% while banking credit as a whole rose ~10%. In the same period, bank lending to large businesses and MSMEs has relatively stagnated with a CAGR of 3% for each, respectively.

NBFCs depicted a similar trend in the last 8 years with retail lending recording a CAGR of 23% while their gross advances increased by 11%. In contrast, NBFC lending to large and other businesses clocked a CAGR of 6% and 8% for MSME in the same period.

Over the last 10 years, debt mutual funds in general have seen a stagnation in AUM. As a percent of the total AUM, debt mutual fund AUM slipped from ~75% in FY14 to ~25% in FY24. On the other hand, Credit risk mutual funds have witnessed significant outflows with their volume degrowing by 2.5x in FY24 compared with FY20.

The domestic bond market has not been able to alleviate the situation. The overall market is dominated by government securities (G-Secs) and State Development Loans (SDL bonds), which accounted for 70% of the total outstanding in the bond market, while corporate bonds accounted for 22% of the same as of March 2024. In terms of share in GDP, the corporate bond market accounts for ~16% (2021), which remains sub-optimal compared to its Asian peers like South Korea (87%), Malaysia (57%), and China (36%).

In such a scenario, what can plug the significant gap in enterprise credit, mainly the mid-market enterprises that hold the potential for the next leg of growth in India?

The Emergence of Private Credit

Private credit provides an alternative source of financing for businesses with unique funding needs and irregular cash flows, cases which banks may avoid due to inflexible policies and regulatory restrictions. Private credit lending takes place mostly via funds/investment vehicles handled by specialized asset managers. In such funds, money is raised from sophisticated investors which are then deployed to entities as per covenants that suit the risk-return spectrum of the vehicle. The tasks related to origination, due diligence, monitoring and recovery (if required) are handled by the fund. With this, investors get access to a professionally managed portfolio consisting of 10-20 entities.

The Private Credit market has been growing at a fast pace across the world, and India is no exception. It witnessed a 5x growth in assets under management (AUM) over the last 10 years to over US$2 trillion in 2023.

Globally, the market started gaining pace as banks retreated from lending to small and mid-sized businesses and to companies backed by Private Equity. On the other hand, mid-market corporates are turning towards Private Credit funds seeking tailored financial solutions that such vehicles can provide with flexible structures.

Although India’s corporate bond market has been dominated by issuances in the higher credit rating categories, lower rated entities have been tapping the bond market increasingly. It is attributed to factors such as faster TAT compared to banks, flexible end-uses and security structures, emergence of online platforms, and the emergence of specialized private credit managers in the Performing Credit space, which cater to mid-sized, EBITDA positive, and cash flow generating companies with end uses of growth capital, capex, mezzanine financing, and acquisition (ticket size of loans INR 50-300 crore).

The entities in the Performing Credit space, to which banks generally offer Term Loans, are able to issue debentures into which funds invest. Often, and especially for corporates, an issuance for a fund may be the entity’s maiden capital market issuance and rating exercise. The fund may also be able to provide guidance in navigating the nuances of capital market issuance.

Lower rated entities (below AA) are deemed to be riskier compared to the above AA rated category due to their higher default rates. However, recent studies have shown default rates of entities in the space have been declining steadily due to factors such as

  1. Enactment of the Insolvency and Bankruptcy Code that has imparted credit discipline among such corporates.
  2. Improved scale and profitability of the entities due to the growth and digital advancement of the Indian economy.
  3. Industry-wide consolidation.
  4. Lower volatility in operating parameters.

What’s in it for investors?

In the public debt market, it has become difficult for investors to generate real returns. However, it makes sense to cautiously move into the private credit market given the immense potential in the space to earn superior returns. Recent regulatory steps like the enactment of the Insolvency and Bankruptcy Code and the introduction of the Account Aggregator framework brought confidence in the market and enabled transparency and scope for efficient decision-making about borrowing entities.

Further, choosing a highly professional fund manager is extremely useful while investing in the space as such risks can be mitigated ensuring stability and predictability of returns. Below are the factors investors should consider before investing in Private Credit funds:

Disclaimer: The information provided in this article is for general informational purposes only and is not an investment, financial, legal or tax advice. While every effort has been made to ensure the accuracy and reliability of the content, the author or publisher does not guarantee the completeness, accuracy, or timeliness of the information. Readers are advised to verify any information before making decisions based on it. The opinions expressed are solely those of the author and do not necessarily reflect the views or opinions of any organization or entity mentioned

What could revolutionize the AIF space in India

India’s alternative investment funds (AIFs) industry has witnessed a rapid pace of growth since its origination. The commitments raised, which denotes amount clients are willing to invest in AIFs, surpassed INR 7 lakh crore (in the Sep 2022 quarter) within a decade of its inception. In contrast, the mutual funds industry achieved an AUM of the same level over four decades in mid-2009, after the first scheme was launched in 1964. Between September 2014 and 2024, or over a period of ten years, AIF commitments grew at an annual pace of ~54%.

Due to increasing awareness and recognition of AIFs as a preferred alternative investment vehicle, the growth in the number of schemes was phenomenal with new entrants and demand for new schemes. As depicted in the chart below, the number of schemes increased nearly threefold between FY19 and FY25 (as of June 2024).

The major factor that is driving the growth in AIFs is their low correlation to public markets, regulatory support, and their ability to provide a diversified investment portfolio, mitigating the risk profile of investors. Hence, high net-worth individuals (HNIs) and family offices are increasingly preferring AIFs instead of limiting themselves to traditional asset classes to diversify risk in their portfolio.

In the recent past, the majority of incremental funds have been raised in Category II and Category III AIFs. While Cat III investments are predominantly concentrated in listed equities, the growth in Cat II funds have been contributed by the Private Credit segment with debt investments contributing 40% to the segment as of September 2024, as per data released by SEBI. Higher volatility in the market due to consequences of black swan events like Covid-19, geo-political tensions, etc., and other macroeconomic factors have been a major concern for traditional investments. Given these issues, Debt AIFs fit well into the criteria providing higher risk-adjusted returns and inflation hedging.

Huge room for growth

Despite the rapid growth in the number of schemes and commitments, the AIF industry is yet to mature to a much larger size given the lesser restrictions it enjoys with respect to investment in the unlisted universe compared to mutual funds and the risk-return spectrum it offers. Its potential to grow can be gauged from its share in the overall asset size of pooled investment vehicles in the country, which is much smaller than what it is in other developed countries like the US.

The Engines of Growth

  • HNI base

Is there inherent strength to support the growth potential of AIFs in India? There is indeed a significant pool of wealthy individuals who all can be the target group to tap the underpenetrated market. As per a recent report, the number of ultra-high net-worth individuals (UHNIs) in India, with a net worth of over US$30 million, is expected to witness the highest growth (~50%) for any country across the world between 2023 and 2028.

  • Accreditation

The Accreditation Investors framework, initiated by SEBI in 2021, holds the key to the paradigm shift in the AIF industry. This is primarily because the market regulator has allowed Accreditation Investors under the framework to invest with ticket sizes that are lower than the stipulated minimum amount of INR 1 crore. The premise of the framework is based on a class of investors, who are equipped with good knowledge about the risk and returns of financial products, have the ability to make informed decisions about their investments, and meet certain income eligibility criteria.

Certificates for Accredited Investors would be provided by Accreditation Agencies, which can be subsidiaries of stock exchanges or depositories (National Securities Depository Limited or Central Depository Services Limited) or any other institution that meets the eligibility criteria.

The relaxed criteria in minimum investment will be able to unlock the potential of the AIF industry by enabling investors to enter the market who were previously backing off due to higher ticket sizes.

  • Listing of fund units

The development of a secondary market for AIFs is essential to ensure liquidity in the AIF industry. As per Section 14 of SEBI’s AIF regulations, units of close-ended AIFs may be listed on a stock exchange subject to a minimum tradable lot of INR 1 crore, after the final close of the fund or scheme.

The listing of AIF units would

  • Ensure liquidity by allowing investors an easy exit opportunity (subject to KYC) due to dematerialisation and enabling price discovery in a demand-supply mechanism
  • Create a more enabling environment for Pension Funds, which are more inclined to investing in listed securities according to PFRDA guidelines, to invest in AIF units.

In this regard, clear operational guidelines should also be established by the regulator with respect to standardisation of contribution agreements, handling of fractionalised units, tradable lot sizes for Accredited Investors, and involvement of merchant bankers in the listing process.


Disclaimer: The information provided in this article is for general informational purposes only and is not an investment, financial, legal or tax advice. While every effort has been made to ensure the accuracy and reliability of the content, the author or publisher does not guarantee the completeness, accuracy, or timeliness of the information. Readers are advised to verify any information before making decisions based on it. The opinions expressed are solely those of the author and do not necessarily reflect the views or opinions of any organization or entity mentioned.

The Pulse – A monthly digest of key macroeconomic events (January 2025)

“Interest rates are to asset prices what gravity is to the apple” – Warren Buffett


Executive Summary

The year 2025 had a volatile start with President Trump’s inauguration and tariffs in play. While tariffs weren’t levied on the first day as widely anticipated, they did eventually find their way through the month, though not by the same magnitude as part of his poll promises. Meanwhile, the US Fed stayed the course in the first meeting of the year, keeping rates unchanged. However, the central bank’s tone was perceived to be marginally on the hawkish side. The CPI reading was comforting for markets with headline in line with expectations and core CPI a tad softer. Treasuries rallied across the curve on the back of this from intra-month highs, and the dollar index also showed marginal retracement. Elsewhere, the European Central Bank (ECB) continued its rate cut path while the Indonesian Central Bank surprised with a cut with a focus on growth and Japan hiked. With uncertainty around US policies, markets will likely remain volatile in the near future.

On the domestic front, the Reserve Bank of India (RBI) came up with measures to ease the system liquidity deficit, including Open Market Operations, FX Swaps, and VRR auctions. The consumer price inflation (CPI) moderated, while Index of Industrial Production (IIP) data came in stronger, with improvements across segments. On the currency side, strong depreciation pressures on INR were noted after an extended period of calm earlier in 2024, stemming from stronger USD, weaker balance of payments (BoP), with stress on capital account balance on the back of non-stop foreign portfolio investors (FPI) withdrawals from the equity segment. A large part of the pressure on the currency is on account of the stronger USD, with INR finally catching up to its emerging market peers. The new RBI regime also seems to be more comfortable with some volatility in the currency pair as opposed to the previous regime which kept the pair in a tight range with a weaker BoP position and continued strength in the dollar index.

Domestic Updates

India’s retail inflation abates to 4-month low, wholesale inflation rises

The retail inflation in India, measured as a change in the Consumer Price Index (CPI), moderated to a 4-month low of 5.22% YoY in December from 5.48% YoY in November. This is attributable to food inflation that declined to a 4-month low of 8.39% YoY in December from 9.04% YoY in November. Vegetable inflation, that contributes significantly to the food inflation, also fell to 26.56% in December from 29.33% YoY in November.

Inflation based on the wholesale price index (WPI) rose to a 6-month high of 2.37% YoY in December from 1.89% YoY in November. The rise is attributed to higher inflation for primary articles (which includes food articles, non-food articles, and minerals) to 6.02% in December from 5.49% in November, while inflation for the manufacturing segment edged up 2.14% in December from 2% in November.

Meanwhile, retail inflation for farm and rural workers softened further to 5.01% YoY and 5.05% in December, respectively, from 5.35% YoY and 5.47% in the previous month.

The retail inflation for industrial workers (IW), measured by the CPI-IW, fell to 3.88% in November from 4.41% in October.

India’s industrial output growth accelerates to a 6-month high

India’s industrial output, as measured by the Index of Industrial Production (IIP), rose to a 6-month high of 5.2% in November from 3.5% in October. All three sectors in the IIP basket Manufacturing, Mining and Electricity contributed towards this growth. Manufacturing sector output grew 5.8%, while mining, and electricity output witnessed a growth of 1.9% and 4.4% respectively in November.

Centre’s GST collections shrink

India’s GST collections in December declined to a 3-month low of INR 1.77 lakh crore but increased 7.3% YoY. Among the states, Maharashtra recorded the highest collection (INR 29,260 crore) followed by Karnataka (INR 12,526 crore), Tamil Nadu (INR 10,956 crore), Gujarat (INR 10,279 crore), and Haryana (INR 10,403 crore). Net GST collections grew by 3.3% to INR 1.54 lakh crore in December 2024 from INR 1.49 lakh crore in December 2023.

NSO expects slowdown in India’s GDP growth

Indian economy is estimated to grow at 6.4% in FY25, significantly lower than 8.2% in FY24 as per the first advance estimate by the National Statistics Office (NSO) and Ministry of Statistics & Programme Implementation (MoSPI). The expected slowdown in the economy could be attributed to stagnation in investments and moderation in manufacturing. This estimate is lower than the RBI`s projection of 6.6% for FY25. Despite the 7-quarter low GDP growth of 5.4% in the July-September quarter, the government expects agricultural and industrial growth to pick up along with an increase in rural demand to achieve the targeted growth by FY25.

Unified Pension Scheme – an improvement over existing National Pension System

The central government of India has launched a Unified Pension Scheme (UPS) for central government employees covered under the National Pension System (NPS) effective from April 1, 2025. The employees have an option to choose UPS or stay with the existing NPS, however, once they opt for UPS, they won’t be able to switch back. UPS is designed to provide financial stability to government employees after their retirement with a guaranteed pension and an inflation cover.

No GST on penalties imposed by banks and NBFCs

The Central Board of Indirect Taxes and Customs (CBIC) stated that non-compliance charges levied by banks and NBFCs are to prevent breaches and not compensation against the loss. Hence, penal charges imposed by banks and NBFCs on non-compliance by borrowers fall outside the scope of taxable services and will not be taxed at 18% GST.

India’s trade deficit abates

India’s merchandise trade deficit narrowed to a 3-month low of US$21.9 billion in December 2024 from US$32.8 billion in November driven by ~50% drop in gold imports. Merchandise exports contracted by 1% YoY to US$38.01 billion while imports grew 4.9% YoY to US$59.95 billion. In April-December 2024, imports rose 5.1% YoY while exports grew 1.6%.

India’s unemployment rate worsens but not unusual for December

The unemployment rate in India increased to 8.3% in December from 8% in November, according to the survey by the Centre for Monitoring Indian Economy (CMIE). The rise is not unusual as unemployment rises every December due to a lean period. However, the rate in December 2024 is lower compared to December 2023. Moreover, urban unemployment has decreased to 6.4% in Q2 FY25 from 6.6% in Q2 FY24 while both the Labour Force Participation Rate (LFPR) and Worker-to-Population Ratio (WPR) have increased during this time, as per the 2023-24 annual Periodic Labour Force Survey (PLFS) report.

India’s forex reserves spike

India’s foreign exchange reserves increased to US$629.55 billion as of 24th January following a 7-week decline, as the rupee strengthened by 0.5% due to forex market interventions by the Reserve Bank of India. The surge in reserves by US$5.5 billion during the week marks the highest in the last 4 months. The primary contributor towards this growth is the foreign currency assets (FCAs) that grew US$4.7 billion to US$$537.89 billion in the period. Moreover, in the reported week, gold reserves went up by US$704 million to US$69.65 billion, as per RBI data.

India’s direct tax collection surges in FY25

During the April 1, 2024 — January 12, 2025, India’s net direct tax collection grew 16% to INR 16.9 lakh crore, according to the latest data from the Central Board of Direct Taxes. The gross direct tax collections were up by 20% to INR 20.64 lakh crore from INR 17.21 lakh crore. Corporate tax collection stood at INR 7.7 lakh crore in the same period, while Securities Transaction Tax (STT) collection, a component of direct tax, stood at INR 44,500 crore (75% growth YoY).

Passenger vehicle sales declines

Total passenger vehicle sales in India fell 2% YoY to 293,465 units in December 2024 from 321,943 units in November, as per the data from the Federation of Automobile Dealers Association (FADA). The decline is attributed to limited launches and deferment of purchases by buyers to January. All other categories witnessed a slowdown – 2-wheeler sales declined 17.6% YoY, 3-wheeler fell 4.5%, and commercial vehicles decreased 5.2%, except the tractor segment which registered a growth of 25.7% YoY.

Global Update Roundups

Monetary Policies

  • US: The US Federal Reserve held its key interest rates steady pausing its rate-cutting cycle after three consecutive reductions in 2024. The overnight borrowing rate is kept unchanged in a range between 4.25%-4.5%, which is in line with expectations. In the post-meeting comment, the Fed justified the stance with an optimistic view on the labour market while avoiding the key reference of inflation progressing towards the central bank’s 2% goal. The Fed Chair Jerome Powell said, “We feel like we don’t need to be in a hurry to make any adjustments,” adding that decisions will remain data-driven.
  • Euro zone: The European Central Bank (ECB) cut its key interest rate by 25 bps to 2.75%, in line with the expectations, amid an uncertain economic outlook. This marks the fourth consecutive cut to the eurozone deposit rate in a unanimous decision. In its press release, ECB said, “The disinflation process is well on track. Inflation has continued to develop broadly in line with the staff projections and is set to return to the governing council’s 2% medium-term target in the course of this year”.
  • Japan: The Bank of Japan (BoJ) raised its key short-term interest rate by 25 bps to 0.5%. The hike is in line with expectations but took the rate to the highest level in 17 years.  This was the 3rd rate hike by the central bank after ending the negative interest rate regime in March 2024. The move is led by momentum in wage hikes and steady progress in inflation.
  • Canada: The Bank of Canada cut its benchmark interest rates by 25 bps to 3%, which was in line with expectations. With this, the cumulative reduction was 200 bps since the start of the rate cut cycle in June 2024. This happens as the central bank saw inflation converging to the 2% target in recent months, a trend that is expected to continue for the next 2 years.
  • Indonesia: The Bank of Indonesia cut its benchmark interest rates by 25 bps to 5.75% in an unexpected move as it defied market expectations of a pause. The decision is backed by central bank’s commitment to control inflation in the target range of 2.5±1% for 2025 and 2026, stabilizing the domestic currency, and supporting economic growth amid global uncertainty.

GDP growth

  • US: The economic growth decelerated to an annualised rate of 2.3% in the fourth calendar quarter of 2024, down from the previous quarter’s growth of 3.1% and 2.6%, the advance estimate of the Bureau of Economic Analysis. While consumer spending increased for both goods (6.6% vs 5.6%) and services (3.1% vs 2.8%), there was a contraction in both exports (-0.8% vs 9.6%) and imports (-0.8% vs 10.7%). Government expenditure also had a sluggish growth of 2.5% vs 5.1% in the previous quarter.
  • China: The GDP growth accelerated to 5.4% YoY in Q4 2024 from 4.6% in Q3 2024, surpassing market estimates of 5%. This has been the strongest annual growth in 1.5 years driven by a series of measures implemented by the government since September to boost economic recovery. In December, exports grew double digits as businesses rushed to complete their shipment in anticipation of high tariffs under the Trump administration, while imports increased to a 27-month high.

IMF’s global growth prediction remains steady

The International Monetary Fund (IMF) kept their global growth projection for both FY25 and FY26 steady at 3.3% compared to their October 2024 World Economic Outlook (WEO) forecast. The estimate is lower than the historical (2000–19) average of 3.7%. The prediction for 2025 remained unchanged as the upward revision in US GDP offset the downward revision in other major economies. IMF expects global headline inflation to slow down to 4.2% in 2025 and 3.5% in 2026, due to faster disinflation with easing of supply-side pressures and restrictive monetary policies.

Unemployment

  • US: Unemployment rate in the US eased to 4.1% in December 2024 from 4.2% in the previous month and came in below the market expectations of 4.2%. The number of unemployed individuals decreased to 6.8 million in December from 7.1 million in the previous month. The labour force participation rate was steady at 62.5% in the month.
  • UK: The unemployment rate inched up to 4.4% in November from 4.3% in October and came in above the market estimate of 4.3%. This is the highest unemployment rate for three months as the number of individuals that were unemployed for up to 12 months increased to 1.77 million in November. On the other hand, employed individuals grew by 35,000 to 33.78 million driven by growth in full-time employment and self-employed workers.
  • Canada: The unemployment rate in Canada eased to 6.7% in December from the record high of 6.8% in November, defying the consensus estimates of 6.9%. The number of unemployed population declined by 24,200 to 1,492,100 while the joblessness among youth rose (+17,600 to 462,200) in December. The labour force participation rate remained unchanged at a 4-month high of 65.1%.
  • China: The unemployment rate in China increased to a 3-month high of 5.1% in December 2024 from market estimates and November’s reading of 5%. The jobless rate for local registered residents rose 0.1 percentage points (pp) to 5.3%, non-local registrants to 4.6%, and non-local agricultural registrants to 4.5%.
  • Japan: The unemployment rate softened to 2.4% in December 2024 compared to the market consensus and November’s readings of 2.5%. The number of unemployed individuals stood at 1.7 million in December. The non-seasonally adjusted labour force participation rate increased to 63.4% in December 2024 from 62.8% in December 2023. The jobs-to-applications ratio was steady at 1.25 in the month under study.
  • Euro: The unemployment rate in the Euro Area edged up to 6.3% in December (in line with market forecast) from a record low of 6.2% in November. The number of unemployed increased by 96,000 MoM to 10.8 million.

Inflation readings

  • US: Consumer price inflation in the US accelerated for the third consecutive month to 2.9% YoY in December from 2.7% in November. The inflation was in line with market expectations. The rise is attributable to low base effects owing to a lesser decline in energy costs (-0.5% vs -3.2% in November) and acceleration in inflation for food (2.5% vs 2.4%), transportation (7.3% vs 7.1%), and lesser fall in prices of new vehicles (-0.4% vs -0.7%).
  • Eurozone: The inflation rate in the Euro Area rose to a 5-month high of 2.4% YoY in December from 2.2% in November in line with both market expectations and preliminary estimates but decelerated from 2.9% in December 2023. Segment-wise contributors to inflation are services (4% in December vs 3.9% in November) and processed food, alcohol, and tobacco (2.9% vs 2.8%) which was offset by unprocessed food (1.6% vs 2.3%). Core inflation, which excludes prices for energy, food, alcohol & tobacco remained the same at 2.7%.
  • UK: The inflation rate in the UK unexpectedly moderated to 2.5% YoY in December from 2.6% in November, below the consensus estimates of 2.6%. The downward pressure majorly came from restaurants and hotels, recreation and communication, services, transport, and air fares. On the other hand, upward pressure on inflation mostly came from motor fuels, and housing and utilities. Inflation for food and non-alcoholic beverages remained unchanged.
  • China: China’s consumer inflation rate edged down to 0.1% YoY in December from 0.2% in November in line with the market estimates. This marked the lowest level since March 2024. The decline in food prices after rising consequently for the past 4 months is attributed to the fall in inflation.
  • Japan: The annual inflation rate in Japan escalated to 3.6% YoY in December, the highest reading since January 2023, from 2.9% in November. This hike was majorly driven by food prices (6.4% vs 4.8% in November) with vegetables and fresh food being the main contributor. Additional upward pressure came from electricity prices (18.7% vs 9.9%) and gas cost (5.6% vs 3.5%) as the subsidies have been discontinued since May.

Consumer confidence

  • US: The consumer confidence fell to a 4-month low of 104.1 in January 2025 from a revised 109.5 in December and came in lower than the forecast of 105.7. This decline is fuelled by pessimism on current and future business conditions. Moreover, consumers are feeling less optimism on labour market and employment.
  • Japan: Japan’s consumer confidence index marginally dropped to 35.2 in January 2025 from 36.2 in the previous month, below market expectations of 36.6. This is the lowest reading since September 2023. All sentiment indicators witnessed a decline – overall livelihood (32.2 vs 34.1), income growth (39.9 vs 40.2), employment (41.0 vs 41.2), and willingness to buy durable goods (27.5 vs 29.4).
  • UK: The GfK consumer confidence index in the UK fell by 5 points to -22 in January 2025, marking its lowest reading since November 2023. The decline is a sign of growing economic concerns as all the measures such as Personal Financial Situation in the last 12 months and the next 12 months, General Economic Situation in the last 12 months and the next 12 months, and Major Purchase Index that make up the Overall Index Score dropped compared to previous month. The government`s decision to raise taxes also impacted the reading.
  • Euro: The consumer confidence in the Euro Area rose by 0.3 points to -14.2 in January 2025, in line with the initial estimates. While the consumer confidence and their intention to make major purchases remained unchanged, their expectations from the economy improved marginally.

Balance of Trade

  • China: China’s trade surplus surged to US$104.84 billion in December from US$97.44 billion in November, surpassing expectations of US$99.80 billion. It’s the largest trade surplus reported since February 2024. Exports jumped 10.7% YoY, surpassing the estimate of 7.3% in anticipation of tariffs from the upcoming US administration. Imports also rose unexpectedly by 1% YoY in December recovering from a 3.9% fall in November.
  • UK: The UK’s trade deficit dropped to £4.76 billion in November from an upwardly revised £5.01 billion in October. Imports grew 0.6% MoM to a 5-month high of £72.79 billion, while exports grew 1% to a 4-month high of £68.03 billion.
  • Japan: Japan reported a trade surplus rose of JPY 130.94 billion in December compared to a deficit of JPY 110.3 billion in November, beating the forecast of a JPY 55 billion deficit. It’s the first trade surplus reported since June 2024 driven by an increase in exports compared to imports. Exports rose to a record high of JPY 9,910.60 billion, while imports increased to a 5-month high of JPY 9,779.67 billion.


Disclaimer:

The details mentioned above are for information purposes only. The information provided is the basis of our understanding of the applicable laws and is not legal, tax, financial advice, or opinion and the same subject to change from time to time without intimation to the reader. The reader should independently seek advice from their lawyers/tax advisors in this regard. All liability with respect to actions taken or not taken based on the contents of this site are hereby expressly disclaimed.

“Accredited Investors” framework: A Welcome Move to Invest in AIFs

The concept of Accredited Investors is not new. At the global level, Accredited Investors are investors who are financially sophisticated and have a reduced need for the protection provided by regulatory disclosure filings. It has emerged in asset management jurisdictions of countries like the US, Singapore, and Hong Kong, where regulatory norms are relaxed for a class of sophisticated investors (for example, “Qualified Clients” in the US) due to their higher industry knowledge and larger appetite for risk.

In India, the Securities and Exchange Board of India (SEBI) approved the framework for Accredited Investors for the Indian securities market in June 2021. The market regulator aimed to create lighter regulations for a class of investors, who are equipped with good knowledge about the risk and returns of financial products — mainly the complex ones such as alternative investment funds (AIFs) and portfolio management services (PMS) — and have the ability to make informed decisions about their investments.

SEBI also allowed Accredited Investors to invest with ticket sizes that are lower than the stipulated minimum amount as per the regulations in respective financial products. Eventually, SEBI came up with detailed modalities of the framework for Accredited Investors framework and amended the regulations for AIFs, PMS, and Investment Advisers accordingly.

Who all can be Accredited Investors?

* Value of the primary residence of the individual, Karta of HUF and the Sole Proprietor, respectively, shall not be considered for NW calculation

Note: If investments are jointly held and the holders are parent and children at least one member must fulfil the eligibility criteria to qualify as Accredited Investors. If the joint holders are spouses their combined income/net worth will be considered.

Who will provide the certification for Accredited Investors?

Certificates for Accredited Investors would be provided by Accreditation Agencies, which can be subsidiaries of stock exchanges or depositories (National Securities Depository Limited, NSDL, or Central Depository Services Limited, CDSL) or any other institution that meets the eligibility criteria. For the subsidiaries to qualify as Accreditation Agencies, the stock exchanges should meet a few conditions like minimum of 20 years of presence in the Indian securities market, an NW of at least INR 200 crores, presence of nationwide terminals, etc.

As of date, there are three entities recognised by SEBI as Accreditation Agencies:

  1. BSE Administration & Supervision Ltd (wholly owned subsidiary of BSE Ltd)
  2. CDSL Ventures Limited (wholly owned subsidiary of CDSL)
  3. NSDL Database Management Ltd (wholly owned subsidiary of NSDL)

If the applicant meets the eligibility criteria, they will be issued an Accredited Investors certificate, which will have

  • A unique accreditation number
  • Name of the accreditation agency
  • PAN of the applicant
  • Validity of accreditation**

As per the SEBI circular issued on Dec 18, 2023, Accreditation Agencies would grant accreditation solely based on the Know Your Customer (KYC) documents and financial information of the applicants.

** (i) The validity will be 2 years from the date of issuance if the applicant meets the eligibility criteria for preceding one financial year.

(ii) The validity will be 3 years from the date of issuance if the applicant meets the eligibility criteria in each of the preceding 2 financial years.

(iii) The validity will be 2 years from the date of issuance in case of a newly incorporated entity, which does not have financial information for the preceding financial year but meets the applicable net-worth criteria as on the date of application.

Required documents

  • Copies of Income Tax Return(s) or ITR Acknowledgement (Only in case of individuals/HUF/Family Trust/Sole Proprietorship), or;
  • Copies of audited Financial Statements, or;
  • Copies of Audited Financial Statements prepared by the statutory auditor for the current financial Year (Only in case the entity is incorporated in the same financial Year), or;
  • Net worth Certificate from practicing chartered accountant (The latest net-worth certificate shall not be older than 6 months).

Implications for AIF investors

SEBI’s Accredited Investors framework can help investors gain access to alternative investment funds, including alternative debt funds, instead of limiting themselves to traditional asset classes, to diversify risk in their portfolio. The higher ticket size of INR 1 crore made AIFs more or less exclusive to high net-worth individuals (HNIs) and financial institutions but not anymore with the Accredited Investors framework.

With the new Accredited Investors framework, investors will be able to infuse an amount in AIFs that could be much lower than the stipulated minimum amount of INR 1 crore, subject to appropriate disclosures and terms of the agreement between the investor and fund manager.

Digital Onboarding Platform

The Mutual Fund Distributors (MFDs) or Registered Investment Advisors (RIAs) can also get their clients to become accredited investors by leveraging Vivriti AMC’s Accredited Investor Digital Onboarding Platform. This platform streamlines the certification process, ensuring a seamless and efficient experience.

With the investor’s consent, the platform collects the necessary data based on their investor category. Basis the data the draft format is prepared and sent to the investor for review and approval. Once the investor approves, data is shared with an Accredited Agency, and an accreditation certificate is received post-payment. The platform simplifies what can otherwise be a complex process, ensuring that clients are certified as Accredited Investors conveniently and securely.


Disclaimer: The information provided in this article is for general informational purposes only and is not an investment, financial, legal or tax advice. While every effort has been made to ensure the accuracy and reliability of the content, the author or publisher does not guarantee the completeness, accuracy, or timeliness of the information. Readers are advised to verify any information before making decisions based on it. The opinions expressed are solely those of the author and do not necessarily reflect the views or opinions of any organization or entity mentioned.

The Pulse – A monthly digest of key macroeconomic events (December 2024)

“In the last few years, we have traversed one of the most difficult periods in the history of the Indian economy and, perhaps, in the global economy…It was a period of relentless turbulence and jolts, and as a country we can derive satisfaction that the Indian economy has just not navigated this period of trials successfully but has emerged stronger.” — Shaktikanta Das, Former RBI Governor


Executive Summary

The US Fed delivered a hawkish 25 basis points (bps) cut this month, with the median dot plot rising by 50 bps for both 2025 and 2026, implying Fed members see lower rate cuts in the next two years. Chairman Powell’s tone was also hawkish during the press conference, with statements like “we are significantly closer to neutral” while saying that they would be cautious about further cuts. However, he also simultaneously noted that the policy is still sufficiently restrictive. Markets reacted with a steeper rate curve and stronger dollar index, with emerging market economies facing depreciation pressures as well. All eyes are on Trump resuming office this month, with markets anticipating tariff actions very soon. Uncertainty around policies will keep markets on edge and volatility is likely to continue. Elsewhere, the European Central Bank cut benchmark rates by another 25 bps while Japan maintained the status quo. With the slower rate cut expectations in the US in 2025 amidst a relatively stronger economy, interest rate differentials along with Trump’s expected policy measures will continue to favour stronger dollar trade.

On the domestic front, RBI MPC kept rates on hold with a 4-2 vote and maintained a Neutral stance. The MPC acknowledged the tightening liquidity conditions and cut the CRR rate by 50 bps to 4% to infuse INR 1.16 lakh crore liquidity into the banking system. MPC minutes showed increasing concerns about growth and with the regime change, markets are now expecting rate cuts starting February. On the forex front, INR saw depreciation pressures, largely on the back of a stronger dollar with most Asian currencies facing the heat. The central bank continued to smoothen the move. The forex reserves are down about 10% from the peak US$705 billion, a majority of which was spent to smoothen INR depreciation. Despite the drawdown, the currency buffer still remains strong and will help the central bank in containing volatility.

Domestic Updates

India’s retail inflation moderates closer to RBI’s upper band, wholesale inflation shrinks

The retail inflation in India, measured as a change in the Consumer Price Index (CPI), eased to a 3-month low of 5.48% YoY in November, returning to the RBI`s target band of 2-6% from 6.21% YoY in October 2024. The softening is attributed to food inflation, which accounts for ~40% of the overall basket and fell to a 3-month low of 9.04% YoY in November from 10.87% YoY in October. The significant decline in vegetable inflation from 42.18% YoY in October to 29.33% YoY in November mainly contributed to the declaration of food inflation.

Inflation based on the wholesale price index (WPI) slightly dropped to 1.89% YoY in November from a 3-month high of 2.36% in October. Inflation for primary articles softened to 5.49% in November from 8.09% in October, while inflation for the manufacturing segment further increased to 2% in November from 1.5% in October.

Meanwhile, retail inflation for farm and rural workers dipped to 5.35% YoY and 5.47% in November 2024, respectively, from 5.96% YoY and 6.00% in the previous month.

India’s industrial output rises led by manufacturing

India’s industrial output, as measured by the Index of Industrial Production (IIP), edged up to 3.5% in October from 3.1% in September. This increase was driven by the manufacturing sector output, which grew by 4.1% in October compared to 3.9% in September. The other core industries output, including mining and electricity, witnessed a moderate growth of 0.9% and 2%, respectively.

RBI MPC maintains status quo, cuts CRR

The Reserve Bank of India (RBI) kept the repo rate unchanged at 6.5% in its 5th bi-monthly monetary policy committee (MPC) meeting of FY25 with a 4:2 majority. With this, the benchmark rate has been kept unchanged for the 11th straight meeting. The MPC maintained its policy stance at ‘Neutral’, which allows flexibility to track the progress of inflation and growth and take appropriate actions when necessary.

The cash reserve ratio (CRR) was cut by 50 bps to 4% in response to ongoing liquidity stress in the banking system. The CRR reduction is expected to release INR 1.16 lakh crore into the banking system in 2 tranches and support credit growth and economic activity.

Following are the revisions in GDP growth and Inflation forecasts announced by the MPC:

RBI enhances limit for collateral free loan for farmers

In another move, the RBI has enhanced the collateral-free loan limit for farmers from INR 1.6 lakh to INR 2 lakh, effective January 1, 2025, in an effort to support small and marginal farmers amid rising input costs. As per RBI directives, banks across the country are asked to waive collateral and margin requirements for agricultural and allied activity loans up to INR 2 lakh per borrower.

Indian household debt surge, RBI FSR

According to the RBI’s Financial Stability Report (FSR), the debt of Indian households increased to 42.9% of GDP (at current market prices) in the second quarter of 2024 from 42.7% of GDP in the first quarter of 2024. However, as per RBI, it indicates a positive trend as the surge is primarily driven by an increase in the number of borrowers rather than a rise in average indebtedness per individual. As of March 2024, borrowing by individuals accounted for 91% of total household financial liabilities. Three main factors are identified for household borrowing: Consumption (personal loans, credit card debt, and loans for consumer durables), asset creation, and productive activities.

GST collections grew substantially

India’s GST collection grew 8.5% YoY to INR 1.82 lakh crore in November 2024. Among the states, Maharashtra had the top collection (INR 29,948 crore) followed by Karnataka (INR 13,722 crore), Gujarat (INR 12,192 crore), Tamil Nadu (INR 11,096 crore), and Haryana (INR 9,900 crore). For the April-November period, tax collections increased by 9.3% YoY to INR 14.57 lakh crore in FY25.

Finance Ministry of India, ADB projects India’s FY25 GDP growth at 6.5%

The Asian Development Bank (ADB) has revised India’s GDP growth forecast lower to 6.5% from its previous estimate of 7% due to lower-than-anticipated growth in private investment and housing demand. As per the multilateral development bank, changes in US trade, fiscal, and immigration policies could adversely impact growth and inflation in developing Asia and the Pacific.

The Finance Ministry of India in their Monthly Economic Review has projected economic growth at 6.5% in FY25 after a decline in growth from 6.7% in the April-June quarter to 5.4% in the July-September quarter, driven by gains in agricultural and industrial activities. The ministry’s outlook is also based on a favourable demand outlook in rural and urban areas in the initial months of H2FY25.

The Organisation for Economic Co-operation and Development (OECD) upgraded its growth forecast to 6.8% from its earlier estimate of 6.6% due to growth in investments and recovery in the agricultural sector.

India’s trade deficit reaches record high

India’s merchandise trade deficit rose to an all-time high of US$37.8 billion in November widening sharply from US$20.6 billion in November 2023. This was driven by a contraction in merchandise exports by 4.8% YoY to US$32.11 billion and a 27% YoY rise in imports to US$69.95 billion, which is an all-time high.

India’s unemployment rate abates

The unemployment rate in India fell from 8.7% in October to 8% in November, according to the survey by the Centre for Monitoring Indian Economy (CMIE). The labour force participation rate (LPR), which is measured as a percentage of the working-age population, fell from 41.2% in October to 40.8% in November suggesting that fewer people were actively looking for a job.

India’s forex reserves continue to decline

India’s foreign exchange reserves dropped by US$4.1 billion to a 3-month low of US$640.28 billion as of December 27. The major contributor to this decline is US$4.6 billion decline in Foreign Currency Assets (FCAs) to US$551.92 billion. This reduction in reserves is attributed to RBI’s efforts aimed at stabilising the depreciation of the Rupee.

Passenger vehicle sales nosedive

Total passenger vehicle sales in India decreased ~14% YoY to 321,943 units in November from 483,159 units in October, as per the data from the Federation of Automobile Dealers Association (FADA). The auto dealers attribute the decline to the shift of festive demand to October, weak market sentiment, and limited new launches. However, 2-wheeler sales grew 15.8% YoY due to rural demand and year-end offers while 3-wheeler sales witnessed a comparatively modest growth of 4.2% YoY in November.

Global Update Roundups

Monetary policies  

  • US: The US Federal Reserve cut the benchmark interest rate by a quarter percentage point, as expected while cautioning about additional cuts in 2025 that will depend on the progress in lowering stubbornly high inflation. The overnight borrowing rate has been reduced to a target range of 4.25%-4.5%, which is back to the level of December 2022. The dot plot matrix suggested that there could be only two more cuts in 2025. Over the longer term, the Federal Open Market Committee (FOMC) sees the “neutral” funds rate at 3%. The FOMC raised its GDP growth forecast for full-year 2024 by half a percentage point to 2.5%. However, the FOMC officials expect GDP growth to decelerate to 1.8% in the long term. Expectations for headline and core inflation were pegged at 2.4% and 2.8%, respectively, slightly higher than September estimates and above the Fed’s 2% target. The projection for the unemployment rate is lowered to 4.2% for 2024.
  • ECB: The European Central Bank (ECB) lowered the three key interest rates — deposit facility, the main refinancing operations, and the marginal lending facility — by 25 bps to 3%, 3.15%, and 3.4%, respectively, with effect from 18 December 2024. The rate cut, the fourth one in 2024, is based on the revised outlook on inflation trajectory and its dynamics as well as the strength of monetary policy transmission. Headline inflation averaged 2.4% in 2024 and is expected to be 2.1% in 2025, 1.9% in 2026, and 2.1% in 2027. The ECB expects inflation to settle near the Governing Council’s 2% medium-term target on a sustained basis. Secondly, financial conditions are easing with the gradual transmission of rate cuts making debt cheaper for firms and households. However, the transmission is yet to run its full course making the debt market still tight.
  • UK: The Bank of England’s Monetary Policy Committee (MPC) kept the benchmark bank rate unchanged at 4.75% in its December meeting in a majority vote of 6:3. This happens as the MPC adopts a medium-term outlook with a forward-looking approach to achieve the 2% inflation target on a sustainable basis. Since the previous meeting, the 12-month consumer price inflation rose to 2.6% in November from 1.7% in September, mainly driven by stronger inflation in core goods and food.
  • China: The People’s Bank of China kept the one-year medium-term lending facility (MLF) rate steady at 2% as it aims to stabilize the domestic currency that has come under pressure following Donald Trump’s victory. The offshore yuan has lost more than 2% since the U.S. presidential election on November 5 and roughly 3.3% against the USD since Sep 24 when Beijing started the initial round of stimulus announcements.
  • Japan: The Bank of Japan kept its benchmark interest rate unchanged at 0.25% in order to take more time to assess the impact of financial and foreign exchange markets on Japan’s economy. The decision was based on a majority decision vote of 8:1. “In particular, with firms’ behaviour shifting more toward raising wages and prices recently, exchange rate developments are, compared to the past, more likely to affect prices,” the bank added.

GDP growth

  • US: The GDP grew at an annualized rate of 3.1% in Q3CY24, surpassing the second estimate of 2.8% growth and the previous quarter growth of 3% growth recorded. The growth is driven by an acceleration in the pace of personal spending growth (3.7% vs 3.5% in the second estimate) driven by a robust increase in consumption of goods (5.6%) and spending on services (2.8%).
  • Japan: The growth in the economy decelerated to 1.2% YoY in Q3CY24 from 2.2% in Q2. However, the growth was higher than the consensus estimates of 0.9%. The sluggish growth is attributable to moderation in capex due to rising interest rates and softer government spending.
  • Euro Area: The GDP growth accelerated to 0.4% on a seasonally adjusted QoQ basis in Q3CY24 from 0.2% in Q2 and to 0.9% in Q3 from 0.5% rise in Q2 on an annual basis, marking the strongest growth since Q1CY23. The uptick was driven by a boost in private consumption (0.7% in Q3 vs no growth in Q2) aided by softer price pressure and a rebound in fixed investment (2% in Q3 vs -2.4% in Q2)
  • UK: The pace of growth in the British UK economy quickened to 0.9% YoY in Q3CY24 from 0.7% YoY in Q2CY24, marking the highest growth since Q1CY23. The improvement is led by household spending and gross fixed capital formation partially offset by a slower than expected rise in government spending.

Unemployment

  • US: The unemployment rate inched up to 4.2% in November from 4.1% in October and 3.7% in November 2023. The number of unemployed individuals stood at 7.1 million in the month, up from 6.3 million a year earlier. The labour force participation rate, which indicates the percentage of working-age individuals who are employed or actively looking for work, declined to 62.5% in the month.
  • Canada: The unemployment rate in Canada rose to the highest level since September 2021 at 6.8% in November from 6.5% in October and surpassed the market consensus of 6.6%. In absolute terms, the number of unemployed increased substantially by 87,300 to 1,516,300 in the month as joblessness rose among the youth, the core aged population, and the older population. The labour force participation rate rose to a 3-month high of 65.1%.
  • China: Unemployment in China remained unchanged at 5%, which is a 5-month low, meeting market expectations. The jobless rate for local registered residents rose 0.1 percentage points (pp) to 5.2%, non-local registrants to 4.6%, and non-local agricultural registrants to 4.4%.
  • Japan: Japan’s unemployment rate was 2.5% in November 2024, remaining steady for the second consecutive month. The non-seasonally adjusted labour force participation rate increased to 63.5% in November from 63.1% in November 2023. The jobs-to-applications ratio remained at its highest level in 6 months at 1.25 for the second consecutive month.
  • Euro: The unemployment rate remain unchanged at 6.3% in November for the second consecutive month. The number of unemployed decreased by 39,000 MoM and 333,000 YoY to 10.8 million.

Inflation readings

  • US: The inflation rate accelerated for the second month to 2.7% YoY in November 2024 from 2.6% in October. The persistent rise in wages leading to higher consumer spending is one of the main contributing factors to the rise in inflation. The core inflation, which excludes volatile food and energy costs, rose 3.3% YoY, the same as in the previous month. Over the past three months, the core CPI averaged 3.7% at an annualized rate. Segment-wise, food, energy, medical care, and recreation indices increased during the month.
  • Eurozone: The inflation rate accelerated to 2.2% YoY in November from 2% in October but decelerated from 2.4% in November 2023. Segment-wise, the largest contributors to inflation are services (+1.74 pp), food, alcohol & tobacco (+0.53 pp), non-energy industrial goods (+0.17 pp), and energy (-0.19 pp).
  • UK: The inflation rate in the UK accelerated for the second month to 2.6% in November from 2.3% in October, moving further beyond the central bank’s target (2%) but meeting the consensus estimates. It’s the highest inflation recorded in 8 months led by a faster pace of price rises of recreation and culture (3.6% vs 3% in October), housing and utilities (3% vs 2.9%), and food and non-alcoholic beverages (2% vs 1.9%).
  • China: China’s inflation slowed to 0.2% YoY in November from 0.3% in October, marking it the lowest level since June and the consensus estimates of 0.5%. The fall in inflation is attributed to a slowdown in food prices at 0.1% YoY. Non-food inflation bounced to 0% after two months of YoY deflation.
  • Japan: The inflation rate rose to the highest level since October 2023 at 2.9% YoY in November. It rose from 2.3% in October led by a steep rise in food prices (4.8% vs 3.5% in October). Also, it was led by an acceleration in prices of electricity (9.9% vs 4.0%) and gas prices (5.6% vs 3.5%) due to the absence of energy subsidies since May.

Consumer confidence

  • US: The consumer confidence index fell to 104.7 in December from an upwardly revised 112.8 in November reflecting pessimism on current business conditions. This decline is further fuelled by negative sentiments on labour market, particularly on job opportunities. Moreover, consumers were also less optimistic about the future business conditions.
  • Japan: The Japan’s consumer confidence index dropped to 36.2 in December from 36.4 in November, below the market forecast of 36.6. This was driven by a marginal decline in sentiment to buy durable goods (29.4 vs. 29.9 in November) and a weaker outlook on overall livelihood (34.1 vs. 34.3), partially offset by higher optimism about employment (41.2 vs. 41.0) and steady confidence in income growth (at 40.2).
  • UK: The GfK Consumer Confidence Index in the UK shows a minor improvement of 1 point from -18 in November to -17 in December, showing growth momentum for the second month in a row. However, the consumer sentiment on the UK`s economic outlook is still gloomy.
  • Euro: The consumer confidence fell 0.8 points to -14.5 in December from -13.7 in November, below the market expectations of -14. This marked the lowest reading since April 2024.

Balance of Trade

  • US: In November 2024, the trade deficit broadened to US$78.2 billion from US$73.6 billion in October (revised). Exports increased 2.7%, reaching a new high of US$273.4 billion, driven by vehicle sales, and sale of crude oils and petroleum products, among others. Imports grew 3.4% to US$351.6 billion in November driven by the purchase of semiconductors, food, beverages, crude oil, and gold, among others.
  • China: China’s trade surplus grew 40% to US$97.44 billion in November 2024 from US$69.45 billion in November 2023, surpassing the forecast of US$95 billion. Exports surged 6.7% YoY, below the estimate of 8.5% and slowing from October’s increase of 12.7% as manufacturers placed orders in advance in anticipation of higher tariffs from the US. Imports fell 3.9% YoY, falling further from 2.3% in October due to slower domestic demand.
  • UK: The UK’s trade deficit rose 7.5% to £3.72 billion in October from £3.46 billion in September. Imports grew 1.3% MoM to £72.60 billion, while exports grew 1.0% to £68.88 billion.


Disclaimer:

The details mentioned above are for information purposes only. The information provided is the basis of our understanding of the applicable laws and is not legal, tax, financial advice, or opinion and the same subject to change from time to time without intimation to the reader. The reader should independently seek advice from their lawyers/tax advisors in this regard. All liability with respect to actions taken or not taken based on the contents of this site are hereby expressly disclaimed.
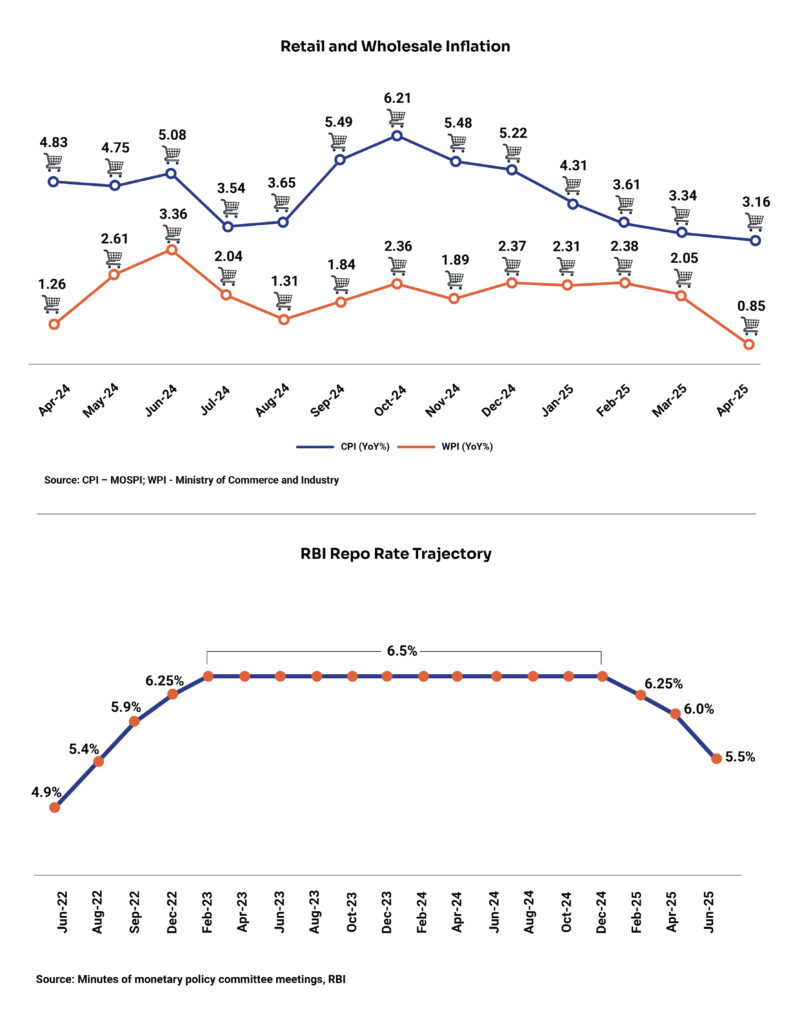
Freight Forwarding Sector – A Deeper Look

The logistics sector is crucial to the Indian economy and its development. It is valued at ~US$200-250 billion and employs over 2 crore people, making it one of the largest employers in the country (Economic Survey 2021). Freight forwarding (FF) is an integral part of the segment and forms an essential part of the supply chain specializing in transporting products between two places unlike a typical third-party logistics provider (or 3PL) that provides value-added services like packaging, documentation, warehousing, etc., to manage entire logistics needs for their clients.

For instance, an FF agent will move the cargo from the manufacturing plant (supplier’s factory/ warehouse) to a shipping port by truck and again from the destination port to the client’s facility/warehouse by the same/another mode of transportation. They offer different modes of shipment, viz. road, rail, ship, and air, be it a single mode or multimodal for a shipment.

In the entire process of shipment, the FF entity deals with several intermediaries like shipping lines, customs agencies, port authorities, etc., to execute the shipment. It’s a manpower-oriented process and need people with long presence in the industry. As a result, the fees charged by the FF entity factor in manpower and tracking costs along with other charges for the shipment.

The growth in the FF sector is a function of exports and imports from India. In FY24, imports constituted 61% of the gross merchandise trade and exports 39%. As a result, the container traffic is inclined towards imports than exports. However, as the Indian government is working towards expanding its export portfolio over its import portfolio beyond traditional sectors, the ratio is expected to reverse in the future.

Market Structure and Competition

Freight Forwarding sector is a part of the highly fragmented logistics industry with a presence of more than 2000 small and medium size players across the country. Currently, the unorganized players occupy ~90% of the logistics industry with organized players accounting for the rest.

However, the maturity and exponential growth in the industry depends highly on the shift from unorganized to organized sector with demand for value added services on the rise, digital transformation, and fast adoption of modern technologies in the segment. Few large players in the segment include players like DHL Global, Allcargo Gati, CH Robinson, DB Schenker, Kuehne Nagel, Expeditors, together accounting for less than 10-15% of the market.

The competitive edge in the industry depends on the type of business model players are adopting. It usually requires more than just the infrastructure.

Traditional model: Here, players usually track data on paper or in a limited digitized form and mostly rely on established processes and systems. They manage orders, transport and delivery manually or with legacy systems.

Digital model: The deviation from a traditional model to the digital model is marked by underlying processes of booking and managing freight. Digital FF entities use advanced technologies like the Internet of Things (IoT), GPS enabled real-time tracking, automation, blockchain, cloud computing, big data analysis, and artificial intelligence to coordinate and control shipment activities like carrier sourcing, vetting, tracking documentation, pricing, etc. Such technologies empower FF and their clients to stay informed about the exact location and status of their cargo, overall providing efficient and seamless solutions.

Challenges – Cost Factors

Logistics costs in India account for 13-14% of GDP compared to the average of 8-11% witnessed in major economies. The higher cost is attributed to inefficiencies in infrastructure, skewed modal share, and obsolete technologies. It is estimated that the final stage of the delivery process costs nearly 40% of the overall logistic cost.

Currently, India’s freight movement is heavily skewed toward road transportation unlike major economies. The skewed modal share resulted in higher spending on freight forwarding as cost of road transport (INR 2.5 per tonne/km) is significantly higher compared to other modes such as rail (INR 1.35 per tonne /km) and water (INR 1.1 per tonne /km) (KPMG, Oct 2022).

Some of the steps to mitigate the cost issues include:

  • A shift in the modal share of the sector by executing the long-haul transport via rail. Low-to-medium value non-bulk products can also be transported via rail and/or intermodal transport.
  • Optimize vehicle use and productivity via effective routing and loading.
  • Improve fuel efficiency by discarding old vehicles and shifting to electric vehicles or alternate fuels.

These apart, the Government of India (GoI) has taken multiple logistics specific initiatives to mitigate the issue. It plans to cut logistics costs from 13-14% of GDP to 8-10% of GDP by 2030. As per estimates, a 10% cut in indirect logistics cost can lead to 5-8% rise in exports as saving on logistics would bring down commodity prices making India more competitive in global markets.

The ranking of India (among 160 countries) in the Logistic Performance Index (LPI) by the World Bank improved from 54 in 2014 to 38 in 2023. The improvement is largely driven by GoI initiatives like GatiShakti (for multi-modal connectivity), National Logistics Policy (to upgrade the logistics infrastructure), Bharatmala (improving road networks), Sagarmala (for shipping and maritime), UDAN (regional airport development program), Dedicated Freight Corridors (improving rail freight network), etc., aimed at making India’s logistic infrastructure more agile, integrated and green.

Freight Rates

In the freight forwarding process, suppliers and customers have different FF agents. The type of quote for the FF service depends on which agent handles the shipment. If the supplier’s FF agent is handling the entire shipment, then it quotes the Cost, insurance, and freight (CIF) rate to the customer. On the other hand, if the customer’s agent handles the job, it procures the shipment at the Freight on Board (FOB) rate offered by the supplier while the former pays the FF fee to his own agent. Customers may compare the CIF and FOB rates and select the one which is cheaper. However, the cost is not the sole factor in selecting the rate but other factors such as what services are covered, additional fees, customs duties and taxes, insurance, etc.

The FF agents usually secure contracts with two to three shipping lines for each trade lane. The shipping lines quote rates (Tier 1, 2, and Spot rates) to FF agents based on the freight volume. For higher volume commitments, they quote Tier 1 rates that are 20-30% cheaper than spot rates.

Trend in freight rates

Historically, freight rates have been volatile as maritime trade is susceptible to several external factors like geopolitical incidents, crude prices, maritime accidents (like Egypt’s Suez Canal blockage in 2021), and other factors.

Freight rates shot up following the global financial crisis in 2008-10 and subsequently normalized from 2013-19 onwards before escalating sharply in the wake of the pandemic. In the last 2 years, rates started spiking again after an interim fall following the Red Sea crisis and the attack on vessels on the Suez Canal (which handles ~30% of container traffic worldwide).

The Containerized Freight Index, which tracks the cost of shipping containers on major trade lanes, reached an all-time high in January 2022.

In general, most of the volatility in freight rates is passed on to the customers. However, the absolute margins of FF agents are affected when there is a fall in freight rates.

Outlook

The demand for FF services is positively impacted by more and more large enterprises focusing on their core business activities and choosing to outsource supply chain distribution to intermediaries. The next leg of growth is expected to be driven by FF companies adopting new-age digital models and digitization aimed at addressing the inefficiency in business processes. Further, expansion of the e-commerce sector and GoI initiatives are expected to further support the growth.

As per the World Trade Organization, global merchandise trade volume is expected to rise 2.6% in 2024 and 3.3% in 2025. Industry experts believe the Indian FF market will grow at an annual rate of 5-6% during 2024-2029 while the entire freight and logistics market will grow at an annual rate of 9-10% in the same period.


Disclaimer:

The views provided in this article are of the author and do not necessarily reflect the views of Vivriti. This article is intended for general information only and does not constitute any legal or other advice or suggestion. This article does not constitute an offer or an invitation to make an offer for any investment.  

The Pulse – A monthly digest of key macroeconomic events (November 2024)

“The economy is not sending any signals that we need to be in a hurry to lower rates.”— Jerome Powell, Federal Reserve Chair


Executive Summary

November saw Trump regain the US presidency in a Republican sweep while the Fed continued the rate-cut trajectory reducing interest rates by another 25 basis points (bps) after the 50-bps trim in September. Markets were relatively well braced this time for a Trump victory with US10-year treasury selling off by almost 70 bps ahead of the elections. Increased tariffs, and corporate tax cuts amongst other Trump’s election promises, if implemented, would certainly prove to be inflationary making it hard for the US Fed to keep cutting rates. Markets reduced rate cut expectations by about 100 bps and priced in the significant term premium. Currency markets saw sharp movements as well, with the dollar index rising almost 2% on election results. While US yields and the dollar index cooled off from intra-month highs, uncertainty for markets remains given Trump’s unpredictability and volatile temperament, as seen during his last presidential tenure. We have already started seeing tweets and rhetoric throughout the month and markets now await Trump’s inauguration and specific policies that he will implement and their likely spillovers to the rest of the world. Till then, speculation and volatility will remain the norm in the market. Elsewhere, the Bank of England reduced rates by 25 bps and ECB is expected to reduce by another 25 bps later this month.

On the domestic front, a couple of weak data prints puts RBI in a delicate situation. Inflation came in higher than expected at 6.2%, with the core inflation at sub-4%. On the growth front, headline GDP sharply fell to a two-year low of 5.4% versus expectations of a north of 6%. Elevated inflation, weaker growth, and a fragile global backdrop make the next policy decision tougher for RBI. Given the focus on inflation from the RBI governor that we have seen over the last couple of months, it seems that the central bank will stick to a status quo on rates. Liquidity conditions have tightened as well of late, largely on the back of aggressive foreign exchange (FX) intervention, and on that front, we might see some support from RBI’s MPC meeting. On the FX front, the Indian currency (INR) has performed significantly better than its peers, largely on the back of central bank intervention. FX reserves are down ~$48bn from the peak, a majority of which was utilized for smoothening INR depreciation. While domestic fundamentals still remain strong, INR will not remain aloof from the EM complex and any sharp deterioration there on the back of US policies will have a follow-on impact on INR, though may not by the same magnitude. Despite the drawdown, the currency chest still remains strong, and central bank will continue to smoothen any sharp depreciation pressures on it.

Domestic Updates

India’s retail inflation breaches the RBI`s tolerance band, wholesale inflation rises to a 4-month high

The retail inflation in India, which measures a change in the Consumer Price Index (CPI), rose to a 14-month high of 6.21% YoY in October 2024 from 5.49% YoY in September and 4.87% YoY in October 2023. The rise in retail inflation is attributable to food inflation which grew at a double-digit rate of 10.87% in October compared to 9.27% in September. Vegetable inflation (42.2% YoY in Oct vs. 36% YoY in Sep) and Oils and fats inflation (9.51% YoY in Oct vs. 2.47% YoY in Sep) have contributed majorly towards the spike in food inflation in October.

As the rise in retail inflation remains a concern, RBI Governor Shaktikanta Das stated that the shift in neutral monetary policy stance does not signal a potential rate cut. He further added that there are ‘significant upside risks to inflation’ and that a rate cut would only be considered if inflation is sustainably closer to the RBI’s medium-term target of 4%.

Meanwhile, the Finance Ministry’s Monthly Economic Review highlighted that, despite existing pressures on select food items, food inflation is expected to ease with the agriculture sector likely to benefit from strong kharif harvest, increase in minimum support prices, adequate inputs, and favourable monsoons in the coming months. However, India`s economic outlook could still be impacted by geopolitical factors.

Inflation based on the wholesale price index (WPI) jumped to a 4-month high of 2.36% YoY in October from 1.84% YoY in September due to an increase in two out of three major segments of WPI – Primary Articles, Fuel and Power, and Manufactured Products. Inflation for primary articles increased to 8.09% in October from 6.59% in September driven by an increase in food prices while the inflation for the manufacturing segment slightly moved up to 1.5% in October from 1% in September.

India’s industrial output shows renewed momentum

India’s industrial output, as measured by the Index of Industrial Production (IIP), returns to its upward trajectory at 3.1% in September after declining by 0.1% in August. The manufacturing sector (the largest in the IIP basket) is the main growth driver with an increase of 3.9% YoY. Electricity generation grew 0.5% YoY, while mining output increased 0.2% YoY.

India’s real GDP growth slips to 7-quarter low

India’s economic growth slowed to a two-year low at 5.4% YoY in Q2FY25 against 8.1% YoY in Q2FY24. Despite the fall, India remains the fastest-growing economy (China’s GDP growth in the July-September quarter was recorded at 4.6%). Gross Value Added (GVA) also moderated to 5.6% in Q2 from 6.8% in Q1.

Inflation played a significant role in the slowdown of India`s real GDP growth. The surge in retail food inflation reduced the capacity of consumer spending. The deceleration is also attributed to the slowdown in all sectors except agriculture which stood at a 5-quarter high of 3.5%. Consumption and investment demand slowed down in the second quarter of FY25. However, consumption is expected to have picked up with the festive rural spending and upcoming wedding season in the third quarter of the fiscal year.

Gross FDI inflows grew 43% YoY in Q2FY25

Gross Foreign direct investment (FDI) in India surged 43% YoY to US$13.6 billion in July-September 2024 from US$9.52 billion in July-September 2023. Total FDI including equity inflows, reinvested earnings and other capital grew 28% YoY to US$42.1 billion in H1FY25. However, net FDI moderated to US$3.6 billion in H1FY25 from US$3.9 billion in H1FY24. In the July-September quarter, about 50% of inwards investments came from Singapore.

India’s trade deficit narrows

India’s merchandise trade deficit rose to a 2-month high of US$27.1 billion in October but narrowed on a year-over-year basis from US$30.4 billion in October 2023. This happened as the merchandise trade exports grew 17.3% YoY to US$39.2 billion while Imports rose ~4% YoY to $66.34 billion, which is an all-time high.

Unemployment rate surpasses 10% for first time in over 2 years

The unemployment rate surged to 10.1% in October from 7.1% in September, according to the survey by the Centre for Monitoring Indian Economy (CMIE). It’s the first time in 29 months the rate has surpassed 10%. As per CMIE, the rate generally remains high in October but it’s significantly high this year, which is attributable to a spike in rural unemployment from 6.2% in September to 10.8% in October. Urban employment went down to 8.4% in the month.

India’s forex reserves dip to 2-month low

India’s foreign exchange reserves dropped by US$2.7 billion to a 2-month low of US$682.13 billion on November 1. It was the fifth consecutive week of decline taking the previous four weeks’ decline to US$20.1 billion. The decline is attributed to RBI’s support to rupee amid foreign capital outflows amid geopolitical tensions and rise in demand for Chinese assets after Beijing’s stimulus measures.

New credit guarantee scheme for MSMEs

The Centre launched a new credit guarantee scheme for MSMEs, offering collateral-free loans of up to Rs 100 crore. Under the scheme, banks would use their own credit assessments instead of seeking third-party guarantees. The move is led by long-standing challenges to secure finances by MSMEs, mainly for term loans to purchase plant and machinery. The Centre also announced plans to open branches of the Small Industries Development Bank of India (SIDBI) in every MSME cluster across India in 2-3 years, with ~25 branches coming up this financial year.

Passenger Vehicle sales surge to highest-ever October print

Total passenger vehicle (PV) sales in India rose 0.9% YoY to its highest-ever October sales of 393,238 units, as per data from the Society of Indian Automobile Manufacturers (SIAM). This growth is fuelled by strong consumer demand during the festive season.

According to data from the Federation of Automobile Dealers Association (FADA), which shows actual retail sales from showrooms versus the SIAM, which puts out dispatches to dealers from auto factories, passenger vehicle sales grew by 32.4% YoY in October to 483,159 units. The growth is mainly driven by the rural market, especially in 2-wheeler and PV segments, supported by higher Minimum Support Price (MSP) for rabi crops. Two-wheelers saw an impressive growth of 36.3% YoY while 3-wheelers witnessed a comparatively modest growth of 11.5% YoY in October. In the 2-wheeler segment, good crop yields, favourable rural sentiments, and the upcoming wedding season are expected to drive demand, as per FADA.

Global Update Roundups

Monetary policies 

  • US: The Federal Reserve cut the benchmark overnight borrowing rate by 25 basis points (bps) to a target range of 4.50%-4.75%, as widely expected by the market, in a unanimous vote. This followed the Fed’s more aggressive 50 bps cut announced this September for the first time since 2020. The overnight rate affects consumer debt instruments such as mortgages, credit cards, and auto loans. The rate cuts are a result of inflation drifting back to the central bank’s 2% target and labour market showing indications of softening. It’s a “recalibrating” policy back to a state where it no longer needs to be restrictive as Fed Chair Jerome Powell has earlier mentioned.
  • UK: The Bank of England (BoE) cut its benchmark interest rates for the second time since 2020, lowering them by 25 bps to 4.75%. However, the central bank indicated that the future reductions would be gradual (investors believe it could be slower than the European Central Bank) due to the new government’s first budget which is likely to have an upside impact on inflation causing it to take more time than expected to reach the central bank target of 2%.
  • Japan: The Bank of Japan (BoJ) retained the short-term interest rates steady at 0.25% as widely expected. However, the central bank indicated that interest rates may rise given the subsiding risks in the US economy. It projected inflation to hover around its 2% target in coming years.

GDP growth

  • US: The US GDP grew at an annualized pace of 2.8% in the third quarter of the calendar year, the second estimate of the Bureau of Economic Analysis revealed. The final estimate is due on December 19. The growth is said to be driven by strong growth in consumer spending (3.5%), which accounts for ~70% of US economic activity, and a 7.5% surge in exports, which is the most in 2 years.
  • UK: The UK GDP grew 0.1% QoQ as per the preliminary estimate. It is the smallest growth rate in three quarters, indicating a slowdown in the economy. The service sector growth came in at only 0.1%, while the production sector declined by 0.2% due to a 2.7% decline in electricity, gas, steam, and air conditioning supply. The UK economy expanded 1% YoY in Q32024, as per preliminary estimates, above 0.7% in Q22024.

Unemployment

  • US: The unemployment rate remained unchanged at the 3-month low of 4.1% in October compared to the previous month after declining from the 12-month peak of 4.3% in July 2024. The number of unemployed individuals was unchanged at 7 million while permanent job losers rose slightly to 1.8 million.
  • Canada: The unemployment rate in Canada remained unchanged at 6.5% in October compared to the prior month and hovered around the 12-month high of 6.6% recorded in August 2024. The unemployed population increased by 900 people to 1,429,000 while joblessness dipped steeply for the youth (-20,800 to 403,400). The labour force participation rate eased by 0.1 percentage points MoM to 64.8%.
  • China: Unemployment in China declined to a 4-month low of 5% in October (below market estimates of 5.1%) from 5.1% in September. The jobless rate for locally registered residents declined by 0.1 percentage point to 5.1% in the month while the same for non-local registrants and non-local agricultural registrants was 4.8% and 4.7%, respectively.
  • Japan: The unemployment rate rose 0.1 percentage point to 2.5% in October, worsening for the first time in 3 months as more people chose to stay in employment after reaching their retirement age. It is up from September’s 8-month low of 2.4%, meeting market expectations. The number of people who voluntarily left their jobs fell 5.4% to 700,000 while people who reached retirement age increased by 5.4% to 390,000.

Inflation readings

  • US: The inflation rate rose to 2.6% YoY in October 2024 from 2.4% in September due to a rise in shelter and food prices (4.9% and 2.1%, respectively) partially offset by a fall in energy prices (4.9%). The inflation was in line with market expectations. The core inflation was 3.3% YoY, which is the same compared to September. Meanwhile, the U.S. core PCE price index, the Federal Reserve’s key inflation metrics, rose by 2.8% YoY in October 2024, which is the highest in 6 months and in line with market estimates.
  • Eurozone: The inflation rate accelerated to 2% YoY in October from 1.7% in September. The biggest contributor to the inflation rate came from services (+1.77 percentage points), followed by food, alcohol & tobacco (+0.56 pp), and non-energy industrial goods (+0.13 pp).
  • UK: The inflation rate in the UK sharply accelerated beyond the central bank’s target (2%) to 2.3% in October from 1.7% in September and surpassed the consensus estimates of 2.2%. The uptick is attributed to an increase in the regulator-set energy price cap that took effect in October leading to high energy bills and price hikes in the dominant service sector.
  • China: The annual inflation rate declined to a 4-month low of 0.3% after peaking at 0.7% in February this year over the last 12 months. This happened as non-food prices continued to decline (-0.3% vs -0.2% in September), largely driven by further declines in the cost of transport (-4.8% vs -4.1%) and housing (-0.1% vs -0.1%).
  • Japan: The inflation rate dipped to 2.3% in October 2024 from 2.5% in the previous month, hitting its lowest level since January. The deceleration is attributed to prices of electricity (up 4.0% vs 15.2% in September), gas (3.5% vs 7.7%), furniture and household utensils (4.4% vs. 4.8%), culture (4.3% vs. 4.8%), and communication (-3.5% vs -2.6%) and education (-1.0% vs. -1.0%).

Consumer confidence

  • US: The consumer confidence index continued to improve and reached 111.7 in November compared with 109.6 in October. The monthly rise is driven by optimism about the labour market, particularly with respect to future job availability, which reached its highest level in nearly 3 years. However, consumers’ expectations about future business conditions were unchanged and they were slightly less optimistic about future income.
  • Japan: The consumer confidence index rose to 36.4 in November from October’s 5-month low of 36.2 and in line with market forecasts. This happened as household sentiment improved for income growth (40.2 vs 39.4 in September), willingness to buy durable goods (29.9 vs 29.7), and overall livelihood (34.3 vs 34.2).
  • UK: The GfK consumer confidence in the UK rose 3 points to -18 in November 2024, marking its first improvement in 3 months. The improvement is driven by lower interest rates, rising wages, and reduced concerns about tax hikes. The new government budget which unveiled a significant rise in spending, taxes, and borrowing also impacted the reading.
  • Euro: The consumer confidence in the Euro Area dipped 1.2 points to -13.7 in November. It came in below the long-term average and surpassed market expectations of -12.4.

Balance of Trade

  • US: The US trade deficit widened from US$70.8 billion in August (revised) to US$84.4 billion in September, surpassing the consensus estimates of US$84.1 billion. This happened as exports of goods and services fell US$3.2 billion, or 1.2%, and imports of goods and services increased US$10.3 billion, or 3%. The goods deficit increased from US$14.2 billion to US$109 billion while the services surplus rose US$600 million to US$24.6 billion.
  • China: China continued to report a trade surplus, which surged to US$95.3 billion in October 2024 from US$56.1 billion in the same period a year earlier. It’s the largest trade surplus reported since June this year. Exports jumped ~13% YoY as manufacturers began front-loading orders in anticipation of further tariffs from the US and the EU. Imports slipped 2.3% YoY due to weak domestic demand.
  • UK: The UK’s trade deficit widened to £3.46 billion in September from an upwardly revised £2.02 billion in August due to higher declines in exports than imports. Exports fell 5.8% MoM to a 28-month low of £68.20 billion while imports declined 3.7% MoM to a six-month low of £71.67 billion.


Disclaimer:

The details mentioned above are for information purposes only. The information provided is the basis of our understanding of the applicable laws and is not legal, tax, financial advice, or opinion and the same subject to change from time to time without intimation to the reader. The reader should independently seek advice from their lawyers/tax advisors in this regard. All liability with respect to actions taken or not taken based on the contents of this site are hereby expressly disclaimed.
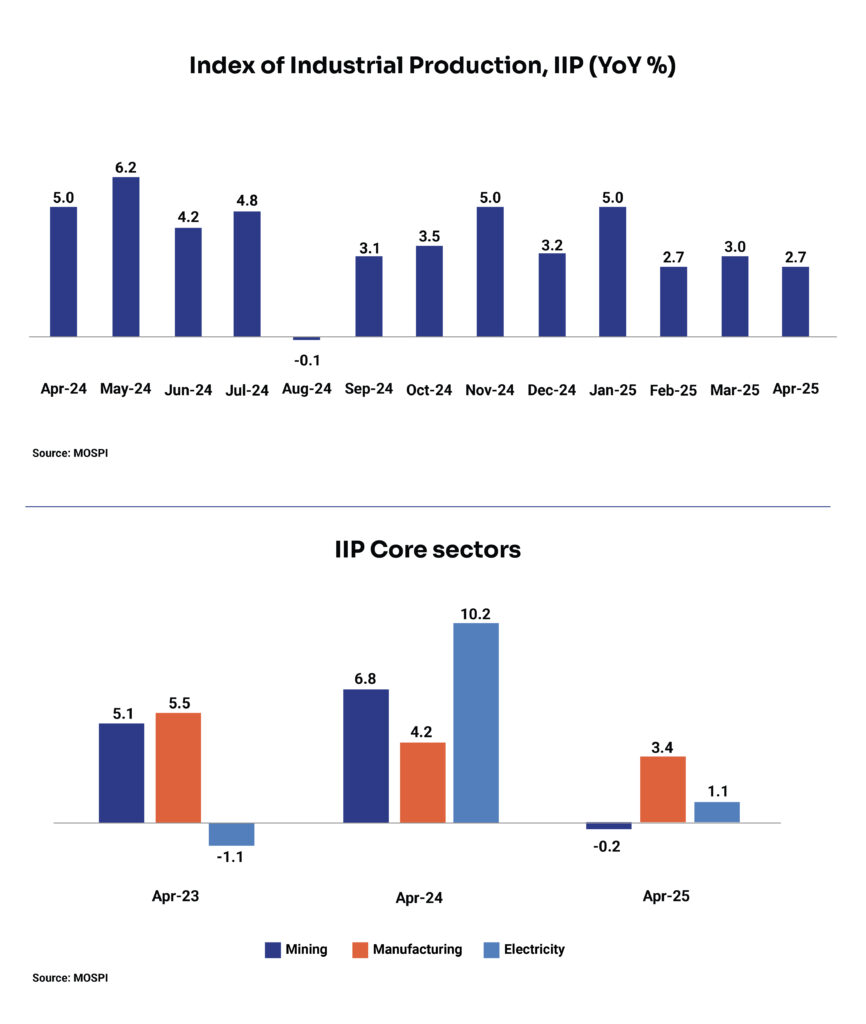
Co-living Spaces: The Emerging Real Estate Model

The Co-living space is a communal accommodation setup where residents share common areas while maintaining private bedrooms. The concept isn’t new, but the modern Co-living model gained prominence in the second decade of the 21st century and soon emerged as an investment opportunity in India.

In developed countries like the US and UK, the model appealed to young professionals and students as they preferred organized shared spaces over traditional rental accommodations owing to the affordability and convenience of shared space as well as to enjoy modern amenities.

In India, the market for Co-living space started developing both from the demand and supply side due to a rapidly evolving urban landscape, demographic trends, and changing preferences for accommodation. The model turned out to be a sustainable solution to the ever-growing urban space scarcity while meeting the demand for quality accommodation by the millennial population.

Growth Drivers

Flexible, convenience, affordability, and social exchange: The Co-living model provides flexibility, convenience, affordability, and community-driven housing solutions to residents due to factors such as:

  • No fixed lease tenure
  • Flexible terms of entry and exit
  • Curated meal plans
  • Shared cost for utility, Wi-Fi, and modern amenities
  • Common areas for social interaction

Urban migration: Over the last decade, India’s urban population recorded an annual growth rate of ~4%. This happened as people migrated to urban centers from rural areas due to employment opportunities and in pursuit of higher education. In 2023, about a third of India’s population lived in cities. About 1 crore youth join the workforce every year leading to higher demand for affordable living options near the Central Business Districts.

Growth in Millennials/Gen Y: There is constant growth in India’s millennials or the Gen Y population, who are people born between 1981 and 1994 (aged 30 to 43 years), resulting in an increased demand for Co-living spaces. The millennial population in the country stands at 25% of the total population, which is higher than the global average of 23%. Along with the Gen Z population, the median age of the Indian population is 28 years, making it one of the youngest emerging economies.

More than 40% of India’s working population are migratory millennials, who are increasingly attracted to urban hubs such as Gurugram, Bengaluru, Hyderabad and Chennai. This happens as India becomes the world’s third largest start-up hub leading the young workforce to take up employment in new cities or relocate to other cities on job assignments.

Recent reports suggest that millennials in India tend to stay in one city for approximately 6 months to 2 years before moving to new ventures. These millennials have the option to choose an entire accommodation space at a higher cost or shared spaces at affordable rentals. Sensing the demand, Co-living operators are catering high-quality accommodation to them while providing the flexibility to switch between cities without long-term commitments.

Job opportunities in Tier 2/3 cities: Although top metro cities constitute the largest share of the Co-living market, increasing job opportunities in Tier 2 / 3 cities are adding to the next leg of growth in the market. More than 20 such cities are driving the demand for the model, which include Jaipur, Lucknow, Chandigarh, Dehradun, Surat, Vadodara, Bhubaneshwar, Nagpur, Nashik, Coimbatore, Mysore, Vizag, Kochi, Trivandrum, Jamshedpur, Guwahati, Patna, Indore, Ranchi, Bhopal, Thrissur, and Agra.

Rise in real estate prices: The average real estate prices in India surged 23% YoY in India’s top seven cities in the first half of FY25. During the period, Delhi NCR recorded the highest increase in average ticket size (INR 145 crore), followed by Bengaluru (INR 1.21 core), Hyderabad (INR 1.15 crore), Chennai (INR 95 lakh), and Pune (INR 85 lakh). Given the scenario, Co-living presents an affordable and practical alternative to young professionals looking for high-quality and well-maintained accommodation spaces closer to Central Business Districts without any high upfront costs.

Organized vs. Unorganized Shared Living Operators

Unorganized operators: This primarily refers to PGs and private hostels, which fail to meet the needs and aspirations of the millennials. These traditional accommodation options lack modern amenities and offer rigid rental terms. In this model, residents often face the hassle of lump sum deposits and untoward landlord behavior.

Organized operators: Organized players differentiate themselves from unorganized players by the quality of their accommodation, and service offerings, providing value-added features like tech-enabled applications, mobile apps for rent payments, maintenance requests, and social interaction within the community, etc. They typically charge a premium of 20-30% over unorganized players due to superior amenities, safety, and convenience.

In the last few years, the spurt in Co-living spaces has been led by organized players, who are joining hands with landlords/owners or local developers and gaining share from the unorganized market. Further, major Private Equity (PE) deals led by global players like Tiger Global, Goldman Sachs, Sequoia Capital, Warburg Pincus, and others (including local PE and venture debt firms) in the Co-living space supported the growth of Co-living ventures in India.

Organized Operator Models

Lease & Operate: This is the predominant model in India due to its asset-light strategy. The operators lease residential units or an entire block from a landlord/property owner, and sub-lease individual rooms to end-users. Hence, they get rid of huge capex resulting from buyout of the properties. Being an asset-light model, it helps them to scale up fast as the properties are taken up on a fixed-term lease or revenue share basis for a particular period. Examples include Zolo Stays, CoHo, Stanza Living, Oxfordcaps.

Management Contract: In this model, the operator signs long-term agreements with developers /investors/property owners to run their premises as Co-living space. They act as a service provider and get a commission for operating the facility. Residents enter into a lease agreement with the owner, who is responsible for the P&L from the property. Examples include Zolo Stays, NestAway.

Franchise: Here an organized Co-living operator allows the property owner / unorganized PG/hostel operator to use its brand name. The latter runs the Co-living space while accessing the technology platform, staff training, marketing capability, and vendor reach of the organized operator. This model is suitable for operators seeking aggressive expansion while retaining its service standards and quality of infrastructure. On the other hand, it helps property owners generate higher returns without losing ownership. Examples include Zolo Stays, Placio.

Hybrid: This is a mix of Lease & Operate and Management Contracts models. This model helps the Co-living operator adopt a multi-pronged business strategy in a relatively new market to expand aggressively. Examples include Zolo Stays, CoHo.

Return Economics

Co-living space in India caught the eyes of global investors over the last 10 years. The materialization of several PE deals (as mentioned above) is a testament to that, and more and more institutional investors are showing active interest in the space. Attractive return economics is the key factor behind the emergence of this alternative real estate model.

From the operator’s perspective, the profitability of the Co-living operation depends on the type of operator model discussed earlier. An asset-light model like Lease & Operate is prevalent while others prefer a revenue-sharing arrangement or fixed rental arrangement.

The operating profit margin for an operator generally ranges between 10 to 20%, which depends on factors such as scale of operations, type of operating model, bargaining power of occupants, operator’s negotiation power with vendors for food/broadband, etc. (JLL-FICCI, 2019) It also depends on the ability of the operator to charge a premium from tenants/landlords by fixing the inefficiencies of an unorganized shared rental market.

From a landlord’s perspective, Co-living offers an attractive return of 2 to 4x of traditional residential asset classes (Colliers, 2021) when rental yields in the traditional housing market have stagnated at ~3%. This primarily happens as the cost of shared spaces such as kitchens and living areas are amortized over a larger number of beds resulting in a return efficiency on a per bed basis. Factors that influence landlord’s yields include the type of operator model, product positioning, type of value-added services, etc.

Conclusion

The Co-living space in India offers a huge investment opportunity given the untapped potential in the market. While Tier-1 cities like Delhi NCR, Mumbai, Bengaluru, Hyderabad, Chennai, and others will spearhead the growth, developments in Tier 1/3 cities will further support the growth. As per Cushman & Wakefield, the Co-living market size is expected to more than double from ~US$5 billion (2019) to ~US$11 billion by 2025 in Tier 1 cities (top 8) and from ~US$1.5 billion (2019) to over US$3 billion in Tier 2/3 cities (top 22) by 2025.

Factors such as the rising millennial workforce, urban migration, and the growth of the student population are expected to drive the demand for organized Co-living spaces. From the supply side, attractive return economics compared to traditional rental models would result in an influx of new players in the market creating high-tech and flexible Co-living spaces.


Disclaimer:

The views provided in this article are of the author and do not necessarily reflect the views of Vivriti. This article is intended for general information only and does not constitute any legal or other advice or suggestion. This article does not constitute an offer or an invitation to make an offer for any investment.

The Pulse – A monthly digest of key macroeconomic events (October 2024)


“Change creates opportunities to grow, but it also creates opportunities to slip.”— Philip Fisher


Executive Summary

After the larger-than-expected rate cut of 50 basis points (bps) by the US Fed, markets braced for election impact as the yields corrected significantly throughout October ahead of the event risk and a stronger set of macro data prints. The US 10-year treasury moved up by ~75 bps from September lows as markets increasingly scaled down rate cut expectations from the Fed going forward. Elsewhere, ECB reduced rates for the third time in October with markets expectation of another cut this calendar year.

On the domestic front, RBI maintained the status quo on policy rates accompanied by a change in stance to neutral. The RBI Governor reiterated the focus on the 4% inflation target on a durable basis. Geo-political risks, particularly, tensions in the Middle East, need to be closely watched in case the fallout leads to any significant surge in crude prices.

Domestic Updates

India’s retail inflation rises closer to the upper RBI band, wholesale inflation accelerates

The retail inflation, measured as a change in the Consumer Price Index (CPI), rose to a 9-month high of 5.49% YoY in September from 3.65% in August but remained within the RBI’s target range of 2-6%. The increase is attributable to a spike in food inflation to a 3-month high at 9.24% in September from 5.66% in August. Due to persistent unfavourable weather conditions, vegetable inflation rose to a 14-month high at 36% YoY in September from 10.71% in August.

Inflation based on the wholesale price index (WPI) moved slightly upwards to 1.84% YoY in September from 1.31% in August, after two consecutive months of decline. WPI is divided into three groups — Primary Articles (22.6% of total weight); Fuel and Power (13.2%); and Manufactured Products (64.2%). The acceleration in wholesale inflation was mainly caused by the rise in inflation for primary articles from 2.42% in August to 6.59% in September due to a sharp rise in the prices of food articles.

Meanwhile, retail inflation for farm and rural workers rose to 6.36% YoY and 6.39% in September 2024, respectively, from 5.96% YoY and 6.08% in the previous month.

Mining and electricity drag India’s industrial output

India’s industrial output, as measured by the Index of Industrial Production (IIP), declined 0.1% YoY in August against a growth of 4.8% in July due to contraction in two out of three major components of IIP – mining, manufacturing, and electricity. Mining and electricity output declined 4.2% and 3.7% YoY, respectively while manufacturing output grew only 1% during the month.

RBI maintains status quo in the repo rate but changes its policy stance

The Reserve Bank of India (RBI) keeps the benchmark repo rate (the rate at which RBI lends money to commercial banks in exchange for securities) unchanged at 6.5% for the 10th consecutive time in its 4th bi-monthly Monetary Policy Committee (MPC) meeting for FY25. The central bank committee mentioned that it is prudent to maintain greater flexibility and optionality, given the present circumstances. Other key rates such as Standing Deposit Facility (SDF), Marginal Standing Facility (MSF), and Bank Rate have been kept unchanged at 6.25%, 6.75%, and 6.75%, respectively. The significant diversion in the current MPC was the change in policy stance unanimously from ‘withdrawal of accommodation’ to ‘Neutral’, which means that the central bank can either raise or reduce benchmark rates based on how the key economic indicators like inflation and GDP are panning out.

Net FDI to India doubles

Net foreign direct investment (FDI) in India more than doubled to US$6.62 billion in April–August 2024 from US$3.26 billion in April–August 2023, as per RBI. Gross inward FDI rose ~32% YoY to US$36.1 billion in April–August 2024. About two-thirds of the gross FDI inflows went to manufacturing, financial services, communication services, electricity, and other energy sectors. Nearly 75% of the inflow came from Singapore, Mauritius, the UAE, the Netherlands, and the US.

India’s trade deficit abates

India’s merchandise trade deficit narrowed to US$20.8 billion in September, which is the lowest in the last 5 months, from US$29.7 billion in August and US$23.5 billion in July. In September, merchandise exports slightly dropped to US$34.58 billion from US$34.71 billion in August, while imports fell drastically to US$55.36 billion from US$64.36 billion in August.

China is India’s largest source of imports

According to the Commerce Ministry, China became the largest source of imports during April-September 2024 with inbound shipments rising 11.5% to US$56.3 billion. It is followed by Russia, the UAE, the US, Iraq, Saudi Arabia, Indonesia, Korea, Switzerland and Singapore. On the other hand, the US became the top export destination for India in the same period with outbound shipments increasing 5.6% to US$40.4 billion.

Unemployment rate dips to 4-month low

The unemployment rate in India dipped to a 4-month low at 7.8% in September from 8.5% in August, according to the survey by the Centre for Monitoring Indian Economy (CMIE). However, there were fewer people actively looking for jobs as depicted in the fall in labour participation rate from 41.6% to 41% in September 2024.

India’s personal income tax collections growth surpasses corporates

India’s personal income tax collections grew at a pace that is double the pace of corporate tax collections over the past decade, according to data revealed by the Central Board of Direct Taxes. The personal income tax collection surged 294.3% to INR 10.45 lakh crore between FY15 to FY24 while the corporate tax collections jumped 112.9% to INR 9.11 lakh crore in the same period. The total number of taxpayers increased from 5.7 crore in FY15 to 10.4 crore in FY24 while the number of tax returns more than doubled from 4 crore in FY15 to 8.6 crore in 2024. With this, the tax-to-GDP ratio increased from 5.6% in FY15 to 6.6% in FY25. Maharashtra, Karnataka, Delhi, Tamil Nadu, and Gujarat contributed over 72% of net direct tax collections.

Passenger vehicle sales recover after 2 months of decline

Total passenger vehicle sales in India increased ~1.1% YoY to 356,752 units in September from 352,921 units in August, as per data from the Society of Indian Automobile Manufacturers (SIAM). According to data from the Federation of Automobile Dealers Association (FADA), which shows actual retail sales from showrooms, versus the SIAM, which puts out dispatches to dealers from auto factories, passenger vehicle sales fell 9.3% YoY in September. Two-wheelers and commercial vehicle sales declined 8.5% and 10.5% YoY, respectively while sales of tractors grew 14.7% YoY.

World Bank upgrades India’s growth forecast

The World Bank upped its real GDP growth forecast for India from 6.6% (projected in April 2024) to 7% for the fiscal year 2025 ending March 2025. As per the international financial institution, recovery in agricultural output and strong private consumption led by employment growth are expected to auger well for the domestic economy. The revised forecast is in line with the IMF, which has retained India’s growth forecast at 7% for FY25.

Global Update Roundups

Monetary policies

  • ECB: The European Central Bank cut its deposit rate for the third time in 2024 by 25 bps to 3.25% in an effort to boost economic growth amid softening labour market and moderation in inflation. The European Union has been struggling with poor consumer spending and weak economic indicators, and the subdued growth resulted in lower inflation, which came in at 1.7% in September, its lowest level in 3 years. More cuts are likely; however, the ECB did not provide any direction for its next move.
  • People’s Bank of China: The People’s Bank of China has cut its benchmark lending rates by 25 bps in an expected move to boost the economy. The 1-year loan prime rate (LPR), which affects corporate loans and most household loans, has been cut to 3.1%, while the 5-year LPR, which serves as a benchmark for mortgage rate, has been reduced to 3.6%.

GDP growth

  • Global growth: The International Monetary Fund (IMF) in its October World Economic Outlook has kept the global growth unchanged at 3.2% in 2024 and 2025 stating that the “global economy remained unusually resilient throughout the disinflationary process”. The UN agency expects global headline inflation to decline from an annual average of 6.7% in 2023 to 5.8% in 2024 and 4.3% in 2025. It foresees advanced economies to return to their inflation targets earlier than emerging market and developing economies.
  • China: China witnessed a slowdown in the economy as GDP growth declined from 4.7% in the second quarter of 2024 to 4.6% in the third quarter reflecting the need for additional stimulus. The Chinese government already announced interest rate cuts and policy measures to support the property and equity market. Chinese lawmakers are now expected to approve additional budget or debt sales to fund public spending as part of the promised fiscal support.

Unemployment

  • US: The unemployment rate eased to 4.1% in September, the lowest in three months, from 4.2% in August, exceeding market expectations of an unchanged rate. This happened as the number of unemployed individuals declined by 281,000 to 6.8 million, while employment levels rose by 430,000 to 161.8 million. The labour force participation rate was steady at 62.7% in the month.
  • Canada: The labour market recovered as the unemployment rate declined to 6.5% in September, after consecutive increases since January 2024, from the 34-month high of 6.6% in August, defying the consensus estimates of 6.7%. The number of unemployed decreased by 30,800 from the prior month to ~1.43 million due to a decline in unemployment for the youth.
  • China: Unemployment in China declined to a 3-month low of 5.1% in September (below market estimates of 5.3%) from 5.3% in August. The jobless rate for locally registered residents declined to 5.2% in the month.
  • Japan: Japan’s unemployment rate declined to the lowest level since January at 2.4% in September from 2.5% in August. It came down from July’s 11-month peak of 2.7% and less than market forecasts of 2.5%.

Inflation readings

US: The inflation rate in the US decelerated for a sixth consecutive month to 2.4% YoY in September from 2.5% in August but came in above the Dow Jones estimate. It’s the lowest inflation recorded since February 2021 and supports the US Fed’s confidence of inflation coming back towards the 2% goal. Core inflation increased 10 bps MoM to 3.3% in September. A fall in energy prices (-6.8% in September vs -4% in August) is one of the primary factors behind the fall in inflation.

  • Eurozone: The annual inflation rate in the Eurozone declined to 1.8% in September, the lowest since April 2021, compared to 2.2% in August, but came in below the consensus estimates of 1.9%. However, it is below the 2% target set by the European Central Bank. This happened as energy prices fell (-6% vs -3%) and inflation for services decelerated (4% vs 4.1%).
  • UK: The annual inflation rate declined to 1.7% in September, which is the lowest point since April 2021 and compared to 2.2% in each of the previous two months. Transport costs (-2.2% vs 1.3%) is the largest contributing factor to the fall in inflation rate due to lower prices of airfares and motor fuels.
  • China: The annual inflation softened to 0.4% in September from 0.6% in August, indicating a slowdown in the economy. It missed the consensus estimates of 0.6%.
  • Japan: The annual inflation declined to the lowest level since April at 2.5% in September from 3% in August. The deceleration in prices of electricity and gas and moderation in prices of food, furniture/household utensils, transport, and culture contributed to the fall in inflation.

Consumer confidence

  • US: The consumer confidence index improved to 108.7 in October from a revised 99.2 reading in September. It is the biggest jump in confidence since March 2021. This happened as people expressed optimism about the job market. Many noticed a fall in grocery prices though overall inflation remained a concern.
  • Japan: The consumer confidence index declined to 36.2 in October from 36.9 in August, which was the 5-month high. This happened as households’ sentiment in the country weakened for income growth, employment, willingness to buy durable goods, and overall livelihood.
  • UK: Consumer Confidence indicator hit the lowest level in the year at -21 in October compared to -20 in September. Concerns on potential tax increases in the Budget weighed on household and business sentiments.
  • Euro: Consumer confidence in the Euro Area increased by 40 bps to -12.5 in October from -12.9 points in September. The improvement was led by consumers’ enhanced outlook on their household financial situation.

Balance of Trade

  • US: The trade deficit surged 15% to two-and-half-year high of US$108.2 billion in September from US$94.2 billion in the prior month. US imports rose ~4% to US$282.4 billion in the month ahead of the holiday shopping season while exports fell 2% to US$174.2 billion.
  • China: China continued to report a trade surplus, but it narrowed to US$81.7 billion in September from US$91.02 billion in the same period a year earlier. This is attributed to a fall in manufacturing activity with new export orders declining to their worst in 7 months.
  • Japan: Japan’s trade deficit narrowed to JPY 294.34 billion in September from JPY 695.3 billion in September 2023. The reported figure was much higher than the market forecast of a deficit of JPY 237.6 billion. Exports declined unexpectedly by 1.7% to JPY 9,038.20 billion, the first dip since November 2023, while imports rose 2.1% to JPY 9,332.55 billion.

Disclaimer: 

The details mentioned above are for information purposes only. The information provided is the basis of our understanding of the applicable laws and is not legal, tax, financial advice, or opinion and the same subject to change from time to time without intimation to the reader. The reader should independently seek advice from their lawyers/tax advisors in this regard. All liability with respect to actions taken or not taken based on the contents of this site are hereby expressly disclaimed. 
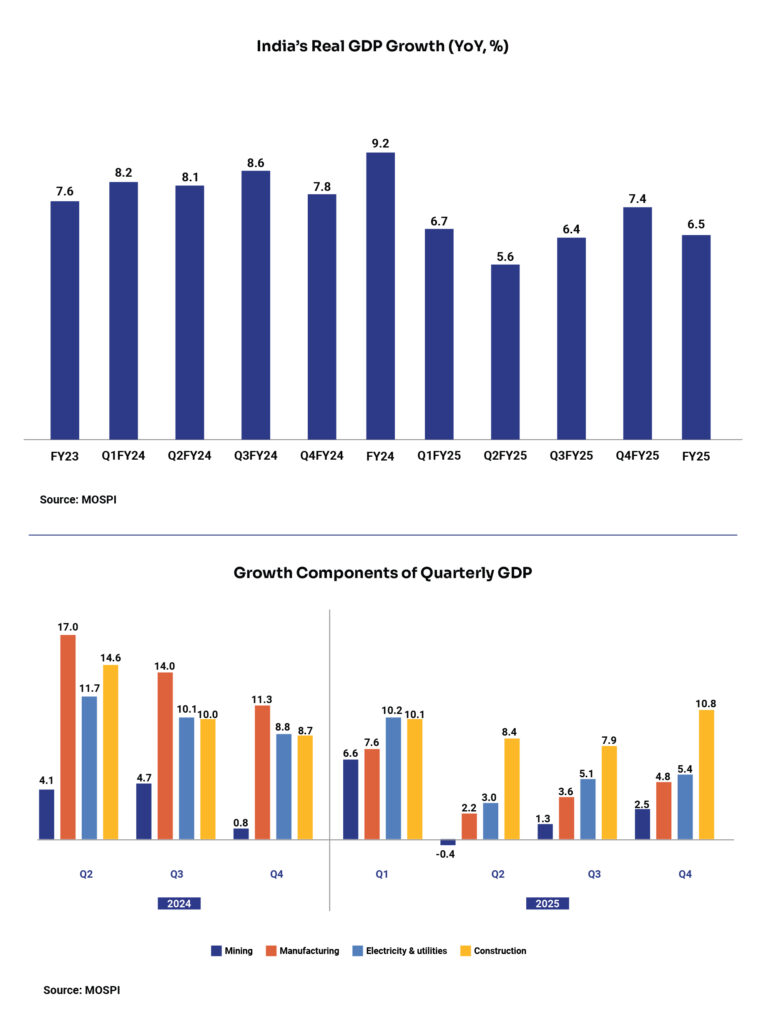
Private Credit Market in India – A Deeper Look

India’s private credit investments is headed for its first US$10-billion year in 2024 as domestic funds gain traction driven by local expertise, and new AIF registrations and robust fundraising continued to grow – EY, H12024 Report


Private credit provides an alternative source of financing for businesses with unique funding needs and irregular cash flows, cases which banks may avoid due to higher risk and regulatory restrictions. Private credit lending mostly takes place via asset managers involving a private credit/alternative investment (AIF) fund that intermediates between the ultimate lender and borrower. Such loans are generally senior secured, variable rate, and may comprise multiple credit facilities.

The Private Credit market has been growing at a fast pace across the world, and India is no exception. Globally, the market started gaining pace after the financial crisis in 2008 as banks retreated from riskier lending to small and mid-sized businesses and to companies backed by Private Equity. It witnessed a 5x growth in assets under management (AUM) over the last 10 years to over US$2 trillion in 2023.

In India, the rapid growth in the economy led to a growth spurt in mid-sized businesses that are increasingly seeking tailored financial solutions that private credit can only provide with flexible structures. As per Preqin, the provider of alternative assets data, tools, and insights, the AUM of India-focused private debt skyrocketed over 25x from US$0.7 billion in 2010 to US$17.8 billion in 2023. With this, it surpassed the growth witnessed by other asset classes in India such as Venture Capital (8x), Private Equity (2.1x), Real Estate (1.6x), and Infrastructure (1.8x) over the same period. This also made India the APAC leader in the Private Credit market.

With respect to the market share in the private credit space, there has been a trend reversal in the last few years. Domestic private credit funds started stealing the pie from global counterparts due to several factors such as the local expertise of asset managers and other factors as outlined below helping them to achieve market depth and diversification.

The nature of private credit investments

In the first half of 2024, India’s private credit market gained significant momentum as private credit investments surged to an all-time high for any six-month period. Investments totaled US$6 billion which are deployed across 96 deals. Like before, real estate dominated the space, in terms of value, followed by infrastructure, and other sectors.

However, the average deal volume in India shrank in H1CY24 compared to 2023, which could be somewhat attributed to the growth in mid-market enterprises. The average deal volume in the period stood at ~US$25 million compared to ~US$161 million across the rest of Asia (Preqin). As depicted in the chart below, private credit deals in the range of US$10 million to US$40 million accounted for more than 50% of all private credit transactions in H1CY24.

Catalysts for growth in India’s Private Credit market

  • Infrastructure spending: Private credit gets an impetus from the government’s push for large infrastructure projects. The Centre has doubled the spending on infrastructure projects over the past three years with the objective of boosting the economy. In the Union Budget, a record INR 11.11 lakh crore has been earmarked for such projects in the financial year ending March 2025 (FY25), which in terms of GDP, stands at 3.4%. As large corporations win more and more infrastructure projects, ancillary work is being awarded to more and more small and mid-sized companies boosting the demand for private credit.
  • Flexible financing solutions: The private credit players are able to provide flexible financing solutions to fast-growing mid-sized companies, including favorable loan structures and repayment schedules, compared to traditional bank loans, while catering to borrowers’ specific needs.
  • Regulatory climate: The enactment of the Insolvency and Bankruptcy Code (IBC), 2016, acted as a catalyst for the growth of the private credit market in India. It became a statutory instrument to effectively safeguard funds’ interest in debt investments in companies that are moved to IBC proceedings and boosted investors’ confidence. This is because IBS helped in expedite insolvency resolutions and maximize returns for creditors.
  • Role of digital infrastructure: India’s digital infrastructure (with the likes of the Account Aggregator framework) has been playing a key role in developing the private credit market by streamlining the underwriting process. It made easier for private credit lenders to access goods and services tax (GST) records, credit histories, and other relevant information.
  • Tax reforms: Private credit funds, mainly Debt AIFs, got the much-awaited level-playing field in the taxation of debt investment products as the Finance Act 2023 brought tax parity across all debt products. It leveled the playing field for debt asset managers of various pooled investment vehicles by standardizing taxation.
  • Shift in investors’ preference: Higher disposable income and better access to financial information have enabled the young Indian population to make prudent investment decisions, increasingly moving them away from traditional investment avenues to private credit funds/AIFs.

Conclusion

Several Private Credit exits in H1CY24 depicted a vibrant market with significant returns and evolving strategies. Going forward, confidence in the asset class is expected to grow with more and more high-net-worth individuals (HNIs) and family offices backing domestic funds and with a faster pace of growth in the economy.


Disclaimer:

The views provided in this blog are of the author and do not necessarily reflect the views of Vivriti. This article is intended for general information only and does not constitute any legal or other advice or suggestion. This article does not constitute an offer or an invitation to make an offer for any investment.  

Asset Securitization in India: Facts and Facets

“Securitization market volume in India jumped 31% YoY to INR 60,000 crore in Q2 (July-Sep 2024) FY25 taking the total volume to INR 1.04 lakh crore in H1FY25.” – ICRA


Asset Securitization is a process where debt products like home loans, auto loans, microfinance loans, and credit card debt are pooled and repackaged as interest-bearing securities. It basically works on the assumption that the probability of several assets defaulting is lower than the probability of defaulting for a single asset.

A securitization transaction involves shifting the assets from the balance sheet of the originator to the balance sheet of an intermediary which could either be a Special Purpose Vehicle, SPV (a legal entity typically set as a trust to undertake a specific business purpose or activity) for non-stressed/standard assets, or an asset reconstruction company for stressed assets.

In the Indian market, the pooled assets are sold to the investors either in the form of pass-through certificates (PTCs), which are like bonds, for standard assets, or security receipts (SRs) for stressed assets. PTCs or SRs represent claims on incoming cash flows (like the principal repayments and interest) from such pooled assets.

PTCs vs DAs

Apart from PTCs, banks and financial institutions in India are allowed to enter Direct Assignment (DA) transactions to sell their loan books at a fixed interest rate to other banks or financial institutions. Such transactions do not involve an SPV or the issuance of PTCs.

Over the last few years, the proportion of DAs compared to PTCs in retail loan securitizations has been reducing and continues to do so due to the expected fall in gold loan and mortgage securitizations as well as the rise in co-lending deals. PTCs are expected to gain a higher proportion due to the increasing share of asset classes like vehicle loans, microfinance, business loans, and personal loans in the securitization volume.

Originator Group – A Trend reversal

It has been noted that the significant rise in securitization volume in Q2FY25 is driven by private-sector banks. The banks resorted to securitization as selling down loan portfolios will help them improve their credit-to-deposit (CD) ratio, which indicates how much the banks lent for every rupee received in deposits.

This is a key trend reversal in the securitization market in terms of the nature of originators. Earlier, the originators in the securitization market were mainly small finance banks but private sector banks have started entering the segment lately as originators due to concerns raised by the Reserve Bank of India on the alarming rise in CD ratio, which is an important health indicator of a bank.

In March 2024, the CD ratio stood at 78.1% (80.3% considering the impact of the merger of HDFC with HDFC Bank), which was the highest since 2005. A very high CD ratio means that bank lending is very high compared to its deposits signaling higher risk and pressure on liquidity. It could lead to difficulty in meeting obligations for the banks.

In Q2 FY25, roughly 35% of securitized assets were originated by private sector banks (in ICRA-rated transactions). In fact, bank-originated securitization volumes surged over 50% to INR 10,000 crore in FY24 from INR 6,600 crore in FY23. NBFCs also continue to take the securitization route to diversify their liabilities and improve the asset-liability mismatch.

Distribution of Securitization Volume by Asset Classes

Repackaging of vehicle loan receivables continues to be the dominating asset class in India’s securitization market due to their highest share in the PTC market. This is happening due to the large number of originators in vehicle financing, which are predominantly NBCFs, and due to the preferred average tenure of the product. For instance, home loans or loans against property (LAP) have a lower share in the PTC market compared to vehicle loans due to their longer tenure and interest risks. ICRA noted that the share of personal loans remains healthy in the PTC market because investors enjoy higher yields on these products as well as due to the fact that banks are increasingly repackaging them to maintain the planned mix of unsecured loans in the overall portfolio.

Conclusion

The annual securitization volume in India took a hit due to the COVID-19 pandemic and it is yet to recover to pre-Covid levels. The market is still at an early stage as evident from the size of the Indian PTC market, which accounts for less than 1% of issuances in the global securitization market and is even lower than in countries like Australia, Canada, and Latin America. In 2022, the size of PTC issuances in India constituted a meagre 0.04% of the GDP, however, in the US, it is nearly 10% (CareEdge).

Nevertheless, there is strong momentum in the market due to several factors. ICRA projected the securitization market volume to cross INR 2 lakh crore in FY25. The increasing participation of private sector banks as originators is expected to boost the volume and instill confidence in the market. Further, due to the increase in risk weighting by RBI for bank loans to NBFCs by 25 percentage points (Nov 2023), NBFCs are expected to resort to securitization to diversify their resource mix.

These apart, the Indian retail securitization pools have performed well through the past decade steering through several crises, which will continue to support the securitization market. For instance, securitization pools backed by vehicle loans rated by CRISIL showed stable performance and witnessed a median collection efficiency in the range of 97% to 101% in Q1FY25, while for mortgage-backed transactions, the median collection efficiency ranged from 98% to 100% in the same period.


Disclaimer:

The views provided in this blog are of the author and do not necessarily reflect the views of Vivriti. This article is intended for general information only and does not constitute any legal or other advice or suggestion. This article does not constitute an offer or an invitation to make an offer for any investment.  

Interim Finance under IBC: Opportunities and Challenges

The Insolvency and Bankruptcy Code (IBC) of 2016 was introduced to resolve financial stress in companies while maintaining them as going concerns. One key tool to achieve continuity of going concern is interim finance. IBC allows stressed entities to raise necessary funds during the insolvency resolution process to keep the debtor operational and to fund crucial expenses like employee wages and daily operations. This note explores the regulatory framework, market trends, opportunities, and challenges related to interim financing.

Legal and Regulatory Framework

Under Section 5(15) of the IBC, interim finance refers to financial debt raised during the insolvency resolution process. Sections 20 and 25 empower the resolution professional to raise interim finance, with the approval of the Committee of Creditors (CoC), once formed. However, restrictions apply, such as limits on creating security interests over the debtor’s encumbered assets.

Security for Raising Interim Finance

Before the CoC is formed, interim finance may be raised by the interim resolution professional, but only against unencumbered assets of the debtor. Once the CoC is formed, security interests over any assets require the CoC’s approval.

Priority of Repayment

Interim finance enjoys a “super-priority” status under Section 53 of IBC, meaning it must be repaid before other debts in the event of liquidation. Despite this, lenders remain cautious, as interim finance repayments are limited to certain periods, such as before liquidation or completion of the moratorium.

Challenges

Opportunities in the interim finance market are good as it is high yield/high-risk debt and there are currently a limited number of players. However, challenges remain, such as:

  1. Non-judicious Raising of Interim Finance: Interim finance should only be used for essential expenses, and improper use can be contested by creditors.
  2. Lack of Unencumbered Assets: Stressed companies often lack unencumbered assets to secure interim finance.
  3. Uncertainty in Stressed Entities: Low cash flow and liquidation risks make it a risky investment.
  4. CoC Approval Delays: The CoC may hesitate to approve interim finance, leading to delays that can jeopardize the resolution process, and by the time approvals and documentation are done the damage to the debtor may be irreversible.

Conclusion

Interim finance is emerging as a high-yield, credit avenue. Super priority status and CoC-blessed borrowing keep much better protected. However, lenders/investors should be aware of potential risks like delays in insolvency resolution and security quality deterioration. The right moment to invest is typically after CoC formation and resolution plan approval, when there is some clarity about the quality of the resolution application and the prospect of resolution.


The article has also been published in BW Legalworld.com https://bwlegalworld.com/article/interim-finance-under-ibc-opportunities-and-challenges-535523

Disclaimer:

The views provided in this blog are of the author and do not necessarily reflect the views of Vivriti. This article is intended for general information only and does not constitute any legal or other advice or suggestion. This article does not constitute an offer or an invitation to make an offer for any investment.

The Pulse – A monthly digest of key macroeconomic events (September 2024)

“There have been three great inventions since the beginning of time: fire, the wheel, and central banking.” – Will Rogers


Executive Summary

The much anticipated and telegraphed US Fed rate cut finally took place in September. However, the Fed surprised most economists by delivering a larger 50 basis points (bps) cut than the median forecast of 25 bps, calling it an “appropriate recalibration” of the monetary policy stance. The post-meeting press conference saw Chair Powell emphasizing that the upside risk to inflation has diminished, while the downside risk to employment has increased. While noting that economic growth is still robust, Powell outlined the support to the labour market as the basis for a larger upfront cut. The Fed dot plot indicated another 50-bps cut this year and another 100-bps next year, however, the markets have priced in much higher cuts by the first half of 2025. Elsewhere, the European Central Bank reduced rates while England and Japanese central banks kept it on hold. China saw significant stimulus, in a boost to risk assets, with a sharp rally in currency and local equity markets. Geo-political tensions, particularly in Middle East is the key risk to watch out for, as any sharp upshoot in commodity prices will have a negative effect on inflation prints.

On the domestic front, RBI’s Monetary Policy Committee (MPC) begins this week, where we expect status quo on rates. We believe RBI will lag the Fed both in terms of timing and magnitude, as it is expected to be a shallow rate cut cycle, with domestic data prints supporting the stance. On the data front, CPI remained below 4% for another month (base effect in play with reversal expected in the next quarter). India’s current account deficit in Q1FY25 widened to 1.1%, led by a widening of merchandise trade deficit, while the capital account surplus moderated to US$14.4bn, on account of a slowdown in foreign portfolio inflows. Overall, the balance of payments (BoP) surplus eased to US$5.2bn vs US$30.8bn in the previous quarter. On government finance, the fiscal deficit for April-August 2024 was 27% of the budgeted deficit with a weaker pace of capital expenditure, thereby increasing the chances of a lower than budgeted fiscal deficit, as receipts hold up.

Domestic Updates

India’s retail inflation still within RBI band, wholesale inflation eases further

The retail inflation in India, which is measured as a change in the Consumer Price Index (CPI) moves slightly upwards to 3.65% YoY in August from 3.54% YoY in July and 6.83% in August 2023. It’s the second time in nearly 5 years that retail inflation came in below the RBI’s medium-term target of 4%. The food inflation, which accounts for nearly half of the overall basket, rose to 5.66% in August from 5.42% in July 2024. Vegetable inflation increased to 10.71% in August from 6.83% in July due to uneven rainfall that impacted crop yields.

Inflation based on the wholesale price index (WPI) eased further to 1.31% YoY in August 2024 from 2.04% YoY in July due to deceleration in food inflation and deflation in fuel prices. Food inflation came down to 3.26% from 3.55% in July while fuel and power recorded a deflation of 0.67% compared with a 1.72% rise in July.

Meanwhile, retail inflation for farm and rural workers softened to 5.96% YoY and 6.08% in August 2024, respectively, from 6.17% YoY and 6.20% in the previous month.

India’s industrial output growth turns around

The growth in India’s industrial output, as measured by the Index of Industrial Production (IIP), improved to 4.8% in July from 4.2% in June as manufacturing activity as well as investments started gaining traction post-elections. The growth in the manufacturing sector (the largest in the IIP basket) accelerated to 4.6% YoY in July 2024 from a 7-month low of 3.2% in June 2024. However, the acceleration is somewhat offset by deceleration in mining (3.7%) and electricity (7.9%), which are 5-month and 4-month lows, respectively.

World Bank, ADB projects India’s FY25 GDP growth at 7%

World Bank has revised India’s real GDP growth forecast for FY25 from 6.6% to 7% despite subdued global growth. Due to strong revenue growth and continued fiscal consolidation, the international financial institution projected India’s debt-to-GDP ratio to decline from 83.9% in FY24 to 82% by FY27. However, it noted that India needs to diversify its export basket and leverage global value chains to reach the goal of US$1 trillion in merchandise exports by 2030.

On the other hand, the Asian Development Bank maintained India’s GDP growth at 7% for FY25 and 7.2% for FY26. ADB Country Director for India Mio Oka said, “India’s economy has shown remarkable resilience in the face of global geopolitical challenges and is poised for steady growth. Agricultural improvements will enhance rural spending, which will complement the effects of robust performance of the industry and services sectors.” Owing to fiscal consolidation, it expects India’s government debt to decline from 58.2% of GDP in FY24 to 56.8% in FY25. The general government deficit, which includes state governments, is expected to reduce below 8% of GDP in FY25.

SEBI launches FPI-dedicated cell

The Securities and Exchange Board of India (SEBI) established a dedicated foreign portfolio investor (FPI) outreach cell to assist FPIs looking to enter in the Indian markets. The cell will facilitate a bridge between FPIs and the Indian securities market by providing them guidance and support throughout their engagement, from pre-application to post-registration. As per SEBI, about INR 3.4 lakh crore of foreign portfolio investor inflows were recorded during FY24, of which, INR 2.08 lakh crore were invested in equities and INR 1.2 lakh crore in the debt market. This underlined the importance of creating a framework for foreign investors.

Loan growth of rated finance companies expects to moderate

S&P Global Ratings stated that loan growth of rated finance companies in India may decline from 20% in FY24 to 18% in FY25 due to the cumulative impact of RBI actions. The rating agency commented that “recent actions by RBI will curtail lenders’ over-exuberance, enhance compliance, and safeguard customers”.

Loan growth to MSME improves in current fiscal – RBI

As per a recent RBI report, loans to micro and small enterprises grew 13.3% YoY and medium enterprises rose 17.2% so far in the current fiscal year. This is higher than the growth registered for both the segments in FY24 due to several factors including renewed focus on MSME, deepening of the Account Aggregator framework, etc. The launch of the RBI’s end-to-end digital platform, Unified Lending Interface (ULI), which is expected to revolutionise access to credit, is expected to provide further impetus to growth. In FY24, the loan growth of micro-small and medium enterprises was recorded at 10.2% and 9.7%, respectively, compared with 28.3% and 36.8% in FY23.

FDI in equity jumps nearly 50% in 1Q FY25

Foreign direct investments (FDI) equity inflows in India rose steeply by 47.8% to US$16.2 billion in April-June 2024 driven by services, computer, telecom, and pharma. The major countries contributing to equity inflows include Mauritius, Singapore, the US, the Netherlands, the UAE, the Cayman Islands, and Cyprus. Total FDI, including equity inflows, reinvested earnings, and other capital, rose 28% to US$22.5 billion in the same period. The growth in FDI is expected to accelerate further due to the potential impact of the US Federal Reserve interest rate cut and favourable economic conditions in India.

India’s trade deficit expands further

India’s merchandise trade deficit expanded further to US$29.7 billion in August 2024, which is the highest in 10 months, from US$23.5 billion in July 2024 and US$21 billion in June 2024. Rising shipping costs and slowdown in China are adversely affecting India’s exports, which declined 9.3% YoY to US$34.7 billion in August. Imports rose 3.3% YoY to US$64.4 billion, which is the highest since October 2023.

Unemployment rate worsens 

The unemployment rate in India worsened to 8.5% in August from 7.9% in July, according to the survey by the Centre for Monitoring Indian Economy (CMIE). However, the month witnessed a large portion of working-age population actively looking for jobs as depicted by the sharp rise in labour participation rate. As per CMIE, the unemployment rate rose as some left the job market due to a lack of opportunities. 

Sales of passenger vehicles skid for the second month 

Total passenger vehicle sales in India slid 1.8% YoY to 352,921 units in August, after falling 1.9% in July, as per data from the Society of Indian Automobile Manufacturers (SIAM) revealed. The fall can be attributed to customers postponing their purchases for the festive season. According to data from the Federation of Automobile Dealers Association (FADA), which shows actual retail sales from showrooms, versus the SIAM, which puts out dispatches to dealers from auto factories, passenger vehicle sales fell 4.5% YoY in August.  Sales of 2-wheelers recorded a 6.3% rise while sales of tractors and commercial vehicles declined 11% and 6% YoY, respectively, during the month. 

Global Update Roundups 

Monetary policies  

  • The US Federal Reserve, in a historic move, cut its benchmark interest rate by 50 bps the first time since 2020. The federal funds rate now stands at 4.75%-5%, down from the 22-year high target range of 5.25%-5.5%. The rate cut followed a spate of 11 rate hikes since March 2022 (including four in 2023) to combat inflation. The policymakers indicated more rate cuts are likely by the end of this year. As per the median of new economic projections published at the end of the policy meeting, interest rates could be lowered to a range of 4.25%-4.5% by 2024-end as inflation nears the 2% goal and unemployment spikes. This implies that an additional 50 bps cut might take place this year. 
  • The Bank of Canada trimmed its benchmark interest rate by 25 bps to 4.25% for the 3rd consecutive time in its September meeting, after keeping the rate at a two-decade high of 5% for a year until June this year. The cut was executed with the intent to boost the economy and consider continued easing in inflationary pressures. In August, consumer inflation in Canada softened to 2% (the lowest level since February 2021) from a 40-month low of 2.5% in July, thereby reaching the central bank’s target. 

GDP growth 

  • US: The growth in real GDP came in at an annualized rate of 3% in Q2 (Apr-Jun) of calendar year 2024 (CY24), up from the sluggish growth of 1.6% (revised) in Q1CY24. The growth is driven by resilience in consumer spending (which accounts for about 70% of domestic economic activity) and business investment. Consumer spending grew 2.9% at an annual rate while business investment rose 7.5%, led by a 10.8% increase in investment in equipment. 
  • Japan: The economy grew at an annualized rate of 3.1% in Q2CY24, which is higher than the average estimate of a 2.3% rise and degrowth of 2.3% in the first quarter of the year. The recovery in growth is attributed to higher consumption of automobiles and other durable goods. 

Unemployment  

  • US: The unemployment rate eased to 4.1% in September, the lowest in three months, from 4.2% in August, exceeding market expectations of an unchanged rate. This happened as the number of unemployed individuals declined by 281,000 to 6.8 million, while employment levels rose by 430,000 to 161.8 million. The labour force participation rate was steady at 62.7% in the month. 
  • UK: The unemployment rate declined to 4.1% from May to July 2024 from 4.2% for three months till June, meeting market expectations. The unemployment rate is the lowest for three months ending January this year as the number of unemployed individuals decreased by 74,000 to 1.44 million. On the other hand, the number of employed individuals rose by 265,000, the highest increase in over a year and a half, reaching 33.2 million, led by a rise in full-time employment. 
  • Canada: The labour market continues to soften as the unemployment rate rose further to 6.6% in August from the 30-month high of 6.4% in July and exceeded market expectations of 6.5%. The number of unemployed increased by 60,400 from the prior month to ~1.5 million due to a rise in unemployment for the core working age (to 5.7%) and the older population (to 5.5%). 

Inflation readings 

  • US: Consumer price inflation decelerated for a 5th consecutive month to 2.5% in July, the lowest reading since February 2021, from 2.9% in July. The reading is below the consensus estimate of 2.6%. This happened as energy costs fell (-4% vs 1.1% in July) and the inflation for food (2.1% vs 2.2%) and transportation (7.9% vs 8.8%) softened during the month. 
  • Eurozone: The annual inflation rate in the Eurozone declined to 1.8% in September, the lowest since April 2021, compared to 2.2% in August, but came in below the consensus estimates of 1.9%. However, it is below the 2% target set by the European Central Bank. This happened as energy prices fell (-6% vs -3%) and inflation for services decelerated (4% vs 4.1%). 
  • UK: The annual inflation rate remained unchanged at 2.2% in August compared to July after remaining steady at 2% for consecutive two months earlier, which is also the central bank target. It came in line with the consensus estimates. The upward pressure on inflation mostly came from air fares, recreation and culture, and transport. On the other hand, the downward pressure mostly came from motor fuels, and restaurants and hotels. 
  • China: The annual inflation rate rose to 0.6% YoY in August from 0.5% in July, coming below the market forecasts of 0.7%. Food prices increased for the first time since June 2023 (2.8% vs flat reading in July) due to fresh vegetables while non-food prices rose 0.2% YoY. 
  • Japan: The annual inflation rate rose to 3% in August after remaining steady at 2.8% for the third straight month in July and touched its highest level since October 2023. It’s driven by elevated prices of electricity that increased the most since March 1981 (26.2% vs 22.3% in July), and gas (11.1% vs 7.4%), food (3.6% vs 2.9%), housing (0.7% vs 0.6%), furniture & household utensils (5.2% vs 3.7%), clothes (2.3% vs 2.2%), and culture (4.8% vs 4.4%). 

 Consumer confidence 

  • US: The University of Michigan consumer sentiment rose to a 5-month high of 70.1 in September from 67.9 in August and exceeded market expectations of 69.3. This happened as the economic conditions gauge was revised higher to 63.3 and inflation expectations for the year declined to 2.7%. 
  • Japan: The consumer confidence index rose to 36.9 in September from 36.7 in August but came in below market forecasts of 37.1. Households’ sentiment in the country improved for income growth, employment, and willingness to buy durable goods. 
  • UK: Consumer Confidence indicator declined to a 6-month low of -20 in September 2024 from -13 in consecutive two months. This deterioration can be attributed to uncertainties before the next month’s autumn Budget.  

Balance of Trade  

  • US: The trade deficit widened to ~US$79 billion in July compared to US$73 billion in June and was in line with the consensus estimates. It’s the biggest deficit since June 2022 as imports rose 2.1% to US$345.4 billion, the highest value since March 2022, driven by purchases of computer accessories, non-monetary gold, etc., while exports increased 0.5% to a record high of US$266.6 billion, led by semiconductors, government goods, and financial services. 
  • China: The trade surplus jumped to US$91 billion in August from US$67.8 billion in the same month the prior year. Exports grew nearly 9% (fastest pace since March 2023) to a 23-month high of US$308.65 billion while imports rose 0.5%, down sharply from 7.2% in July. 


Disclaimer: 

The details mentioned above are for information purposes only. The information provided is the basis of our understanding of the applicable laws and is not legal, tax, financial advice, or opinion and the same subject to change from time to time without intimation to the reader. The reader should independently seek advice from their lawyers/tax advisors in this regard. All liability with respect to actions taken or not taken based on the contents of this site are hereby expressly disclaimed. 
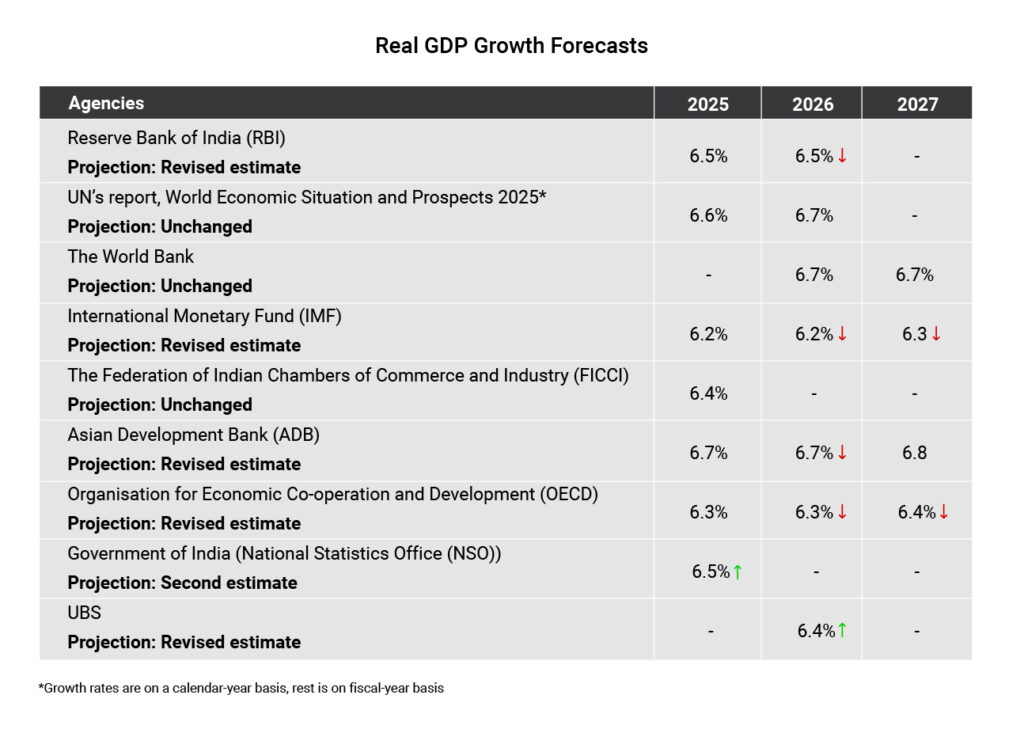
Decoding Account Aggregator framework

“Lending firms using the Account Aggregator (AA) framework facilitated loans worth INR 42,300 crore during the period of September 2021 to March 2024.” – Sahamati


What is the Account Aggregator framework?

Account aggregation or financial data aggregation is a technique used in the financial services industry involving the collection, gathering, and synthesis of information in one place from multiple financial accounts, such as loan accounts, savings and current accounts, credit cards, investment accounts like mutual funds and demat accounts, public provident fund, income tax returns, as well as supplementary business or consumer accounts in e-commerce, food or cab aggregators. The data collection, assembling, and sharing are enabled via open application programming interface (API) connections.

The inception of the Account Aggregator framework in India dates back to 2016 when the Reserve Bank of India held joint consultations at the Financial Stability and Development Council (FSDC) with representation from RBI, SEBI, IRDAI, and PFRDA and released the Master Guidelines for the framework. That’s how a new class of NBFCs known as Account Aggregators (AA) was conceptualized. In 2021, the AA ecosystem saw the light of day with eight large private sector banks joining it.

Who are the stakeholder entities?

The stakeholders in the AA ecosystem are as follows:

  • Financial Information Providers (FIPs): FIPs are regulated financial entities such as banks, NBFCs, insurance, and asset management companies, depositories, etc., who store citizens’ data by the virtue of holding their accounts and share the data with citizens’ consent. For example, when you secure a loan, your bank can act as the FIP by sharing your data with the lending bank or NBFC. As of August 2024, the number of FIPs stands at 163.
  • Financial Information Users (FIUs): FIUs are regulated financial entities like banks NBFCs, and others who use citizens’ available data with FIPs to provide them services. They solicit consent from a user by providing details of the data to be captured through an AA identifier.   Since the launch of the AA framework in 2021, SEBI-regulated entities have been the early adopters. In FY24, the number of SEBI-registered FIUs recorded an exponential rise while the usage from SEBI FIUs saw growth as reflected in the number of consents taken.
  • Account aggregators (AAs): AAs are NBFCs licensed by RBI to enable the sharing of structured financial data from FIPs to FIUs while retaining a record of the consent provided. In other words, they operate as consent managers for citizens. As of now, there are 15 licensed AAs in India.

How does the AA framework operate?

The AA framework empowers citizens by enabling them to share data only with their explicit consent captured in an electronic consent framework. The data can be shared in a digital format on a real-time basis, directly from the existing FIPs of the citizens to the potential FIUs of the citizens.

What are the benefits?

  • AAs help financial institutions access tamper-proof and machine-readable data. It enables reliable, convenient, and secure data-sharing driving down the transaction costs for the lenders.
  • AAs can improve the quantum and the quality of the loan portfolio of the lenders through efficiency gains.
  • AAs are poised to serve ‘thin file’ customers, expanding the total addressable market for lenders and strengthening financial inclusion. It can help financial institutions serve underserved customers and MSMEs better.

Way ahead

Currently, a customer needs to sign up with multiple Account Aggregators to complete transactions. This increases operational efforts for institutions as they need to access customer data from various sources by integrating with each data provider. To significantly reduce this operational burden, AAs plans to introduce interoperability, eliminating the need for individuals to open accounts with multiple aggregators, which in turn, will allow banks, NBFCs, and other financial institutions to exchange customer data seamlessly.

Sahamati, an industry body within the Account Aggregator ecosystem, is running a pilot program to test interoperability. If interoperability kicks in, customers’ financial data can be accessed across different financial institutions even if those institutions are linked to different aggregators, once a customer has given consent through any AA.


Disclaimer:

The views provided in this blog are of the author and do not necessarily reflect the views of Vivriti. This article is intended for general information only and does not constitute any legal or other advice or suggestion. This article does not constitute an offer or an invitation to make an offer for any investment.  

US Federal Reserve announced its first rate cut since 2020 – A deeper look

The US Federal Reserve, in a historic move, cut its benchmark interest rate by 50 basis points (bps) for the first time since 2020. The federal funds rate now stands at 4.75%-5%, down from the 22-year high target range of 5.25%-5.5%. The rate cut followed a spate of 11 rate hikes since March 2022 (including four in 2023) to combat inflation.

The Federal Open Market Committee (FOMC) voted 11-to-1 in favour of the rate cut that occurred shortly before November’s presidential election. “We concluded that this was the right thing for the economy and the people we serve.” said the Federal Reserve Chair Jerome H. Powell.

The policymakers indicated more rate cuts are likely by the end of this year. As per the median of new economic projections published at the end of the policy meeting, interest rates could be lowered to a range of 4.25%-4.5% by 2024-end as inflation nears the 2% goal and unemployment spikes. This implies that an additional 50 bps cut might take place this year. Powell indicated they could speed up if the economy is weak and slow down if it’s strong.

The US market doesn’t seem to be spooked by the significant cut as modest movements were noticed in S&P 500 and tech-heavy Nasdaq. This is because investors have priced in the historic move with reassurance from the Fed that it wasn’t an emergency cut.

Inflation

The US Fed pulled off the daunting task of battling the pandemic-led inflation pretty well. In August, consumer price inflation reached its 3-year low at 2.5% (a tad higher than the pre-pandemic level), marking the 5th straight annual fall and the smallest hike since February 2021.

There are several triggers for the softer inflation. Gasoline prices in the US averaged $3.20/gallon, down $0.50 since April. Analysts believe the national average could further go below $3 in the near term. On the other hand, major retail chains like Walmart and Target announced price cuts on thousands of items to an extent that has put the business of discount stores in the US under pressure.

Along the cut comes big relief to credit card holders and home buyers in the US. Credit card debt has risen to the highest level since the 2008 financial crisis (so the credit card delinquencies) to US$1.14 trillion in the second quarter of 2024, according to data available from the Federal Reserve Bank of New York. Notably, it is the highest balance since the New York Fed began tracking the data in 1999 and up from US$1.12 trillion in the first quarter of 2024. Credit card rates averaged over 20% with store-branded cards witnessing a record-high average annual rate of 30.45%, as per data released by Bankrate.

The national average of mortgage rates stands at ~6.3% for a 30-year fixed loan. Mortgage rates, which are closely tied to 10-year Treasury bond yields that are coming down with inflation, will also ease with the benchmark rates going down.

Soft landing

Soft landing in an economy refers to a scenario when inflation is tamed without setting off a significant decline in economic activity. However, rising unemployment in the US remains a bigger concern and puts the soft landing in jeopardy. The unemployment rate has risen over the last one year and steeply since the beginning of 2024. Economists believe that whenever unemployment begins to rise, it tends to gain momentum and keep rising.

Impact on Indian market

Foreign investment: Foreign investment in India is likely to increase following the rate cut. When interest rates in the US rise, investors tend to flock to the US market to earn higher returns from Treasury bonds. A cut in the interest rate lowers the yields on US securities prompting investors to seek higher returns elsewhere with a healthy economic outlook. As a result, investment in Indian equity and debt markets could rise, pushing up the prices of securities.

Currency: As mentioned above, lower interest rates could lead to foreign investors chasing the Indian equity and debt markets. This would lead to higher demand for INR for investment purposes, potentially leading to an appreciation of the domestic currency. However, a stronger rupee has mixed impacts – it can lower the import cost and make business tough for Indian exporters on the other hand by making the Indian goods and services expensive for foreign buyers.

Bond Market: A cut in the US interest rates typically leads to a rally in the domestic bond market for reasons mentioned in the first point. In India, the bond market already priced in the rate cut with 10-year G-sec yields already dropping below 6.8%. Post the rate cut announcement, 10-year G-sec yields, in fact, opened above 6.8% on September 19 and became 6.867 at the time of writing after touching the day’s high of 6.893.

Conclusion

The US Federal Reserve joined other central banks across the world like the European Central Bank (ECB), Bank of Canada, and Bank of England in trimming benchmark interest rates. Other major central banks around the world are also expected to follow suit as the US Fed cut is one of the significant global monetary actions.

However, the Reserve Bank of India (RBI) is not compelled to follow suit as already indicated by the governor Shaktikanta Das. The inflation trajectory in India remains within RBI’s target of 4% (with a leeway of 2 percentage points on either side). India still remains the world’s fastest major economy. In the last policy meeting, RBI kept the GDP growth projection unchanged for FY25 (at 7.2%) as well as for Q2FY25, Q3FY25, and Q4FY25.

Further, RBI stressed that maintaining financial stability remains a top priority for the central bank. Hence, any decision to cut rates will be preceded by a full assessment of domestic economic conditions and potential risks.


Disclaimer:

The views provided in this blog are of the author and do not necessarily reflect the views of Vivriti. This article is intended for general information only and does not constitute any legal or other advice or suggestion. This article does not constitute an offer or an invitation to make an offer for any investment.  

The Pulse – A monthly digest of key macroeconomic events (July 2024)

“It is a curious fact that although all booms are alike, all are different.” — Edwin Lefevre

Domestic Updates

India’s retail inflation moves further away from RBI’s median target

  • The retail inflation in India accelerated for the first time in 5 months to 5.08% YoY in June from the 12-month low of 4.75% in May due to a rise in food prices, which account for nearly 50% of the CPI basket. Food inflation rose to 9.55% in June from 8.69% in May and 4.55% in June 2023. However, the headline inflation remained within the RBI’s tolerance band of 2 to 6% but moved further away from the median target of 4% which is critical for a rate cut decision this year. Rural inflation rose to 5.67% 5.34% in May while urban inflation softened to 4.39% from 4.21% in May.

Wholesale inflation continues to accelerate

  • The wholesale inflation jumped to a 16-month high of 3.36% YoY in June from 2.61% in May led by a rise in prices of food articles, manufacture of food products, crude petroleum & natural gas, mineral oils, and other manufacturing. Inflation in food articles rose to 8.68% from 7.4% in May while inflation in manufactured products increased to 1.43% from 0.78% in May.

India’s industrial output growth jumps to 7-month high 

  • The growth in India’s industrial output, as measured by the Index of Industrial Production (IIP), increased to a 7-month high of 5.9% in May from 5% in April. Compared to April, growth in mining decelerated to 6.6% from 6.8%, manufacturing accelerated to 4.6% from 3.9%, and electricity accelerated to 13.7% from 10.2%.

Union Budget: A fine balance between growth, employment, capital investment, & fiscal consolidation

  • The Centre retained the capital expenditures target at INR 11.11 lakh crore for FY25, which is the same as the Interim Budget presented in February this year. This reflected a 2x rise in spending on infrastructure over the past three years to generate demand and create more jobs across the economy. As a percentage of GDP, long-term capex rose from 1.7% in FY20 to 3.4% in FY25. The fiscal deficit target has been cut to 4.9% of GDP in FY25 from 5.1% of GDP in the Interim Budget. Consequently, the estimate for gross borrowing has been reduced to INR 14.01 lakh crore from INR 14.13 lakh crore in the Interim Budget while the net borrowing estimate stands at INR 11.63 lakh crore for the year. The Centre kept the target for nominal GDP (measured at current prices) growth unchanged at 10.5% in the Union Budget compared with the Interim Budget. On the other hand, the real GDP growth target has been pegged at 6.5-7% for FY25, as per the Economic Survey 2023-24, presented before the Union Budget.

India’s poverty ratio declines significantly

  • The National Council of Applied Economic Research (NCAER), one of the nation’s oldest economic policy research think tank, indicated in a research paper that the poverty ratio in India declined significantly to 8.5% in 2022-24 from 21.2% in 2011-12. The paper revealed that the poverty ratio in rural areas fell more compared to the same in urban areas. In rural areas it fell from 24.8% in 2011-12 to 8.6% now and in urban areas it decreased from 13.4% to 8.4% in the same period.

India’s trade deficit swells as imports are up more 

  • India’s trade deficit widened to US$20.98 billion in June from US$19.19 billion in the same month last year, as per the Commerce Ministry. This happened as imports increased 5% YoY to US$56.18 billion due to the rise in inbound shipments of crude oil, pulses, and electronic goods. Merchandise exports rose by 2.6% y-o-y to US$35.2 billion. The Commerce Ministry is focusing on 6 major sectors (engineering, textiles and apparel, electronics, pharmaceutical, chemicals and plastics, and agriculture) and 20 countries to boost exports.

Growth in passenger vehicle sales accelerate

  • Passenger vehicle sales stood at 294,133 in June 2024, reflecting a 5% growth that is higher than 4.3% a month ago. As per the Society of Indian Automobile Manufacturers (SIAM), the sector is expected to perform well in the near term due to favourable monsoon and the festive season.

How India’s FY25 Growth Projections looks 

  • The International Monetary Fund (IMF) revised India’s GDP growth forecast for FY25 upwards by 20 basis points to 7% due to a perceived rise in private consumption, mainly in rural areas. However, the UN-based agency expects the growth to decelerate to 6.5% in FY26.

Global Updates

Roundups

 Monetary policies 

  • The Bank of Canada cut its target for the overnight rate by 25 basis points (bps) to 4.5% and kept the Bank Rate at 4.75% and the deposit rate at 4.5%. The central bank expects inflation to ease gradually despite being still above the central bank targets in advanced economies. In Canada, the bank noticed an increase in excess supply in the economy due to population growth and faster growth in output. However, household spending has been weaker. Also, the labour market is slackening as unemployment rose to 6.4%. The central bank projected a GDP growth of 1.2% in 2024, 2.1% in 2025, and 2.4% in 2026. Consumer price inflation softened to 2.7% in June and the bank noticed broad inflationary pressures to be easing.
  • The People’s Bank of China unexpectedly cut its one-year policy loan rate, known as the medium-term lending facility (MLF), by 20 bps to 2.3%. The magnitude of the cut is the highest since the initiation of the first wave of COVID-19 (April 2020) which is no doubt to support the sluggish economy of China. It followed the reduction of the 7-day reserve repo rate by 10 bps.

GDP growth

  • The UK economy grew 0.4% on a MoM basis in May beating forecasts of a 0.2% rise and after stalling in April. The service sector increased 0.3% and was the biggest contributor to growth. Industrial output rose 0.2%, rebounding from a 0.9% drop in April. Housing construction grew at the fastest pace in nearly a year.
  • China’s GDP grew 4.7% YoY in the second quarter of CY2024, missing expectations of a 5.1% growth. It indicated a slowdown as the GDP grew 5.3% YoY in the first quarter of the year. The sluggish growth is attributed to a persistent property downturn, weak domestic demand, falling yuan, and trade frictions with the West.
  • The US economy showed improvements as the GDP expanded at an annualized rate of 2.8% in April-June 2024 versus 1.4% in the previous quarter. It came in above the consensus estimates of a growth of 2%. The growth is led by personal spending, except for housing due to high interest rates. Personal consumption expenditure, which accounts for ~70% of GDP, grew 2.3%, up 0.8 percentage points from the prior quarter.

Unemployment data 

  • The unemployment rate in the US increased to the highest level since November 2021 at 4.1% in June compared with 4% in May. Nonfarm payrolls rose by 206,000 in June compared to 218,000 in May (revised lower). Taking the moderation in inflation into account, the data could push the US Fed to consider rate cuts later this year.
  • The unemployment rate in the UK remained unchanged at 4.4% in May compared to the previous month and met market estimates. It is the highest reading since September 2021 as the number of unemployed individuals rose by 88,000 to 1.53 million, driven by those unemployed for up to 6 months.

Inflation readings

  • US: Consumer price inflation softened for the 3rd straight month to 3% YoY in June, marking the lowest reading since June 2023. It came in below the market estimates of 3.1%. The downward trajectory in inflation is attributed to a slowdown in housing prices. Other factors contributing to inflation include groceries, used cars, and gas which have either remained steady or declined. Shelter prices rose 0.2%, which is the smallest rise since August 2021.

Eurozone: Consumer price inflation eased to 2.5% YoY in June compared to 2.6% in May. The core inflation, which excludes volatile food and energy prices, was stable at 2.9% in June. Energy prices cooled off from a rise of 0.3% in May to 0.2% in June. Food inflation dipped to a 3-year low of 1.6% in June versus 1.9% in the prior month. Countries with lowest inflation include Finland (0.5%), Italy (0.9%), and Lithuania (1.0%) and the ones with the highest inflation are Belgium (5.4%), Romania (5.3%), Spain and Hungary (both 3.6%).

China: Annual inflation rate went down to 0.2% in June from 0.3% in the prior two months. It came in below consensus estimates of 0.4%. Factors that contributed to weaker inflation include food prices (-2.1% YoY), which recorded a steeper than expected fall, and non-food prices (0.8% YoY) like vehicles, household appliances, etc.

UK: Annual inflation remained steady at the central bank target of 2% in June, holding at 2021-lows, but came in above the consensus of 1.9%. A decline in clothing and footwear prices along with a sharp drop in food and drink inflation maintained the inflation at a lower level.

Japan: The annual inflation remained steady at 2.8% for the second straight month in June 2024. However, it remained at its highest level since February. The elevated level of inflation is attributed to electricity (13.4% vs 14.7% in May), gas (2.4% vs -2.5%), food (3.6% vs 4.1%), housing (0.6% vs 0.6%), transport (2.5% vs 2.3%), furniture & household utensils (3.7% vs 2.9%), clothes (2.2% vs 2.2%), healthcare (1.4% vs 1.1%), culture (5.6% vs 5.2%), communication (1.3% vs 0.4%), and miscellaneous (1.1% vs 1.2%).

Disclaimer:

The details mentioned above are for information purposes only. The information provided is the basis of our understanding of the applicable laws and is not legal, tax, financial advice, or opinion and the same subject to change from time to time without intimation to the reader. The reader should independently seek advice from their lawyers/tax advisors in this regard. All liability with respect to actions taken or not taken based on the contents of this site are hereby expressly disclaimed.
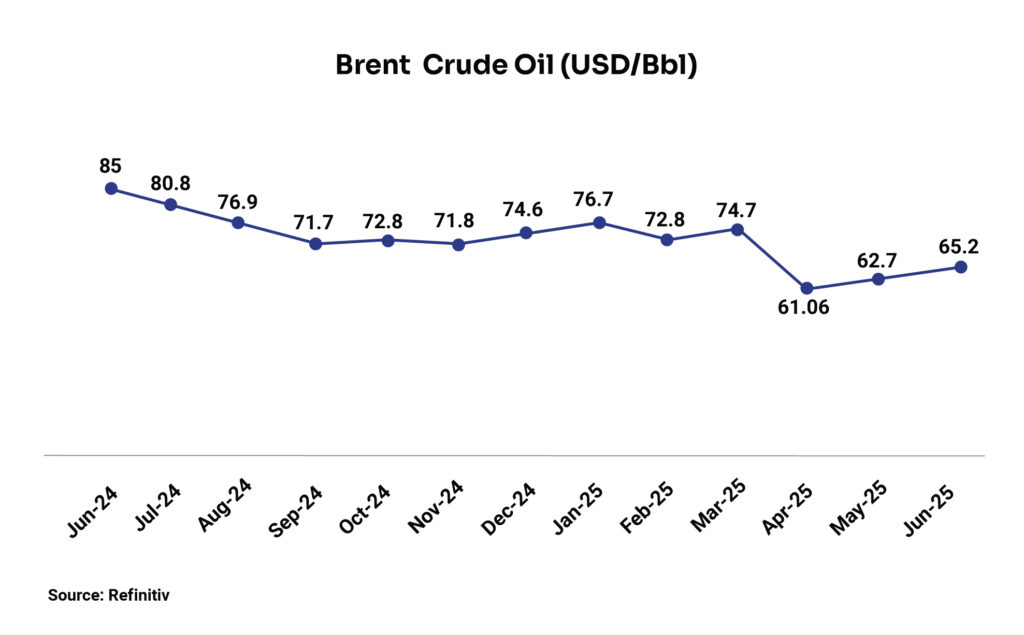
Union Budget FY2024-25: A roundup of key economic indicators

In the Union Budget FY2024-25, the Centre attempts to strike a balance between job growth, rural development, and fiscal prudence. While fiscal discipline is crucial for better sovereign ratings in hopes of a stronger tax collection, a continued capex push is essential to create jobs and to support the economy to become the world’s third largest by 2030. Let us have a look at the Budget announcements to examine the contours of key economic indicators.

GDP growth

The Centre kept the target for nominal GDP (measured at current prices) growth unchanged at 10.5% in the Union Budget compared with the Interim Budget. In absolute terms, the nominal GDP target is pegged at INR 326.4 lakh crore in FY25, a decline from INR 327.7 lakh crore set in the Interim Budget but up from INR 295.4 lakh crore in FY24.

Real GDP growth, which measures annual GDP growth at constant prices (Base year: 2011-12), has been pegged at 6.5-7% for FY25, as per the Economic Survey 2023-24, presented before the Union Budget.

For FY24, India’s GDP growth came in at 8.2% for FY24 with key drivers being private consumption and investment. The growth in the primary sector (agriculture and mining) was recorded at 2.1%, with agriculture at 1.4% and mining at 7.4%. The secondary sector (manufacturing, electricity, construction) grew 9.7%, with manufacturing and construction sectors recording growth of 9.9% and electricity at 7.5%.

For FY25, the recent Economic Survey indicated some of the key factors of the growth. Firstly, improved balance sheets will aid the private sector in catering to a strong investment demand. Secondly, the forecast of normal rainfall by the India Meteorological Department and the satisfactory spread of the southwest monsoon is expected to boost the performance of the agriculture sector thereby supporting the resurgence of rural demand. Thirdly, the maturity of structural reforms such as the Goods and Services Tax (GST) and the Insolvency and Bankruptcy Code (IBC) is expected to bring the envisaged outcomes.

Inflation

The Budget speech evoked confidence on inflation to be tamed down closer to the 4% target. The Centre has managed to tame down the inflation in FY24 through administrative and monetary policy measures despite global uncertainties, supply chain disruptions, and the vagaries of monsoon.

According to the recent Economic Survey, the decline in retail inflation in FY24 is mainly driven by goods and services inflation, which fell to 4-year and 9-year lows (core inflation), respectively. Food inflation continues to be a concern due to inclement weather and crop damage that impacted farm output and prices. It rose from 6.6% in FY23 to 7.5% in FY24, as per the Survey. RBI has projected annual inflation to go down to 4.5% in FY25 and 4.1% in FY26, assuming normal rainfall and the absence of external shocks.

Capital expenditures

The Centre retained the capital outlay of INR 11.11 lakh crore for FY25, which is the same as the Interim Budget presented in February this year. This reflected a 2x rise in spending on infrastructure over the past three years to generate demand and create more jobs across the economy via deployment in core sectors like cement, steel, fertilizers, etc. As a percentage of GDP, long-term capex rose from 1.7% in FY20 to 3.4% in FY25.

Despite the no change in capex, the mix of capex allocation has changed to some extent compared to the Interim Budget. For example, interest-free 50-year capex loans to states witnessed an increase (to INR 1.5 lakh crore from INR 1.3 lakh crore in Interim Budget) while allocations to agriculture, housing, urban development (smart cities & metro projects), education, and National Health Mission in terms of schemes stepped up.

Fiscal consolidation continues

The Centre has cut its fiscal deficit target to 4.9% of GDP in FY25 from 5.1% of GDP in the Interim Budget. Consequently, it has reduced the borrowing estimates to meet its fiscal deficit target by issuing dated securities. The estimate for gross borrowing has been reduced to INR 14.01 lakh crore from INR 14.13 lakh crore in the Interim Budget while the net borrowing estimate stands at INR 11.63 lakh crore for the year. Both gross and net borrowings are lower than FY24 by 9.2% and 1.5%, respectively.

Post the Budget announcement about a reduction in market borrowing, the bond market reacted as yields went down and touched an intra-day low of 6.926% but soon recovered and ended the day flat at 6.969% as the reduction in borrowing was lower than expected.

The reduction in borrowing estimates for FY25 is supported by higher revenue receipts mainly due to additional RBI & PSU dividends. (The Budget set a revenue receipts target of INR 31.3 lakh crore for FY25, an increase of 14.7% from FY24.) The RBI dividend was higher than expected and provided a fiscal space of 0.4% of GDP compared to the Interim Budget. The additional fiscal space has been utilized to hike expenditure by 0.2% of GDP and the rest to reduce fiscal deficit by 0.2% of GDP compared to the Interim Budget. Gross tax-to-GDP ratio is anticipated to rise to 11.8% in FY25 from 11.6% in FY24.

The Centre voiced its commitment to maintain the fiscal deficit each year at a level that would put government borrowing on a declining path as a percentage of GDP. Next year, it aims to lower the fiscal deficit target below 4.5% of GDP.


Disclaimer:

The views provided in this blog are the personal views of the author and do not necessarily reflect the views of Vivriti. This article is intended for general information only and does not constitute any legal or other advice or suggestion. This article does not constitute an offer or an invitation to make an offer for any investment.  

The Month That Was – Macroeconomic takeaways from the month of May 2024

Domestic Economic Updates

  • India’s real GDP growth was recorded at 7.8% YoY in the March 2024 quarter, which translated into a growth of 8.2% for FY24 which exceeded the central government’s second advance estimate of 7.6% for the year. The key drivers of growth are private consumption and investment. The growth in the primary sector (agriculture and mining) was recorded at 2.1%, with agriculture at 1.4% and mining at 7.4%. The secondary sector (manufacturing, electricity, construction) grew 9.7%, with manufacturing and construction sectors recording growth of 9.9% and electricity at 7.5%. As per RBI, India’s real GDP growth for FY25 is expected to be 7% with risks evenly balanced.
  • India’s core sector growth slowed to 5.2% in March from 7.1% (upwardly revised) in February. In the entire fiscal year 2023-24, the core sector’s output grew at a 3-year low of 7.5% compared to 7.8% in FY23. This March, fertilizers and petroleum refinery products dragged down the index while steel, electricity, and coal drove up the core sector activity.
  • India’s GST collection became the highest ever in April at INR 2.1 lakh crore, reflecting a YoY increase of 12% from INR 1.87 lakh crore in April 2023 (previous high). The increase was led by a “strong increase in domestic transactions (up 13.4%) and imports (up 8.3%),” the Finance Ministry stated. Among the states, Maharashtra had the top collection (INR 37,671 crore) followed by Karnataka (INR 15,978 crore), Gujarat (INR 13,301 crore), Uttar Pradesh (INR 12,290 crore), and Tamil Nadu (INR 12,210 crore).
  • India’s manufacturing sector started the new fiscal year on a high note as the HSBC India Manufacturing Purchasing Managers’ Index (PMI) came in at 58.8 (revised lower) in April, which is the second highest pace in three and half years driven by buoyant demand. The April print was lower than 59.1 in March, but it was well above the neutral level of 50 and its long-run average of 53.9. Meanwhile, India’s service sector activity remained resilient as the HSBC India Services PMI came in at 60.8 in April compared with 61.2 in March and 60.6 in February.
  • The overall gross capital formation (GCF), which represents the total value of physical assets including fixed assets, inventories, and valuables, in India grew by 6.9% in FY23 to INR 55.3 lakh crore at constant prices. The moderate growth is attributable to a decline in investments in manufacturing, construction, and mining sectors mainly due to a fall in export demand and low private consumption amidst a high interest rate scenario.
  • Retail inflation based on the consumer price index (CPI) softened to an 11-month low of 4.83% YoY in April from 4.85% in March driven by falling prices in the fuel and light segment and easing pressure in prices of clothing and footwear, pan, tobacco, etc. However, food prices remained elevated at 8.7% in April versus 8.52% in March due to a rise in prices of cereals, meat/fish, and fruit. The inflation print remained above the central bank’s target of 4% but stayed within the tolerance band of 2-6%. Meanwhile, inflation based on wholesale prices accelerated to a 13-month high of 1.26% in April from 0.53% in March driven mainly by food articles as rice, pulses, and vegetables continued to post double-digit inflation.
  • The growth in India’s industrial output, as measured by the Index of Industrial Production (IIP), decelerated to 4.9% YoY in March from 5.6% in February due to a slowdown in output growth in mining and infrastructure/construction goods. For the full year FY24, the IIP growth quickened to 5.8% YoY from 5.2% in the previous year driven by a pickup in manufacturing and construction goods output.
  • India’s merchandise trade deficit stood at a 4-month high of US$19.1 billion in April due to a surge in gold and oil imports and a marginal rise in exports. It rose sharply from the 11-month low of US$15.6 billion in March. Exports during the month were affected by seasonal factors.
  • Passenger vehicle sales in the domestic market grew 1.3% YoY to 3,35,629 units in April, data from the Society of Indian Automobile Manufacturers (SIAM) revealed. Sales in the passenger car segment dipped by 23.4% while that in the two-wheeler segment grew sharply by 31% during the month.
  • Net foreign direct investment (FDI) into India plummeted over 62% in FY24 to US$10.6 billion due to increased repatriation of capital and Indian companies’ investments abroad, revealed RBI data. On a gross basis, FDI stood at US$70.9 billion, of which, US$44.4 billion was repatriated through dividends, share sales, or disinvestment while US$15.96 billion was invested overseas by Indian entities. Over 60% of FDI equity flows went to sectors including manufacturing, electricity, computer services, financial services, and retail and wholesale trade. Most of them came from Singapore, Mauritius, the US, the Netherlands, Japan, and the UAE.

Growth forecasts

  • As per the May Bulletin of the Reserve Bank of India (RBI), India’s GDP growth is likely to be 7.5% in the June 2024 quarter driven by rising aggregate demand and non-food spending in the rural economy. It also noted that retail inflation eased last month to 4.8% from 4.9% in March but indicated an uneven pace of alignment with RBI’s target. The alignment has been sluggish as the prices of vegetables, cereals, pulses, meat, and fish may keep the headline inflation elevated and closer to 5% in the near term. This is likely to delay the rate-cut cycle to kick in. The bulletin mentioned that the alignment with the 4% target may begin in the second half of the fiscal year.

Global Economic Updates

 Central bank policy actions

  • The US Federal Reserve maintained the status quo by keeping the federal funds rate target range at 5.25%-5.50% for the 6th consecutive time in its May meeting, citing “a lack of further progress toward the committee’s 2% inflation objective”. Although the Fed is moving towards eventual reductions in the target range it is concerned about recent inflation prints that have been dissatisfactory.
  • The Reserve Bank of Australia maintained the status quo by keeping the policy rate steady at 4.35% following the view that inflation was going down more slowly than expected. The central bank mentioned that there is still excess demand while labour market conditions are tighter. The Bank of England maintained its key bank rate at a 16-year high (since 2008) of 5.25%, in line with expectations. The decision came on the back of inflation that remains elevated despite coming down. However, the governor indicated a rate cut later this year as inflationary pressures ease further.

Inflation readings 

  • Annual inflation rate in the US softened to 3.4% in April (and 0.3% MoM), in line with expectations, from 3.5% in March, which was the highest level since September. The core inflation, which excludes volatile food and energy prices, was 0.3% on a monthly (smallest since December 2023) and 3.6% on an annual basis (lowest since April 2021). Producer price inflation came in at 0.5% MoM, higher than the consensus of 0.3%, and 2.2% YoY in April. Prices for services rose 0.6% MoM, the most since July 2023.
  • Consumer inflation in China accelerated to 0.3% YoY in April 2024 from 0.1% in March. Food inflation continued to decelerate (-2.7% vs -2.7% in March) while non-food inflation accelerated (0.9% vs 0.7% in March) in April.
  • Other Inflation readings: In the Euro zone, inflation slightly eased to 2.4% in April from 2.6% in the previous month. Core inflation, which strips out food and energy prices, eased to 2.7% in April from 2.9% in March. Services recorded the highest inflation (3.7%) followed by food, alcohol & tobacco (2.8%), and non-energy industrial goods (0.9%). Among the member states, Belgium recorded the highest inflation followed by Croatia, Austria, and Spain. In Canada, retail inflation softened to 2.7% in April from 2.9% in March. The inflation rate is the lowest since March 2021. In the UK, inflation cooled off to 2.3% from 3.2% in March and is approaching closer to the central bank target marking its lowest level in nearly three years. In Japan, inflation softened to 2.5% in April from 2.7% in March as food prices rose the least in 19 months and prices of furniture & household utensils, healthcare, etc., eased.

Other economic indicators

  • The consumer sentiment in the US, estimated as an index by the University of Michigan, fell from 79.4 in March (the highest level since July 2021) to 77.2 in April, which was lower than the consensus estimates of 77.9. The fall is attributed to consumers’ uncertainty about the future trajectory of the economy due to the impending election. Economic sentiment indicator in the Euro Area unexpectedly dropped 0.6 points to 95.6 in April 2024 (expectation was 96.9) due to a sharp decline in confidence among manufacturers, which reached its lowest level since July 2020 (-10.5 vs -8.9 in March). The sentiment also deteriorated among service providers (6.0 vs 6.4), retailers (-6.8 vs -6.0), and constructors (-6.0 vs -5.6). Consumer confidence in Japan dipped from 39.5 in March (the highest reading since April 2019) to 38.3 in April and came in below the consensus of 39.7. This happened as the households’ sentiments weakened towards factors like the income growth, employment, willingness to buy durable goods, and overall livelihood.
  • The business activity in the US manufacturing sector contracted as reflected in the ISM Manufacturing PMI which fell from 50.3 in March to 49.2 in April, which is below market expectations. This happened as the new orders index declined to 49.1 from 51.4 in March.
  • The U.S. economy added 175,000 jobs in April 2024, which is the slowest pace of additions in 6 months and came in much below the market consensus of an increase of 243,000. With this, the unemployment rate rose from 3.8% to 3.9% in the month. This might give some confidence to the US Fed officials about the inflation restoring to its 2% target over time.
  • The unemployment rate in the Eurozone stood at a record low of 6.5% in March, the same as in every month since November 2023, and came in line with market expectations. The youth unemployment rate (people under 25 years of age seeking employment) declined from 14.4% in February to 14.1% in March. 
  • UK’s unemployment rate deteriorated to 4.3% in the Jan-Mar quarter from 4.2% in the December quarter, in line with market expectations. Meanwhile, the UK economy grew 0.6% quarter over quarter in Jan-Mar 2024, above forecasts of 0.4%, preliminary estimates revealed.
  • Services Purchasing Manager’s Index (PMI) readings: The ISM Services PMI in the US plunged to 49.4 in April from 51.4 in March, which is the lowest reading since December 2022, and missed market expectations of 52. Services PMI in the Eurozone rose to 53.3 in April from 51.5 in March, marking the strongest growth in nearly a year and exceeding the initial estimate of 52.9. The services PMI in Japan was revised lower to 54.3 (from a preliminary estimate of 54.6) in April compared with 54.1 in March. The Services PMI in India declined to 60.8 in April from 61.2 in March but marked the 33rd straight month of expansion in services activity.


 Disclaimer:

The details mentioned above are for information purposes only. The information provided is the basis of our understanding of the applicable laws and is not legal, tax, financial advice, or opinion and the same subject to change from time to time without intimation to the reader. The reader should independently seek advice from their lawyers/tax advisors in this regard. All liability with respect to actions taken or not taken based on the contents of this site are hereby expressly disclaimed.
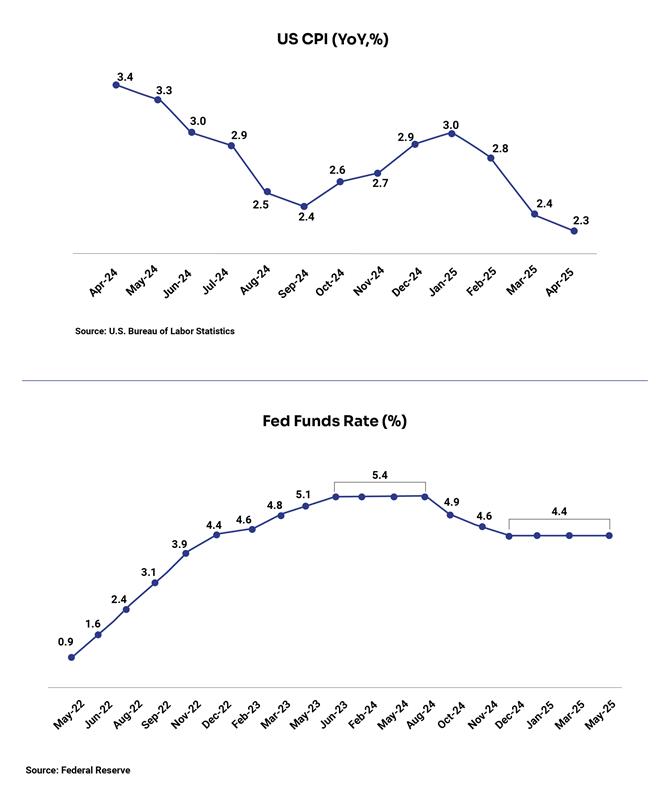
The Month That Was – Macroeconomic takeaways from the month of April 2024

Domestic Economic Updates

  • The Reserve Bank of India in the first Monetary Policy Committee (MPC) meeting of FY2024-25 kept the repo rate unchanged at 6.5%. It was the 7th consecutive time the key policy rate has been kept at the same level. The 6-member committee also maintained the policy stance at ‘withdrawal of accommodation’. FY25 GDP growth forecast has been kept unchanged at 7% while the inflation forecast based on the consumer price index (CPI) has remained unchanged at 4.5% for the fiscal year.
  • The Centre’s GST collection in March became the second highest in FY24 at INR 1.8 lakh crore despite the adverse impact of a weaker integrated GST (IGST) on imports of goods. With this, GST collection for the full fiscal year stood at INR 20.2 lakh crore, depicting a YoY growth of 11.7%. Domestic transactions contributed the most to GST collection in March as gross receipts from such transactions grew by 17.6%.
  • India’s retail inflation based on the Consumer Price Index (CPI) eased to a 10-month low of 4.85% in March from 5.09% in February. The inflation was broadly in line with expectations and remained within the Reserve Bank of India’s (RBI) medium-term tolerance band of 2-6%. The decline in inflation can be attributed to a fall in inflation in categories like food (8.52% in March vs 8.66% in February), fuel and light (-3.24% vs -0.77%), and housing (2.77% vs 2.88%). The wholesale inflation accelerated to a 3-month high of 0.53% in March from 0.2% in February driven by primary articles (food and non-food items like oil seeds, minerals, and crude), fuel and power, and manufactured products. The annual rate of inflation for primary articles rose to 4.51% in March from 4.49% in February; fuel and power increased to -0.77% in March from -1.59% in February; manufactured products rose to -0.85% in March from -1.27% in February.
  • The growth in India’s Index of Industrial production reached a 4-month high of 5.7% in February from 3.8% in January driven by a broad-based rise in mining, manufacturing, and electricity output. Following are the growth in index components:
  • India’s merchandise trade deficit narrowed to US$15.6 billion in March from US$18.71 billion in February, and US$16.02 billion in January. It is the lowest deficit in 11 months. The previous low was US$14.44 billion in April 2023. India’s goods exports slipped 0.7% YoY to US$41.7 billion in March, led by lower oil exports even though non-oil exports remain strong. On the other hand, goods imports declined 6% YoY to US$57.3 billion, due to lower gold imports. Meanwhile, net services exports declined 6.2% YoY to US$12.7 billion
  • India’s net direct tax collections rose ~18% YoY to INR 19.58 lakh crore in FY24. It surpassed the annual budget estimates by INR 1.35 lakh crore and the revised estimates by INR 13,000 crore. This will aid the fiscal deficit target achievement for the fiscal year, which is 5.8% (lowered from 5.9% earlier).
  • India’s net foreign direct investment (FDI) plunged 45.5% YoY in the first 11 months of FY24 (April 2023 to February 2024) to US$14.6 billion. Repatriation/disinvestment by those who made direct investments in India rose ~41% to US$38.3 billion in the period from US$27.2 billion in the same period a year ago.

Growth forecasts

  • The World Bank has revised its FY24 GDP growth projection for the Indian economy from 6.3% to 7.5% due to robust growth in the December 2023 quarter. However, the global agency’s growth projection for FY25 has been moderate as it raised the estimate by 20 basis points to 6.6%. It expects a slowdown in growth between FY24 and FY25 due to a “deceleration in investment from its elevated pace in the previous year”.
  • The Asian Development Bank has revised India’s GDP growth forecast for FY25 to 7% from the earlier projection of 6.7%, stating that the growth will be driven by strong public and private sector investment demand as well as gradual improvement in consumer demand. However, the projection is lower than the 7.6% it had earlier projected for FY23. For FY26, ADB has projected India’s growth at 7.2%.
  • The International Monetary Fund (IMF) revised India’s FY25 GDP growth projection upwards by 30 basis points (bps) to 6.8% due to buoyant domestic demand and rising working-age population. However, the estimate is below the 7% growth estimate for FY25 by RBI. In its January report, the IMF raised India’s GDP growth forecast for FY24 by 110 bps to 7.8%, which is higher than the estimate of 7.6% by the National Statistical Office. For FY26, the IMF expects the growth to slow down slightly to 6.5%.

Global Economic Updates

 Central bank policy actions

  • The European Central Bank (ECB) kept its interest rates unchanged at record-high levels of 4.5% for a 5th consecutive time. The deposit facility rate is kept unchanged at 4%, which is the highest level since the introduction of the single currency in 1999. The refinancing and marginal lending facility rates are fixed at 4.50% and 4.75%, respectively.
  • The People’s Bank of China kept the key rates unchanged —the 1-year loan prime rate (LPR) at 3.45% and the 5-year LPR at 3.95% — following a record reduction of 25 basis points (bps) in February. This happened after the GDP growth in the country came in at 5.3% YoY in the first quarter significantly beating market expectations.
  • The Bank of Japan kept its short-term interest rate unchanged at around 0% to 0.1%, as widely expected. This happened after the central bank announced its first rate hike since 2007 in March. The status quo indicates that inflation is on track to durably hit its target of 2% in coming years.
  • The Central Bank of Indonesia raised the 7-day reverse repurchase rate by 25 bps to 6.25% in a surprise move which is explained by the Governor as an “anticipatory, forward-looking, and pre-emptive” policy response to the rise in global crude oil prices and the depreciation in Indonesian rupiah. It is the highest rate since the bank made the instrument its main policy rate in 2016.

Inflation readings

  • Consumer price inflation in the US accelerated for a second straight month to the highest level since September at 3.5% YoY in March. This was compared to 3.2% in February and a consensus of 3.4%. Producer prices in the US rose 2.1% YoY, which is the highest in 11 months.
  • Consumer price inflation in the UK declined to its lowest level in two and a half years at 3.2% in March from 3.4% in February due to the softening of food prices. However, the inflation was below the consensus estimates of 3.1% and remained above the Bank of England’s target of 2%. However, given the direction of movement, economists believe inflation is likely to fall further in April.
  • Consumer price inflation in the Euro Area slipped to a 4-month low of 2.4% in March from 2.6% in February but still exceeded the European Central Bank’s target of 2%. Inflation for food, alcohol, and tobacco went down in March compared to February.
  • Consumer price inflation in Japan declined to 2.7% in March from February’s 3-month peak of 2.8% and met the consensus estimates. Prices reduced in categories like transport (2.9% in March vs 3% in February), clothes (2% vs 2.6%), furniture & household utensils (3.2% vs 5.1%), healthcare (1.5% vs 1.8%), communication (0.2% vs 1.4%), and culture & recreation (7.2% vs 7.3%).
  • Consumer price inflation in China decelerated to 0.1% YoY in March compared to 0.7% in February and consensus estimates of 0.4%. The deceleration is attributed to a seasonal decrease in demand for food and travel services after the Spring Festival holidays. Meanwhile, producer prices in the country declined 2.8% YoY in March compared to 2.7% in February. It is in line with consensus estimates.

Other economic indicators

  • The US economy started 2024 with a slower quarterly growth due to a decline in private inventory, a rise in imports, and sluggish growth in private consumption at 2.5% compared with a 3.3% growth in Q42023. Fixed investment and government spending at the state and local level remained solid contributing positively to the GDP growth. The Q12024 annualised growth of 1.6%, when adjusted for seasonality and inflation, is lower than the consensus estimates of 2.4%
  • Purchasing Managers’ Index (PMI) readings: The manufacturing PMI reading for March by the Institute for Supply Management (ISM) for the US indicated a rebound in the sector after one and half years (since September 2022) due to a sharp pick up in production and new orders. It increased to 50.3 (above 50 indicates expansion) in March 2023 from 47.8 (below 50 indicates contraction) in February and surpassed the consensus estimates of 48.4. The HCOB Eurozone Manufacturing PMI came in at 46.1 in March 2024 versus 46.5 in February. The March reading is a 3-month low due to changes in suppliers’ delivery times and stocks of purchases. The Caixin General Manufacturing PMI for China increased to 51.1 in March from 50.9 in February driven by higher output and a rise in input purchases by Chinese manufacturers. The au Jibun Bank Japan Manufacturing PMI came in at 48.2 in March 2024 versus 47.2 in February. It was the 10th straight month of contraction in factory activity, but the softest contraction since November 2023, amid a lower reduction in output and new orders. The HSBC India Manufacturing PMI jumped to a 16-year high at 59.1 in March from 56.9 in February. This happened as India’s manufacturing output grew for the 33rd consecutive month driven by the momentum in consumer, intermediate, and investment goods sectors. The J.P. Morgan Global Manufacturing PMI increased marginally to 50.6 in March from 50.3 in February, making its highest reading since July 2022. This happened due to an acceleration in manufacturing output growth in the US and China while India led the rankings. There are some improvements in Euro zone despite being an overall lag. JP Morgan noted a steep downturn in Germany and Austria, further contraction in France, and a fresh decline in Ireland.


  • Services PMI: The ISM Services PMI in the US declined to 51.4 in March from 52.6 in February and came in below the consensus estimate of 52.7. The decline is led by sluggish growth in new orders and a contraction in employment. The S&P Global UK Services PMI slipped to 53.1 in March from 53.8 in February. Despite the moderation, the expansion continued with resilient business and consumer spending reported by companies. The au Jibun Bank Japan Services PMI revised lower to a 7-month high of 54.1 in March versus 52.9 in February, indicating a 19th straight month of expansion in the service sector, led by higher demand and growing customer base.
  • Retail sales in the US increased more than expected by 0.7% MoM in March compared to a forecast of 0.3%. Sales growth in February has been revised upwards from 0.6% to 0.9% MoM. The sales growth is driven by a strong rise in receipts at online retailers.
  • Industrial production in the Euro Area and the European Union fell 6.4% and 5.4% YoY in February. In Euro zone, it extended the 6.6% contraction in January. Among the EU member states, the highest monthly gain in industrial output was recorded in Ireland (3.8%), Hungary (3.5%), and Slovenia (3.3%) whereas the largest declines were observed in Croatia (4.6%), Lithuania (3%), and Belgium (2.7%).
  • The Chinese economy grew better than expected in the first quarter of CY2024 at 5.3%, higher than the consensus estimates of 4.6%. The growth is attributed to improvements in high-tech manufacturing. It also marked an acceleration in growth from 5.2% in the previous quarter.


Disclaimer:

The details mentioned above are for information purposes only. The information provided is the basis of our understanding of the applicable laws and is not legal, tax, financial advice, or opinion and the same subject to change from time to time without intimation to the reader. The reader should independently seek advice from their lawyers/tax advisors in this regard. All liability with respect to actions taken or not taken based on the contents of this site are hereby expressly disclaimed.
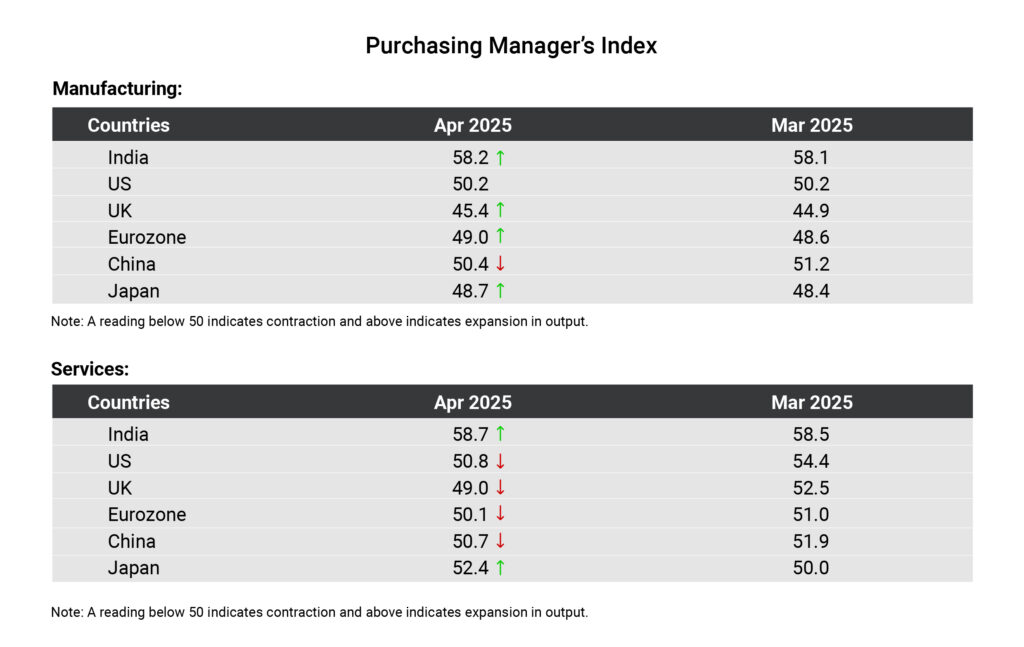
The Month That Was – Macroeconomic takeaways from the month of March 2024

Domestic Economic Updates

  • Purchasing Managers’ Index (PMI) readings: India’s manufacturing sector activity grew at the fastest pace in 5 months as reflected in the HSBC India Manufacturing PMI reading. The index rose to 56.9 in February (revised upwards) from 56.5 in January driven by a rise in factory production and sales. Meanwhile, India’s services sector activity continued to expand although the momentum eased due to a slowdown in new orders and output. HSBC Services PMI came in at 60.6 in February (lower than the flash estimate of 62) compared to 61.8 in January.
  • India’s unemployment scenario has been improving since the COVID-19 pandemic driven by a pickup in economic activity after gradual unlocking. According to the report by National Sample Survey Organisation (NSSO), the unemployment rate for individuals aged 15 and above (defined as the percentage of unemployed individuals in the labour force) came down to 3.1% in 2023 from 3.6% in 2022. Similar positive trend has been witnessed in unemployment among males and females.
  • India’s consumer price/retail inflation (CPI) went down marginally to 5.09% YoY in February from 5.1% YoY in January thereby easing to a 4-month low and remaining within the RBI’s tolerance band of 2-6%. The headline inflation kept steady on a sequential basis due to a rise in prices of certain food items (like cereals and fish) offset by a decline in prices of other food items (like spices, eggs, and edible oil). Overall food inflation rose to 8.66% in February from 8.3% in January. The vegetable inflation increased to 30.25% in February from 27.03% in January. The fuel and light inflation declined further to -0.77% in February from -0.60% in January.
  • India’s wholesale price inflation (WPI) eased to a 4-month low of 0.20% YoY in February from 0.27% in January coming in below the consensus estimates of 0.25%. The moderation in WPI is attributed to a sharp fall in prices of manufactured products (-1.27% vs. -1.13% in January) and power (-1.59% vs. -0.51% in January). Food inflation rose to 4.09% YoY in February from 3.79% in January while prices of primary articles (food particles, minerals, and vegetables) went up 4.49% YoY vs. 3.84% in January.
  • India’s industrial output, as depicted by the Index of Industrial Production (IIP), increased by 3.8% YoY in January 2024, decelerating from 4.2% YoY in December 2023 (revised from 3.8%). The slowdown is caused by the declaration in the growth of manufacturing output (which accounts for over 77% of the overall industrial output) to 3.2% in January from 4.5% in December 2023. This more than offset the growth in mining and electricity production (5.9% and 5.6% vs. 5.2% and 1.2%, respectively in December 2023).
  • India’s merchandise trade deficit widened to US$18.71 billion in February from US$17.49 billion in January. This happened as imports rose 12.2% YoY at US$60.1 billion while exports increased 11.9% YoY to US$41.4 billion, led by higher shipments of engineering goods, electronic items, and pharma products. Total exports are the highest in the current fiscal year. Gold imports during the month surged ~134% to US$6.15 billion.
  • India’s current account deficit (CAD), which is the excess of imports of goods and services over exports of goods and services, narrowed both MoM and YoY bases in the third quarter of FY24 ended December 2023. The CAD reduced to US$10.5 billion or 1.2% of GDP in Q3FY24 from US$11.4 billion or 1.3% of GDP in the September quarter/Q2FY24 and US$16.8 billion or 2% of GDP in Q3FY23. The decline is attributed to higher net services exports (driven by software, business, and travel services) at US$45 billion and remittances at US$29 billion (see chart).

Growth forecasts

  • Global rating agency Moody’s upgraded India’s CY2024 GDP growth forecast from 6.1% earlier to 6.8% based on “stronger-than-expected” economic data and mentioned that the country will remain the fastest growing among G20 nations. In Oct-Dec 2023, India’s economy grew 8.4% surpassing analysts’ expectations of 6.6%, which Moody’s attributed to the government’s capital spending and vigorous manufacturing activity.
  • Fitch Ratings revised the GDP growth forecast for India upwards by 0.5 percentage points (ppt) to 7% in FY25, expecting strong expansion in the economy to continue. The rating agency believes domestic demand, particularly investment, will be the main catalyst of growth in the country, supported by sustained levels of business and consumer confidence. The agency also raised the global growth forecast by 0.3 ppt to 2.4% for 2024. The growth forecast for the US has been upgraded to 2.1% from 1.2% for the year. However, the forecast for China has been trimmed to 4.5% from 4.6% for 2024 due to a weaker outlook on the real estate market and rising evidence of deflationary pressures.
  • The US-based market intelligence and credit rating provider S&P Global raised India’s GDP growth forecast by 0.4 percentage points to 6.8% for FY25 on the back of robust domestic demand and recovery in exports. However, the forecast is lower than the Centre’s official estimate of 7.6%. It also expects the Reserve Bank of India (RBI) to cut repo rate by 75 basis points in FY25 as consumer inflation is expected to decline further.

Global Economic Updates

 Central bank policy actions

  • The US Federal Reserve kept the federal funds rate steady at a 23-year high of 5.25%-5.5% for a 5th consecutive time, which is in line with market expectations. However, most members of the Federal Open Market Committee (FOMC) are still projecting three rate cuts later in 2024, according to the Fed’s Summary of Economic Conditions. The US policymakers revealed that while inflation is coming down, it “does not expect it will be appropriate” to cut rates until the bank is confident about inflation moving towards its 2% target.
  • The Bank of Japan (BOJ) officially ended its negative interest rate policy by increasing its key interest rates for the first time in 17 years from -0.1% to a range of 0- 0.1%. Economists believe the next rate hike might occur in the second half of 2025. In 2016, Japan cut the interest rate below zero in order to stimulate the country’s stagnating economy and encourage people to spend their money rather than depositing in a bank. BOJ also announced that it would abandon its yield curve control (YCC) policy, also introduced in 2016, which saw it buying Japanese government bonds to control interest rates. BOJ Governor Kazuo Ueda stated that the decision to end negative interest rates is the wage arbitration that is currently taking place between employers and unions and major corporations hiking wages for their workers.
  • The Reserve Bank of Australia (RBA) decided to keep the cash rate target unchanged at 4.35% and the interest rate paid on Exchange Settlement balances steady at 4.25%. The RBA noted that inflation continues to moderate, in line with its recent forecasts driven by moderating goods inflation. However, services inflation remains elevated and has been moderating at a more gradual pace. Despite encouraging signs of moderating inflation, RBA is of the view that the economic outlook remains uncertain.
  • People’s Bank of China left its 1-year loan prime rate (LPR) steady at 3.45%, while the 5-year LPR was kept unchanged at 3.95%. This is in line with market expectations after the central bank kept its key policy rate steady last week. China has forecasted an economic growth target of ~5% for 2024 while it needs to revive its struggling property sector. Most new and outstanding loans in China are based on the 1-year LPR, while the 5-year rate influences the pricing of mortgages.
  • China’s central bank left a key policy rate unchanged at 2.5% for its 387-billion-yuan (US$54 billion) worth of one-year medium-term lending facility (MLF) loans to some financial institutions. The status quo was in line with expectations. With 481-billion-yuan (US$67 billion) worth of MLF loans set to expire this month, the operation resulted in a net 94-billion-yuan (US$13 billion) fund withdrawal from the banking system.
  • The Bank of Canada (BoC) kept its key overnight rate at 5% as part of its continued efforts to bring inflation down to its target level of 2%. In January 2024, inflation dipped to 2.9% but remained above the target level. BoC hiked the rate to 5% in July 2023, marking the first time since April 2001 that the rate had hit the 5% mark.

 Inflation readings 

  • Consumer price inflation in the US edged up to 3.2% YoY in February from 3.1% YoY in January and came in above the consensus estimates of 3.1%. The rise is attributed to a rise in shelter and gasoline price indices, which contributes over 60% to the monthly rise in the overall index. Although the inflation is off the mid-2022 peak, it is still above the Fed’s target level of 2%.
  • Consumer price inflation in the UK dropped to the lowest level since September 2021 at 3.4% in February from 4% in January. The softness is attributed to a slowdown in prices of food and restaurants. However, the inflation is still above the Bank of England’s target of 2% fuelling the speculation that the central bank might hold on to the interest rates at the same level in the next meeting.
  • Consumer price inflation in the Euro zone declined to 2.6% YoY in February from 2.8% in January. However, it remained above the consensus estimates of 2.5%. The decline is attributable to a fall in food and drink costs (rose 4% in February vs. 5.6% in January) and energy prices (fell 3.7% in February). Core inflation, which excludes volatile energy, food, alcohol, and tobacco prices, declined to 3.1% in February from 3.3% in January.
  • The annual inflation in Japan rose to 2.8% in February from 2.2% in January, hitting the highest level since last December 2023. The inflation accelerated as energy subsidies introduced by the government in February 2023 started losing their effect. The core inflation surged to a 4-month high of 2.8% from 2% in January and came in above the central bank’s target of 2% for 23 straight months.

Other economic indicators

  • PMI readings: The ISM Manufacturing PMI in the US declined to 47.8 in February from 49.1 in January and came in below the consensus estimates of 49.5. The further contraction in the manufacturing activity is attributed to declines in the new orders index from 52.5 in January to 49.2 in February and the production index from 50.4 to 48.4, the lowest level since July 2023. The ISM Services PMI in the US declined to 52.6 in February from 53.4 in January depicting continued expansion in the sector for the 14th consecutive month. The S&P Global UK Manufacturing PMI rose to 47.5 in February (revised upwards) from 47 in January. Despite the rise, PMI data indicated a contraction in the manufacturing sector for the 19th consecutive month due to disruptions in production and vendor delivery schedules led by the crisis in the Red Sea. The Caixin China General Service PMI declined further for the second straight month to 52.5 in February from 52.7 in January and 52.9 in December 2023. Despite being in the expansionary zone for the 14th straight month, the subsequent decline in the index is led by a subdued rise in new orders compared to the average recorded in 2023. The au Jibun Bank Japan Services PMI rose to 52.9 (revised higher from 52.5) in February from January’s 4-month peak of 51.5 driven by domestic demand in the sector. It marks the 18th straight month of expansion in the sector (above the 50 threshold) driven by an uptick in new businesses amid tourism demand and product launches. The J.P. Morgan Global Composite Output Index rose to 52.1 in February from 49.7 in January indicating a transition from contraction to expansion in global economic activity and new orders. The recovery is led by the services sector and the first expansion of manufacturing output since July 2023.
  • The unemployment rate in the US inched up to 3.9% in February from 3.7% in January. The February rate was the highest since January 2022 and exceeded market expectations of 3.7%. The labor force participation rate was 62.5% in February for the third consecutive month.

Disclaimer:

The details mentioned above are for information purposes only. The information provided is the basis of our understanding of the applicable laws and is not legal, tax, financial advice, or opinion and the same subject to change from time to time without intimation to the reader. The reader should independently seek advice from their lawyers/tax advisors in this regard. All liability with respect to actions taken or not taken based on the contents of this site are hereby expressly disclaimed.
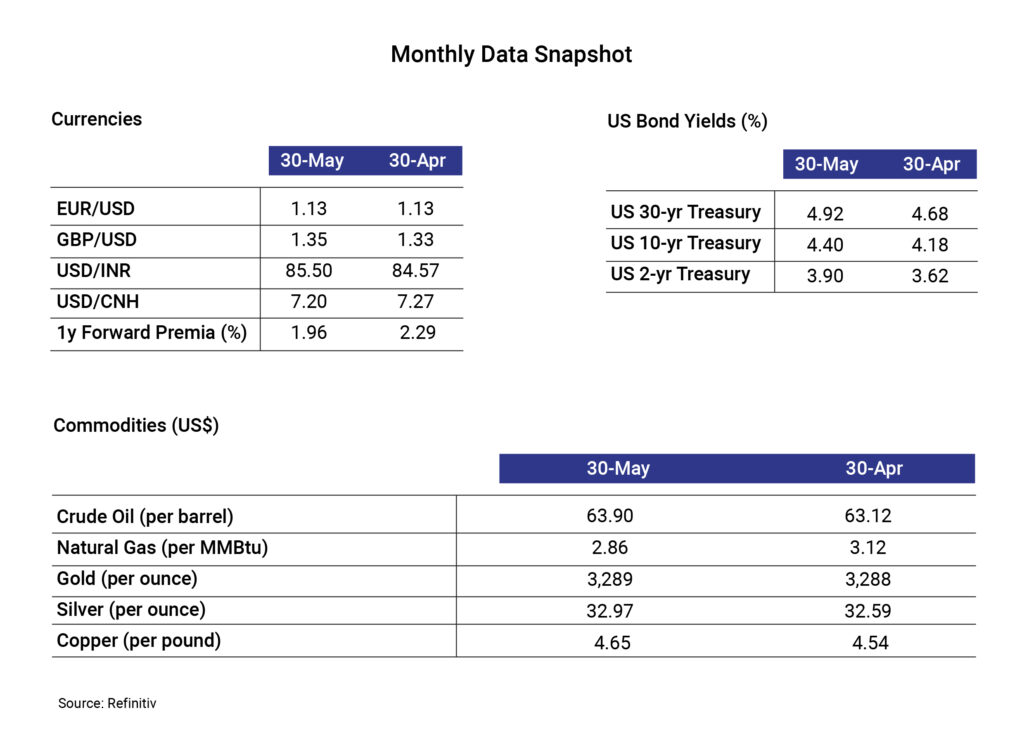
The Month That Was – Macroeconomic takeaways from the month of February 2024

Global Economic Updates

 Central bank policy actions

  • The Federal Open Market Committee (FOMC) kept the benchmark interest rates unchanged at 5.25%-5.50% for the 4th consecutive time as expected by the Street. Since March 2022, the US Federal Reserve hiked rates 11 times to combat inflation. As per the previous FOMC meeting, rate cuts are likely to happen in 2024. However, the Fed’s recent policy statement cast doubt on the prospect of a rate hike on the immediate horizon.
  • The European Central Bank (ECB) maintained the status quo on its benchmark interest rates at the record high level of 4% in order to make sure inflation is firmly under control before any rate cut decision, which is expected later this year. ECB President Christine Lagarde said, “We need to be further along in the disinflation process before we can be sufficiently confident that inflation will actually hit the target in a timely manner”.
  • The Bank of England (BoE) maintained the status quo on its interest rates, as expected, at the 15-year high of 5.25%, which stood since August following the end of nearly 2 years of rate hikes. The decision came with a majority of 6-3. The bank is still cautious about the surge in inflation as it’s still above the target level of 2% and hovering around 4% currently.
  • The Central Bank of Philippines (BSP) kept its benchmark interest rates unchanged as the bank perceives the risks of inflation to be receded but remain tilted upward. Its 7-member monetary board kept its target reverse repurchase rate at 6.5% and held the overnight deposit and lending rates at 6% and 7%, respectively.
  • China’s central bank cut its 5-year loan prime rate for the first time since last June by 25 basis points to 3.95%. However, the bank left its 1-year rate unchanged at 3.45% to ease pressures on the troubled real estate market.
  • The Bank of Indonesia maintained the status quo on rates at 6% as widely expected to support its currency rupiah and limit imported inflation pressures. The central bank was upbeat about the 2024 global growth, driven by the US and India, and stayed positive on domestic growth prospects.

Inflation readings

  • Consumer price inflation in the US came in at 3.1% YoY in January, which is lower than 3.4% YoY in December 2023. However, it was higher than the consensus estimates of 2.9%. Core inflation, which excludes volatile food and energy prices, decelerated to 3.9% YoY in January from 3.7% in December but it came in above the market expectations of 3.7%. Despite the upward surprise caused by higher shelter and healthcare expenses, the downward trajectory in inflation following its surge in 2022 makes the situation favourable for a near-term interest cut in the US.
  • Consumer price inflation in the UK edged higher to 4% YoY in January from 3.9% in December 2023. However, it is lower than the consensus estimates of 4.2%. The upward pressure is led by housing and household services, mainly higher gas and electricity charges. Core inflation, which excludes volatile food, energy, alcohol, and tobacco prices, was 5.1% in the month, which was below the consensus estimate of 5.2%.
  • Inflation in Europe’s largest economy, Germany, dipped to its lowest level since June 2021 at 2.9% YoY in January 2024 compared with 3.7% YoY in December 2023 due to the favourable impact of falling energy prices, flash estimates revealed. However, the favourable impact of energy prices has masked the worrisome trend of monthly price increases for consumer goods and food.

 Other economic indicators

  • The US economy expanded at a sluggish rate in the final quarter of CY2023 at 3.2% compared to the earlier quarter growth of 4.9%. However, the GDP growth remained above 2% for the last 6 quarters driven by a rise in consumer and government spending, private investment, and exports defying fears of a recession in the world’s largest economy.
  • The growth in the US job market was surprisingly higher in January as nonfarm payrolls rose 353,000 in the month compared to the Dow Jones estimate of 185,000. The unemployment rate was 3.7% in the month, slightly lower than the estimate of 3.8%. The wage growth was also stronger as average hourly earnings increased 0.6%, which is 2x the monthly estimate.
  • Consumer confidence in the US recorded its third consecutive monthly rise hitting the highest level since July 2021. The University of Michigan sentiment rose to 79.6 in February from 79 in January, indicating resilience among consumers despite interest rates being at their highest level in over two decades.
  • The IMF, in its latest World Economic Outlook, raised the forecast for global growth by 0.2 percentage point (ppt) to 3.1% YoY for 2024 compared to the October forecast (the same as in 2023) due to resilience in the US and emerging economies and strong consumption-driven growth. For 2025, the growth is expected to accelerate to 3.2%. However, the UN agency is cautious about the outlook for Europe due to the impact of geopolitical conflicts, and tight monetary conditions, among other factors. It expects the growth in the block to be 0.5% in 2023 and 0.9% in 2024. The higher forecast for 2024 is attributed to stronger household consumption. For India, the IMF raised the growth forecast by 40 basis points (bps) to 6.7% for FY24 and 20 bps to 6.5% for both FY25 and FY26 due to resilience in domestic demand.
  • PMI readings: In the US, economic activity in the manufacturing sector remained in the contraction zone for the 15th consecutive month in January 2024. PMI reading by the Institute for Supply Management (ISM) came in at 49.1% in January, up 2 ppt from the seasonally adjusted 47.1% in December 2023. The slight improvement in the reading is led by a rise in new orders, fall in backlogs, and a rise in production. In China, the PMI reading for January came in at 49.2% compared with 49% in December 2023 due to higher production and a rise in orders. In India, the HSBC India Manufacturing PMI stood at 56.5 in January 2024 compared with 54.9 in December 2023. The improvement is driven by the strongest growth in the output and new orders since September and a further rise in export orders.
  • Composite PMI Readings: The J.P. Morgan Global Composite PMI, which tracks economic activity in the manufacturing and service sector across the globe, rose to 51.8 in January from 51 in December 2023. The January reading is the highest since June 2023 as service sector activity rose at the quickest pace since July 2023 and the manufacturing sector returned to the expansion territory for the first time in 8 months, driven by increased production in the consumer goods sub-industry.
  • Japan’s economy unexpectedly slipped into a recession led by sluggishness in consumption and capital expenditures. Its GDP fell at an annualised rate of 0.4% in Oct-Dec 2023 after a 3.3% decline in the prior quarter when the market expected a 1.4% rise for the quarter. With this, Japan lost the title of the world’s 3rd largest economy to Germany as the nominal GDP of the former was US$4.21 trillion compared with US$4.46 trillion for Germany in 2023.


Domestic Economic Updates

  • Union Budget: In the Interim Union Budget for FY 2024-25, Finance and Corporate Affairs Minister Nirmala Sitharaman announced the capital expenditure outlay of INR 11.1 lakh crore for the fiscal year, which is up 11.1% YoY and accounts for 3.4% of the GDP. The fiscal deficit is targeted to reduce below 4.5% of GDP by FY2025-26 (down from 5.8% as per the revised estimate for FY2023-24) from the estimated 5.1% of GDP for FY 2024-25. As per the First Advance Estimates of National Income of FY 2023-24, presented along with the Budget speech, India’s real GDP is expected to grow at 7.3%, which is closer to the RBI’s upward revision in growth projections to 7% for the fiscal year driven by strong growth in the second quarter.
  • RBI Monetary Policy: RBI’s Monetary Policy Committee (MPC) has unanimously decided to keep the repo rate unchanged at 6.5% for the sixth consecutive time. 5 out of 6 members voted to remain focused on the withdrawal of accommodation to progressively align inflation with the target (4% within a band of +/- 2%) while supporting growth. The MPC revealed optimism about the domestic economic activity which they expect to continue driven by the momentum in investment demand, positive business sentiments, and rising consumer confidence.
  • Projections: The MPC projected a 7% growth in real GDP for the next fiscal year 2024-25 (Earlier they have projected the same 7% real GDP growth for FY2023-24). However, the inflation projection has been lowered to 4.5% for FY25 from the forecast of 5.4% for FY24. (Refer to the table for the quarterly breakup of real GDP and inflation projections for the fiscal year 2024-25)
  • India’s retail inflation plunged to a 3-month low of 5.1% YoY in January after rising to a 4-month high of 5.69% YoY in December 2023. The fall is attributed to the moderation in food inflation, which softened to 8.3% in January from 9.53% in December 2023. Urban food inflation eased to 9.02% in January from 10.42% in December, while rural food inflation declined to 7.91% in January from 8.49% last December. The core inflation (excludes volatile food and fuel prices) in January declined to the 50-month low of 3.6% in January.
  • India’s wholesale inflation eased to a 3-month low of 0.27% YoY in January, which is further down from 0.73% in December 2023, led by moderation in food inflation, mainly vegetables. Wholesale food inflation declined to 6.85% in January from 9.38% in the prior month as vegetable prices softened to 19.71% in January from 26.3% in the prior month. Potatoes are in deflation while inflation in fruits, eggs, milk, fish, and milk have muted.
  • Industrial output, measured by the index of industrial production (IIP), grew 3.8% YoY in December compared with 2.4% YoY in November. The improvement is driven by a sharp uptick in manufacturing activity (up 3.9% YoY in Jan vs. 1.2% in Dec), while the mining and electricity sectors grew by 5.1% YoY and 1.2% YoY, respectively. In terms of the use-based categories, all showed improvement on a YoY basis except primary goods.
  • India is expected to become the 3rd largest economy in the next three years with a GDP of US$5 trillion, which may hit US$7 trillion by 2030 due to continued reforms, the Finance Ministry stated. Currently, India is the 5th largest economy with a GDP of US$3.7 trillion and the government has “set a higher goal of becoming a ‘developed country’ by 2047. With the journey of reforms continuing, this goal is achievable,” revealed the Ministry.
  • The growth in the output of eight core infrastructure sectors, which accounts for about 2/5th of the nation’s industrial output, dipped to a 15-month low of 3.6% YoY in January from the upwardly revised 4.9% YoY in December 2023 and the year-ago level of 9.7%. The deceleration is attributed to an unfavourable base, a fall in output in refinery products and fertilisers, and slower growth in three sectors including coal, steel, and natural gas.
  • India’s unemployment rate in urban areas dipped to 6.5% in Q3FY24 (Oct-Dec 2023) vs. 6.6% in Q2FY24, as per the Periodic Labour Force Survey. It’s the lowest reading since the start of their survey. The decline is caused by the fall in the male unemployment rate from 6% in Q2FY24 to 5.8% in Q3FY24 while the female unemployment rate remained flat at 8.6% in Q3FY24. Notably, the unemployment rate in urban areas has been falling steadily since the high of 12.6% in Q1FY22 (Apr-Jun 2021) due to Covid.
  • India’s merchandise exports escalated 3.1% YoY to US$36.9 billion in January, led by both oil and non-oil exports. Imports grew 3% YoY to US$54.4 billion led by oil and gold imports, while non-oil non-gold imports went down marginally. The merchandise trade deficit narrowed to a 9-month low of US$17.49 billion in January from US$19.8 billion in December 2023 as imports declined to US$54.41 billion in January compared with US$58.25 billion in December.
  • The HSBC India Services Purchasing Managers’ (PMI) Index, which tracks the economic activity in India’s service sector, rose to a 6-month high of 61.8 in January 2024 from 59 in December 2023 due to the fastest growth in new orders in 6 months and the highest growth in export sales (to countries like Afghanistan, Australia, Brazil, China, Europe, the UAE, and the US) in 3 months. The expansion in business volumes supported the job creation in January, which was the most pronounced in 3 months as well.
  • India’s private sector activity rose to a 7-month high as HSBC Flash India Composite PMI Output Index rose to 61.5 in February from 61.2 in January. The growth is driven by both manufacturing and service sector firms. Manufacturing activity rose to a 5-month high and services activity climbed to a 7-month high in February. Highest sales were recorded from Africa, Asia, Australia, Europe, the Americas, and the Middle East.

The Month That Was – Macroeconomic takeaways from the month of January 2024

Global Economic Updates

Central bank policy actions

  • The People’s Bank of China kept the benchmark lending rates unchanged for the 5th consecutive month in their recent statement. The 1-year loan prime rate (LPR) remained steady at 3.45% while the 5-year LPR is held at 4.2%. The LPRs are based on an average of the lending rates that China’s biggest banks offer their best clients.
  • The Central bank of Turkey raised its key interest rates by 250 basis points to 45% in its prolonged battle against double-digit inflation. However, the hike in the 1-week repo rate was in line with economists’ expectations. Inflation in the country rose to ~65% YoY in December 2023 from 62% YoY in November 2023 while the domestic currency Lira hit a record low against the greenback. Lira went down nearly 40% against the USD year to date and lost over 80% of its value against the same in the last 5 years.

Inflation readings 

  • Consumer price inflation in the US increased to 3.4% YoY in December 2023 from 3.1% in November 2023 and came in above the consensus estimate of 3.2%. Core inflation, which excludes volatile food and energy prices, declined to 3.9% YoY in December compared with 4% in November. Housing costs contributed over half of the overall increase in prices followed by escalating prices of energy and car insurance.
  • Consumer price inflation in the Euro Zone slightly accelerated to 2.9% YoY in December 2023 from an over 2-year low of 2.4% in November 2023, but came in below the market consensus of 3%, flash estimates revealed. The drop in energy prices eased to 6.7% YoY in December from 11.5% in November. Meanwhile, the annual rise in prices of alcohol, and tobacco continued to soften.
  • Consumer Price inflation in Australia decreased to a near 2-year low of 4.3% YoY in November 2023 from 4.9% in October and came in lower than market forecasts of 4.4%. The segments witnessing significant price rises during the month were housing (+6.6%), food and non-alcoholic beverages (+4.6%), insurance and financial services (+8.8%), and alcohol and tobacco (+6.4%).
  • Japan’s consumer price inflation in December 2023 softened to the lowest level since July 2022 at 2.6% YoY compared with 2.8% in November 2023 driven by lowest rise in food prices in 14 months. Moderation in healthcare (2.4% vs 2.5%) and communication (4.8% vs 4.9%) costs in the country also led to the softer inflation during the month.
  • Consumer price inflation in the UK rose to 4% YoY in December 2023 from 3.9% YoY in the previous month due to a rise in alcohol and tobacco prices. It’s higher than the market consensus of 3.8%. Core inflation, which excludes volatile food, energy, alcohol, and tobacco prices, remained flat at 5.1% YoY in December 2023 compared to the previous month.

PMI Readings

  • Both Institute for Supply Management (ISM) and S&P Global Purchasing Managers’ Index (PMI) data for the US indicated continued stress in the sector due to a decline in output and a faster downturn in new orders. ISM manufacturing PMI rose slightly from 46.7 in November 2023 to 47.4 in December 2023 while S&P Global manufacturing PMI declined from 49.4 in November to 47.9 in December 2023. It was the 14th consecutive month that the PMI stayed below 50, which is the contraction zone.
  • PMI readings in China indicated some resilience in the economy. The Caixin China General Manufacturing PMI rose from 50.7 in November to 50.8 in December 2023, beating the consensus estimate of 50.4. This indicated improvement in the sector health in the four out of the past five months. A strong rise in output and new orders led to the improvement in activity. PMI readings in the services sector pointed to a sustained recovery. The Caixin China General Service PMI rose from 51.5 in November to 52.9 in December 2023, beating the consensus estimate of 51.6.
  • PMI reading for the services sector in the UK indicated continued strength in the sector. The S&P Global/CIPS UK Services PMI rose from 50.9 in November to 53.4 in December 2023, which is above the initial estimates of 52.7. This marked the second consecutive month of expansion in the UK services sector in sharp contrast to the contractionary trend in the Eurozone.
  • While most economic indicators in India indicated robust growth, its manufacturing PMI reading showed a downturn despite remaining in the expansionary zone. The HSBC India Manufacturing PMI declined from 56 in November to an 18-month low of 54.9 in December 2023. Economists noted that this could indicate expected moderation in activities in the fourth quarter of FY24 despite strong momentum in the sector.
  • Global economic activity strengthened at the end of 2023 driven by better inflows of new work and a pick-up in business confidence. The J.P.Morgan Global PMI Composite index increased from 50.5 in November to 51.0 in December. Services sector activity improved for the 11th successive month in December 2023 while the slide in manufacturing activity continued for the 7th consecutive month in the month at the global level.

 Other economic indicators

  • Consumer confidence in the US improved significantly on-year due to the downward trajectory of inflation and a better outlook on general economic conditions. It was captured in the rise in University of Michigan’s consumer sentiment index to the highest level since July 2021 at 78.8 in January 2024. The reading came in above the last month’s print of 69.7 and the forecast of 70 despite the public opinion showing concerns on the nation’s economic health.
  • Recessionary conditions in Germany that began at the end of 2022 GDP in Europe’s largest economy fell 0.3% YoY in full-year 2023 due to relentless inflationary pressures, higher energy prices, and weak exports. However, compared to the pre-Covid phase, in 2019, GDP rose 0.7% in the year.
  • China’s GDP grew 5.2% YoY in the fourth quarter of 2023, which is higher than the target set by Beijing (~5%) but lower than market expectations of 5.3%. The growth was marginally higher than 4.9% in the previous quarter. In 2023, the country’s industrial production grew 4.6% YoY, retail sales of consumer goods went up 7.2% YoY and investments in fixed assets rose 3% YoY.


Domestic Economic Updates

  • The growth in India’s index of industrial production (IIP) slowed to an eight-month low of 2.4% YoY in November due to moderation in manufacturing activity (1.2%), electricity (5.8%), and mining (6.8%) sectors, and a high base effect. In the index, 17 out of the 23 manufacturing industries (includes food, textiles, leather, wood, computers, and paper among others) witnessed contraction in November.
  • Retail inflation surged to a 4-month high of 5.69% in December 2023 from 5.55% in November 2023 due to higher prices of food items such as pulses, spices, fruits, and vegetables. The inflation continued to remain within the RBI’s tolerance band of 2-6% for the last 4 months. However, the core inflation declined to 48-month low of 3.89% in December 2023, the first time in the post-pandemic period, from 4.1% in November.
  • India’s wholesale price inflation climbed up to a 9-month high of 0.73% in December 2023 from 0.26% in November 2023 driven by higher prices of food articles, machinery and equipment, other manufacturing and transport equipment, computer, electronics, and optical products. This is the second month in a row the WPI-based inflation came in the positive territory after remaining negative for seven consecutive months.
  • India’s retail inflation for Agricultural Labourers (CPI-AL) and rural labourers (CPI-RL) rose to a multi-month high of 7.71% and 7.46% YoY, respectively due to an increase in prices of food items such as rice, wheat atta, jowar, bajra, maize, pulses, milk, meat goat, sugar, garlic, among others. Food inflation for farm and rural workers hardened to 9.95% and 9.8% in December 2023 compared to 9.38% and 9.14%, respectively, in November 2023. The maximum hike in CPI-AL and CPI-RL has been recorded by Andhra Pradesh driven by higher prices of rice, jowar, bajra, ragi, fruits and vegetables (especially brinjal, lady finger, cucumber), etc.
  • Output growth in India’s 8 core infrastructure sectors — Coal, Natural Gas, Crude Oil, refinery products, fertilisers, Cement, Steel, Electricity — indicated a slowdown as it decelerated from a 12% YoY in October to a 6-month low of 7.8% YoY in November 2023. The growth was higher than the 5.7% recorded in November 2022 but it’s the slowest one recorded since May 2023, when the output of 8 core sectors grew 5.2% YoY. Sectors that showed contraction include Crude Oil at (-0.4% YoY vs. 1.3% YoY in October 23) and Cement (-3.6% YoY vs. 17.4% YoY in October) mainly due to a high base effect. Meanwhile, sectors like refinery products, steel, coal, and electricity contributed the most to the YoY increase in the month.
  • The unemployment rate in India, among persons aged 15 years and above, softened from 8.9% in November to 8.7% in December 2023, according to a survey conducted by the Centre for Monitoring Indian Economy (CMIE). Despite easing, the rate remained at the higher range of 8-10% from October to December 2023. In October 2023, the unemployment rate was 9.4%.


Disclaimer:

The details mentioned above are for information purposes only. The information provided is the basis of our understanding of the applicable laws and is not legal, tax, financial advice, or opinion and the same subject to change from time to time without intimation to the reader. The reader should independently seek advice from their lawyers/tax advisors in this regard. All liability with respect to actions taken or not taken based on the contents of this site are hereby expressly disclaimed.
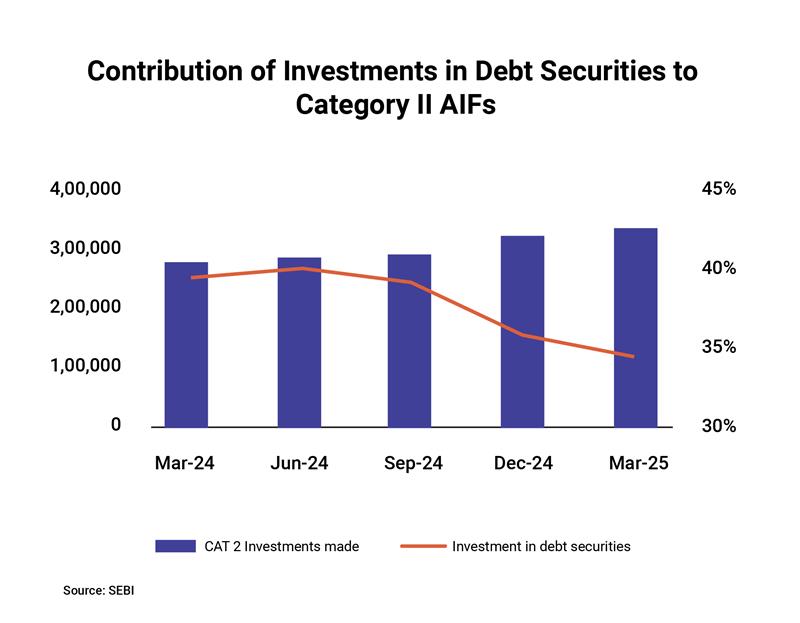
The Month That Was – Macroeconomic takeaways from the month of December 2023

Global Economic Updates

Central bank policy actions

  • The US Federal Open Market Committee (FOMC) unanimously kept the federal funds rate steady at the 22-year high target range of 5.25%-5.5% for the third time in a row. However, the median projection for interest rates at the end of 2024 has been reduced to 4.5% and 4.75%, signalling 75 basis points (bps) of cuts from current levels. Assuming 25 bps per cut, it translates to three rate cuts in 2024.
  • The European Central Bank (ECB) kept its key interest rates unchanged — main refinancing operations at 4.5%, the marginal lending facility at 4.75%, and the deposit facility at 4%. The rates have been kept steady for the second meeting in a row, following 10 consecutive hikes from July 2022 to September 2023. ECB stated, “While inflation has dropped in recent months, it is likely to pick up again temporarily in the near term.” Inflation in the Euro zone has been declining in the last two months from 4.3% YoY in September to 2.9% in October and then to 2.4% in November.
  • The Bank of England (BoE) kept its borrowing rates unchanged at a 15-year high of 5.25% for the third time in a row. Six of the nine members of the Monetary Policy Committee voted to keep rates steady while three opted for a quarter-point hike. However, rate hikes do not look imminent due to the cutback in consumer spending that has been affecting the British economy, which shrank unexpectedly by 0.3% in October following 0.2% growth in September. BoE’s policy actions have been successful in reducing the inflation from the 4-decade high of over 11% YoY in October 2022 to 4.6% on-year in October 2023 (vs. 6.7% in September). However, it’s still above the bank’s target level of 2%.
  • The Bank of Canada retained its key overnight rate at 5% while leaving the door open to another hike due to concerns about inflation while acknowledging an economic slowdown. The central bank hiked rates by a quarter point in both June and July to a 22-year high. Inflation decelerated to 3.1% YoY in October but remained above the target level of 2%.
  • The Bank of Japan (BoJ) maintained its ultra-loose monetary policy by keeping its interest rates at -0.1% while sticking to its yield curve control policy that sets the upper limit for 10-year government bond yield at 1% as a reference. The central bank prefers to wait for a longer time to make a decision for exiting the negative rate. BOJ Governor Kazuo Ueda said, “Uncertainty over the outlook is extremely high and we have yet to foresee inflation sustainably and stably achieve our target. As such, it’s hard to show now with a high degree of certainty how we can exit”.
  • Chinese banks maintained their benchmark loan prime lending rate — 1-year rate at 3.45% and 5-year rate at 4.2% — following a similar move by the People’s Bank of China (PBOC) of keeping its medium-term lending facility unchanged recently after a cut in August. This came amid the expectations of China’s top leaders maintaining supportive monetary policy in 2024, which indicates moderate cuts in policy rates in early 2024.

Inflation readings 

  • Consumer price inflation in the US cooled off to 3.1% YoY in November from 3.2% in October led by a decline in energy costs (gasoline prices fell 6% and fuel oil was down 2.7%). Core inflation, which excludes volatile energy and food prices, came in at 4 % during the month. Shelter prices, which account for nearly one-third of the CPI, rose 6.5% on annual basis, steadily declining since peaking in early 2023.
  • The US personal consumption expenditures (PCE) price index, a gauge used by the US Federal Reserve for inflation (as it’s based on what consumers actually spend on goods and services rather than the cost of goods and services as measured in the consumers price index), approached closer to the central bank’s inflation target of 2%. The headline PCE index rose 2.6% YoY in November 2023 versus 2.9% in October 2023 after peaking over 7% in mid-2022. The core PCE index (which excludes volatile food and energy costs) increased 3.2% YoY in the month, down from 3.4% in October 2023. On a monthly basis, the headline PCE fell 0.1% in November 2023, which is the first monthly decline since April 2020. Sliding energy prices is one of the key factors that kept inflation in check.
  • Annual inflation in the Euro zone fell to its lowest level since July 2021 at 2.4% YoY in November compared to 2.9% in October but it was in line with expectations. The fall is attributed to a sharp decline in energy prices (down 11.5% in November vs. 11.2% in October). Core inflation, which excludes volatile food, energy, alcohol, and tobacco prices, also decreased to 3.6% in November from 4.2% in October.
  • Consumer price inflation in Europe’s largest economy, Germany declined to 3.2% YoY in November from 3.8% YoY in October due to falling energy prices (4.5% YoY). It’s the lowest pace of price increases since June 2021 and weaker than the consensus estimates of 3.5%.
  • Annual inflation in Canada held steady in November at 3.1% YoY, which was the same pace as in the prior month. However, it was higher than expectations of 2.9% for the month. Higher mortgage interest costs, food prices, and rent caused consumers to cut back on purchases keeping the upward pressure on prices in check.
  • Annual inflation in the UK decelerated to 3.9% in November, which is the lowest since September 2021, from 4.6% in October and came in below the consensus estimate of 4.4%. The slowdown is attributed to a fall in fuel costs and softening of food inflation.
  • Consumer price index in China fell 0.5% YoY in November, which is steeper than the 0.2% decline in October. It was the fastest pace of decline since November 2020, led by declining food and energy prices. The intensified deflationary pressure suggests weak domestic demand in the economy.
  • Annual inflation in Japan eased to the 16-month low at 2.8% YoY in November 2023 compared to 3.3% in the prior month due to the least increase in food prices in 10 months (food prices rose 7.3% YoY in November 2023 vs. 8.6% in October 2023). The core inflation also softened to a 16-month low of 2.5% in November 2023. However, both are still above the 2% target set by the Bank of Japan.

PMI Readings

  • ISM Manufacturing Purchasing Manager’s Index (PMI) in the US remained unchanged at 46.7 in November compared to the previous month. However, it came below forecasts of 47.6, indicating a contraction in the manufacturing sector. New orders and inventories dipped at slower pace while pricing stability has been witnessed due to easing energy costs.
  • Activity in China’s manufacturing sector was restored to the expansionary phase as suggested by the General Manufacturing PMI, which climbed to 50.7 in November from 49.5 in October. The PMI reading is the highest since August and beat the market forecasts of 49.8.
  • India’s Manufacturing PMI improved to 56 in November from 55.5 in October, indicating expansion for the 29th month in a row. It is led by a strong demand and better input availability while improvements in the employment scenario helped.

Other economic indicators

  • The Japanese economy contracted 0.7% QoQ in Q3CY2023, compared with a flash estimate of a 0.5% decline and a downwardly revised growth of 0.9% in Q2CY2023. The contraction in GDP is the first since Q3CY2022 led by declines in private consumption, capital expenditures, and public investment.
  • Industrial output in the US grew 0.2% MoM in November, which is less than the expected rise of 0.3%. However, it is better than the revised 0.9% decline in the previous month. Manufacturing output, which comprises 78% of overall production, rose 0.3% MoM in November vs. 0.4% expected by analysts.


Domestic Economic Updates

  • The Reserve Bank of India’s Monetary Policy Committee (MPC) unanimously opted to keep the repo rate at 6.5% at the bi-monthly policy meeting last week. Meanwhile, the MPC has upheld its stance at ‘withdrawal of accommodation,’ with a 5:1 majority. The central bank has revised the GDP growth forecast upwards to 7% from the earlier projection of 6.5% as it anticipates a stronger revised growth of 6.25% in the second half of FY24 compared to the earlier estimate of 5.85%. However, the bank has retained the inflation projections at 5.4% for FY24, expecting a gradual alignment of quarterly headline inflation towards its 4% target by the second quarter of FY25.
  • Consumer price inflation rose to 5.55% YoY in November from 4.87% in October. It came in below market expectations of 5.7% and remained within the Reserve Bank of India’s tolerance band of 2-6% for the third month in a row but above the medium-term target of 4% for 50 consecutive months. Food inflation, which accounts for ~50% of the overall consumer price basket, increased to 8.7% in November, the highest in three months, from 6.61% in October, led by cereals, vegetables, pulses, and fruits. The core inflation reduced from 4.3% YoY in October closer to the RBI’s medium-term target of 4.1% in November. Thanks to moderation in prices of housing, clothing and footwear, fuel and light, and miscellaneous categories compared to October 2023.
  • Wholesale price inflation turned positive at 0.26% YoY in November after remaining negative since April 2023 and beat market estimates of a 0.08% rise. The uptick is attributed to higher prices of “food articles, minerals, machinery & equipment, computer, electronics & optical products, motor vehicles, other transport equipment and other manufacturing, etc.,” an official statement revealed. Food inflation was 8.18% in November compared to 2.53% in October.
  • Retail inflation for agricultural labourers (AL) and rural labourers (RL) increased moderately from 7.08% and 6.92% YoY, respectively, in October, to 7.37% and 7.13%, respectively, in November. The rise is attributed to an increase in prices of certain food items like rice, wheat, atta, pulses, onion, turmeric whole, garlic, and mixed spices.
  • Industrial output in India indicated strong resilience as the Index of Industrial Production (IIP) grew 11.7% in October (beating market expectations of 10%), which is a 16-month high, compared to a decline of 4.1% a year ago. Output across industries registered a double-digit growth except for a few like intermediate and consumer non-durable goods. Manufacturing output, which accounts for over three-fourths of the IIP, increased 10.4% YoY in October 2023 compared to a contraction of 5.8% in October 2022 and a growth of 4.5% in September 2023.
  • India’s GDP growth for the second quarter of FY24 (July-September 2023) came in at 7.6% YoY, surprising positively compared to the RBI estimate of 6.5% and the consensus estimate of 6.8% for the quarter. However, the growth moderated from the 4-quarter high of 7.8% in the previous quarter due to a slowdown in private consumption (3.1% YoY in Q2FY24 vs 6% in Q1FY24). The share of private consumption in the GDP has declined, however, there is a significant increase in the share of investments as shown in the Gross Fixed Capital Formation. The growth in Gross Value Added (GVA) was 7.4% YoY in Q2FY24, which is lower than 7.8% in Q1FY24 due to a slowdown in the agricultural sector led by the erratic monsoon.
  • S&P Global Ratings revised India’s GDP growth forecast upwards by 0.4 percentage points to 6.4% for FY24. The US-based ratings agency believes a strong momentum in the domestic economy will offset headwinds from food inflation and weak exports. The agency has however cut the growth forecast for FY25 from 6.9% to 6.4% due to subdued global growth, a higher base, and the lagged impact of rate hikes. In a recent report titled ‘China Slows India Grows’, the agency estimated India’s growth in 2026 to be 7% compared with 4.6% for China expecting Asia-Pacific’s growth engine to shift from China to South and Southeast Asia.
  • Philippines-based multilateral funding entity Asian Development Bank (ADB) upgraded FY24 growth projections for India from 6.3% to 6.7% due to higher-than-expected FY24 second quarter GDP growth (7.6%). For FY25, ADB has kept its growth forecast unchanged at 6.7%. Notably, RBI recently upgraded its growth forecast for FY24 from 6.5% to 7%.
  • The growth in India’s eight core sectors, comprising coal, crude oil, steel, cement, electricity, fertilisers, refinery products, and natural gas, came in at 12.1% YoY in October versus 9.2% (revised) in September, as per the data revealed by the Ministry of Commerce and Industry. A low base and double-digit growth in electricity, natural gas, coal, steel, and cement led to higher growth in the month.
  • India’s unemployment rate dropped to 9.16% in November from a 29-month high of 10.05% in October, due to a fall in unemployment in rural areas as November is the month when harvesting of the kharif paddy crop begins, and sowing of rabi-crops picks up. The rural unemployment rate declined to 9.05% in November (vs. 10.82% earlier), while the urban unemployment rate increased to 9.39% (vs. 8.44% earlier).
  • India’s gross fiscal deficit during April-October 2023 stood at ~INR 8 lakh crores, which is ~45% of its annual budgeted estimates. The deficit slightly narrowed from 45.6% reported in the comparable period a year ago. Total receipts were recorded at INR 15.9 lakh crores, while overall expenditure in the period stood at INR 23.9 lakh crores.
  • India’s current account deficit (CAD) narrowed to 1% of GDP in the second quarter of FY24 compared to 1.1% of GDP in the previous quarter and 3.8% of GDP in the same quarter a year ago. In absolute terms, CAD declined to US$8.3 billion in the second quarter of FY24 from US$9.2 billion in the first quarter of FY24 and US$30.9 billion in the second quarter of FY23. The decline in CAD is attributed to the moderation of the merchandise trade deficit, higher inflows from services trade, and higher remittances.


Disclaimer:

The details mentioned above are for information purposes only. The information provided is the basis of our understanding of the applicable laws and is not legal, tax, financial advice, or opinion and the same subject to change from time to time without intimation to the reader. The reader should independently seek advice from their lawyers/tax advisors in this regard. All liability with respect to actions taken or not taken based on the contents of this site are hereby expressly disclaimed.
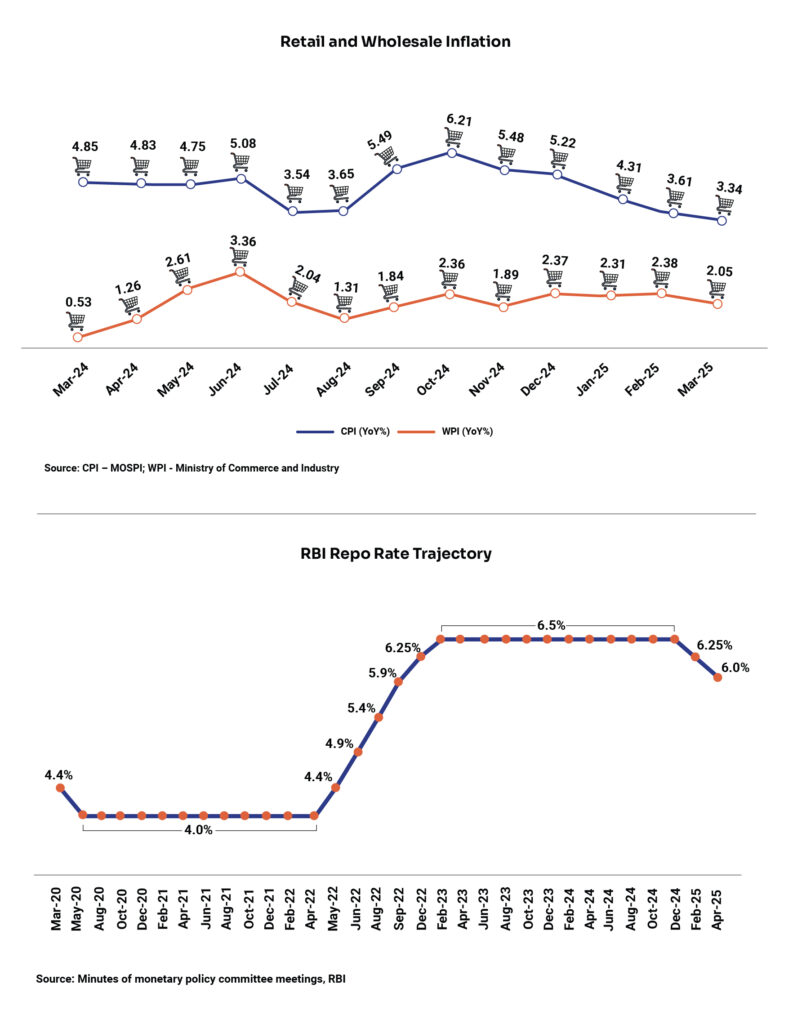
US Fed keeps rates steady for the third time, indicates rate cuts in 2024

The 19-member US Federal Open Market Committee (FOMC) unanimously kept the federal funds rate steady at the 22-year high target range of 5.25%-5.5% for the third time in a row after following a spate of 11 rate hikes since March 2022 (including four in 2023) to combat inflation.

“Inflation has eased from its highs, and this has come without a significant increase in unemployment. That’s very good,” said Jerome Powell, the Federal Reserve Chair. In fact, this is the first time the Fed has formally acknowledged progress in its fight against inflation since its first spike in June 2022.

Inflation in the US came down to 3.2% YoY in October from September’s reading of 3.7% and last year’s peak of 9.1%. It came in below the consensus estimate of 3.3%. The core CPI, which excludes the impact of food and energy prices, went up 4% YoY in October, which was also below the consensus estimate of 4.1%.

While sounding confident, Powell is not yet ready to commit that the work is over. “This result is not guaranteed. It is far too early to declare victory,” he said while warning that the US economy could still enter recession unexpectedly despite being resilient in 2023.

Rate Cuts and Economic Projections

Projections after the Fed meeting indicated the end of the tightening cycle. A near-unanimous 17 of 19 Fed officials predicted lower policy rates by the end of 2024. The median projection for interest rates at the end of next year has been reduced to 4.5% and 4.75%, signalling 75 basis points (bps) of cuts from current levels. Assuming 25 bps per cut, it translates to three rate cuts in 2024.

In the Summary of Economic Projections (SEP), the Fed foresees core inflation peaking at 2.4% in 2024, which is lower than September’s projection of 2.6%, before softening to 2.2% in 2025 and 2% (the target rate) in 2026.

Projections for GDP growth have been lowered marginally from 1.5% to 1.4% in 2024 and are seen to improve to 1.8% in 2025 and 1.9% in 2026. Meanwhile, the unemployment rate is expected to rise from 3.7% currently (in November) to 4.1% in 2024 and continuing at that level in 2025 and 2026.

Fed’s ‘dot plot’, which maps out directions in policymakers’ expectations for interest rates going ahead, shows individual expectations of four more cuts in 2025 and three more in 2026, while longer-range projections seem to be less firm.

Our Take

Overall, the US Fed’s comments on the progress on inflation and its discussion of rate cuts during the policy meeting (in deviation from the last policy where there were no discussions on cuts) are perceived to be dovish. The statements on taking action, if prices were to rebound, were conveniently ignored as the focus shifted to the Fed’s muted response on the cuts being priced already and easing financial conditions.

Markets cheered the policy with US bond yields dropping 20-30 bps led by the front end of the curve, with a 90% probability of a rate cut as early as March next year. Risk assets roared and the dollar weakened in response to the last policy of an extremely volatile year.

While the gradual direction of yields looks softer, markets have gone a little ahead in pricing much more aggressive cuts than what the Fed indicated. While the hiking cycle is broadly behind us, cuts could be delayed if there are a couple of adverse data surprises, keeping rates a little higher for longer.

Disclaimer:

The views provided in this blog are the personal views of the author and do not necessarily reflect the views of Vivriti. This article is intended for general information only and does not constitute any legal or other advice or suggestion. This article does not constitute an offer or an invitation to make an offer for any investment.  

The Month That Was – Macroeconomic takeaways from the month of November 2023

Global Economic Updates

 Central bank policy actions

  • The US Federal Open Market Committee unanimously held on to the 22-year high federal funds rate in a target range of 5.25%-5.5% for the second time in a row after following a spate of 11 rate hikes since March 2022 (including four in 2023) to combat inflation. This happens as the US economy showed strength and the labour market remains tight, despite the string of rate hikes. 
  • The Bank of Japan (BOJ) allowed more flexibility in its yield curve control as it retained the target level of its 10-year government bond yield at 0% but loosened the ‘upper bound’ to fluctuate to 1%. In its July meeting, BOJ committed to let yields fluctuate in the range of +/- 0.5 percentage points from its 0% target level. BOJ also raised the inflation forecast due to the prolonged effects of pass-through cost hikes, led by an increase in crude oil and import prices. The consumer price inflation forecast is raised from 2.5% to 2.8% for fiscal 2023; 1.9% to 2.8% for fiscal 2024; and 1.6% to 1.7% for fiscal 2025.
  • The Bank of England kept its benchmark interest rates unchanged at the 15-year high level of 5.25% for the second time in a row expecting inflation to slide further to ~4.5% in 2023 before continuing to dip further in 2024. UK’s inflation came in at 6.7% in September which is well above the long-term target of 2% but it fell considerably from the peak of 11.1% reported in October 2022.
  • The People’s Bank of China kept the benchmark lending rates – 1-year loan prime rate (LPR) and 5-year LPR unchanged at 3.45% and 4.20%, respectively, on the expected line. In China, new and outstanding loans are based on a 1-year LPR, and mortgage pricing is influenced by the 5-year LPR. The economic recovery of the world’s second-largest economy remains patchy calling for more monetary easing. However, such easing could put further downside pressure on the weakening yuan.
  • Indonesian central bank, Bank Indonesia (BI) also kept the benchmark 7-day reverse repo rate unchanged at 6%, as expected, to support the domestic currency rupiah amid global uncertainties. The country’s inflation rose from 2.28% in September to 2.56% in October, but it remained within BI’s target range of 2%-4% for the year.


Inflation readings 

  • Consumer Price Inflation (CPI) in the US dipped to 3.2% YoY in October from September’s reading of 3.7% and came in below the consensus of 3.3%. The core CPI, which excludes the impact of food and energy prices, went up 4% YoY, which is below the consensus estimate of 4.1%. Food prices were up 3.3% YoY.
  • CPI in the Eurozone declined to 2.9% YoY in October from 4.3% in September. The reading came in below the consensus estimates of 3.1%. The core inflation slowed to 4.2% YoY in October from 4.5% in September. Energy prices fell 11.1% compared to 4.6% in September. Inflation readings were the lowest in Belgium (-1.7%) and the Netherlands (-1%) and the highest in Slovakia (7.8%) and Slovenia (6.6%).
  • CPI in the UK declined from 6.7% YoY in September to a 2-year low of 4.6% YoY in October due to the steep rise in energy costs in the comparable month a year ago. Core CPI, which strips out volatile food, energy, alcohol, and tobacco prices, declined from 6.1% in September to 5.7% in October.
  • CPI in Canada declined from 3.8% in September to 3.1% in October and was in line with the consensus estimate. The main reason for the decline is the fall in gasoline prices by 7.8% YoY in October. Excluding gasoline prices, inflation came in at 3.6% in the month.
  • CPI in China was -0.2% YoY in October versus flat YoY in September. Economists expected a deflation of 0.1% in the month. Producer prices declined as well by 2.6% YoY pointing to sluggish demand in the economy.
  • Germany’s producer price index declined 11% YoY in October after September’s fall of 14.7% YoY, continuing the fourth consecutive month of deflationary pressures, mainly driven by energy and metal prices. The fall is also attributed to inflated commodity prices due to the Russia-Ukraine conflict in October last year, since when they started declining, partly driven by energy price caps across Europe.


Other economic indicators

  • The US labour market showed signs of loosening as the job additions decelerated from 297,000 in September to 150,000 in October, missing the consensus estimate of a 170,000 rise. The slowdown is attributed to United Auto Workers strikes leading to a net loss of jobs in the manufacturing sector.
  • Manufacturing activity in the US showed contraction for the 12th consecutive month in October following a 28-month period of growth. The ISM Manufacturing purchasing managers’ index (PMI) dipped to 46.7 in the month from the 10-month high of 49 in September (both below the threshold of 50 for expansion). The new orders Index remained in contraction territory as it came 3.7 points lower than the reading in September.
  • China’s manufacturing activity surprisingly contracted in October after showing signs of nascent recovery lately. The manufacturing PMI dipped to 49.5 in October from 50.2 in September and missed the consensus estimate of 50.2. The Chinese policymakers announced a slew of measures (including interest rate cuts and fiscal stimulus) to support the economy. Given the recent data, analysts believe more support may be needed to reach the government’s annual growth target of ~5%.
  • The service sector activity in China remained stable as depicted by the Caixin General Service PMI which rose to 50.4 in October from a 9-month low of 50.2 in September. With this, services activity in the country grew for the 10th straight month. Foreign sales increased due to the removal of travel restrictions attracting more tourists while employment stabilized.
  • Germany, Europe’s largest economy, contracted as the GDP fell 0.3% YoY in the third quarter of 2023, after remaining unchanged in the prior quarter. High inflation continues to erode consumers’ purchasing power. Economists expect the contraction to continue.
  • Euro zone economy contracted 0.1% QoQ in the third quarter of 2023, which is worse than market forecasts of no change. France, Spain, and Belgium reported an expansion in GDP in the quarter (0.1%, 0.3%, 0.5%, respectively), which was more than offset by contraction in Germany, nil growth in Italy, and declines in Austria, Portugal, Ireland, Estonia, and Lithuania.
  • Saudi Arabia and Russia reaffirmed oil supply cuts of more than 1 million barrels a day through the end of 2023. This happens as the oil major nations want to ensure trading of global crude prices with an upside bias amid a weak demand outlook. Saudi Arabia has slashed daily output by 1 million barrels, while Russia has curbed exports by 300,000 barrels, on top of earlier cuts made with fellow OPEC+ nations.


Domestic Economic Updates

  • India’s unemployment rate rose to a more than 2-year high at 10.05% in October from 7.1% in September, survey data by private research firm CMIE revealed. The rise was mainly driven by joblessness in rural India. Unemployment in rural areas surged from 6.2% to 10.8% and in urban areas eased marginally to 8.4% in October.
  • The index of eight core industries rose by 8.1% YoY in September 2023 driven by growth in 7 out of 8 core sectors, viz., coal, steel, electricity, natural gas, refinery products, cement, and fertilisers. However, the growth reflected a declaration from 12.5% in August to a 4-month low in September. Crude oil sector output dipped marginally by 0.4% YoY in the month.
  • The growth in India’s industrial production slipped from a 14-month high of 10.3% YoY in August to a 3-month low of 5.8% YoY in September due to the base effect and a deceleration in the growth of manufacturing output (accounts for 77.6% of the weight of the Index of Industrial Production) to 4.5% YoY in September from 9.3% YoY in August, electricity output to 9.9% YoY from 15.3% YoY in August, and mining sector output to 11.5% YoY from 12.3% YoY in August.
  • India’s CPI softened further to a 4-month low of 4.87% YoY in October from 5.02% in the prior month due to moderation in food prices. With this, the retail inflation was recorded within the Reserve Bank of India’s tolerance band of 4-6% for the second consecutive month. Food inflation, which accounts for ~50% of the overall consumer price basket, rose 6.61% YoY in October versus 6.56% in September. Meanwhile, the country’s wholesale prices remained in the deflationary zone for the 7th consecutive month at -0.52% in October due to favourable base and easing of commodity prices. The items that witnessed a fall in prices include chemicals and chemical products, electricity, textiles, basic metals, food products, paper and paper products, etc.
  • The retail inflation for agricultural labourers (AL) and rural labourers (RL) came in at 7.08% YoY and 6.92% YoY in October, which is higher than 6.70% and 6.55%, respectively in September due to higher prices of certain food items like rice, wheat atta, pulses, vegetables, milk, onion, chillies (green), spices, etc. The food inflation for AL and RL was 8.42% and 8.18% in October versus 8.06% and 7.73%, respectively, in September.
  • India’s merchandise exports increased for the second time in FY24 and rose 6.2% to US$33.6 billion in October led by low base and higher non-oil exports while imports jumped 12.3% YoY to a record high of US$65.03 billion due to higher gold imports on the back of festive demand. With this, India’s merchandise trade deficit widened to an all-time high of US$31.46 billion, surpassing the previous record of US$29.23 billion in September 2022.
  • Total Foreign direct investment (FDI), which includes equity capital of unincorporated bodies, reinvest earnings and other capital, decreased 15.5% YoY to US$32.9 billion during the first half of FY24 (April-September 2023), as per the data released by the Department for Promotion of Industry and Internal Trade (DPIIT). FDI equity inflows declined 24% to US$20.5 billion in the period with the same decreasing from major countries like Singapore, Mauritius, the US, the UK, and the UAE and increasing from countries like the Netherlands, Japan, and Germany. Despite the decline, Singapore emerged as the top investor with US$5.22 billion of FDI during the first half of FY24. State-wise, Maharashtra attracted the highest inflow of US$7.95 billion during the period, compared with US$8 billion in the same period a year ago.


Disclaimer:

The details mentioned above are for information purposes only. The information provided is the basis of our understanding of the applicable laws and is not legal, tax, financial advice, or opinion and the same subject to change from time to time without intimation to the reader. The reader should independently seek advice from their lawyers/tax advisors in this regard. All liability with respect to actions taken or not taken based on the contents of this site are hereby expressly disclaimed.
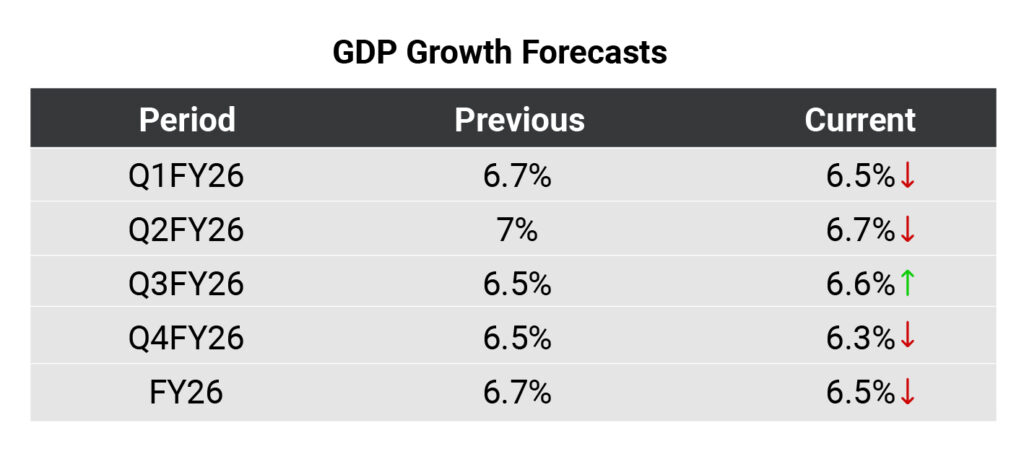
The Month That Was – Macroeconomic takeaways from the month of October 2023

Global Economic Updates

 Central bank policy actions

  • The Bank of Canada kept the key rates unchanged – the overnight rate at 5%, the Bank Rate at 5.25%, and the deposit rate at 5%, while continuing with its policy of quantitative tightening. The bank noted the slowdown in the global economy and stated a moderation in growth further as past increases in rates and the recent surge in global bond yields weigh on demand. It has projected global GDP growth of 2.9% in 2023, 2.3% in 2024, and 2.6% in 2025. The European Central Bank also kept interest rates unchanged for the first time in more than a year between 4% to 4.75%. The ECB President indicated a “broad-based” decline in inflation to 4.3% in September due to drop in fuel costs and easing food prices. The Reserve Bank of New Zealand kept its cash rate steady at 5.5% on the expected line reiterating that previous tightening had helped constrain spending and hence the rates need to remain at a restrictive level to ensure that consumer inflation returns to the 1-3% target range. The Central Bank of Philippines raised interest rates by 25 basis points (bps) to 6.5% indicating further tightening as it warned inflation to stay above its target (2-4%) till the middle of 2024.

 Inflation readings 

  • Consumer Price Inflation (CPI) in the US came in at 3.7% YoY in September, which is slightly faster than the expected pace of 3.6%. Rent and homeowner monthly payments were the biggest contributors to inflation in the month. The core inflation, which excludes food and energy prices, was 4.1% YoY in September (in line with expectations) versus 4.3% YoY in August.
  • CPI in the Eurozone declined to its lowest point since October 2021 at 4.3% YoY in September compared with 5.2% YoY in August. Core inflation, which excludes the impact of volatile energy, food, alcohol, and tobacco prices, dipped from 5.3% YoY in August to 4.5% YoY in September. The contributors to lower inflation are services (4.7% in September vs 5.5% in August), non-energy industrial goods (4.1% vs 4.7%), and food, alcohol & tobacco (8.8% vs 9.7%). Energy costs declined further as well (-4.6% vs -3.3%).
  • CPI in Europe’s largest economy Germany eased to its lowest point since the Ukraine war to 4.3% YoY in September (versus expectations of 4.5% YoY) from 6.4% YoY in August. Thanks to easing food inflation to a larger extent. Core inflation was 4.6% YoY in September compared to 5.5% in August.
  • CPI in the UK remained steady at 6.7% YoY in September, which is an 18-month low reported in August, missing the market expectations of a mild softening to 6.6%. This happens as surging fuel costs amid a sharp rise in global oil costs offset the impact of monthly fall in food prices.

Other economic indicators

  • The US economy expanded at the fastest pace since the last quarter of 2021 by an annualized rate of 4.9% in the third quarter of 2023. The growth is above the market forecasts of 4.5% and a 2.1% rise in the previous quarter. Thanks to strong growth in private consumption, expansion in private inventories, and continued support by government spending, despite a fall in real disposable income.
  • The Gross Domestic Product (GDP) of the UK rose 0.2% QoQ in the second quarter of 2023, indicating a faster post-pandemic recovery, as per the revised data by the Office for National Statistics. This put Britain on a faster track of economic growth compared to Germany or France.
  • The growth in China’s economy decelerated to 4.9% YoY in July-September from 6.3% in Q2 2023. However, the reading came in above market forecasts of a 4.5% rise. The slowdown is attributed to weak global demand for its exports and the struggling real estate sector.
  • The International Monetary Fund (IMF) released its global growth forecast in World Economic Outlook last week. The UN agency raised the GDP forecast for the US due to stronger business investment, favourable consumption growth, and an expansionary government fiscal position. It has lowered the forecast for the Euro zone due to contraction in the German economy among other factors. The growth forecast for India upped to 6.3% for 2023 from 6.1% earlier, due to stronger-than-expected consumption during April-June. The agency reiterated the forecast of global growth for 2023 at 3% and lowered the same for 2024 by 0.1 percentage points (ppt). IMF noted resilience in the global economy despite geopolitical conflicts, energy crisis, and the tightening of monetary policy.

Domestic Economic Updates

  • India’s manufacturing sector activity moderated as the seasonally adjusted S&P Global India Manufacturing Purchasing Managers’ Index (PMI) declined to a 5-month low of 57.5 in September from 58.6 in August due to the sluggish pace of new orders tempering the production growth. Nevertheless, the index remained in the expansionary zone (above the 50 threshold) driven by strong demand.
  • India’s headline retail inflation came back to the central bank’s tolerance range (2-6%) at 5.02% YoY in September compared with 6.83% YoY in August. Thanks to the huge slide in vegetable prices. The reading, a 3-month low, is also lower than the consensus estimates of 5.4% YoY for the month. Meanwhile, the wholesale price inflation remained in the negative territory for the sixth straight month, but the deflation decelerated to -0.26% YoY in September compared to -0.52% in August, which was a 5-month high. As per the Commerce Ministry, “Deflation in September 2023 is primarily due to fall in prices of chemical & chemical products, mineral oils, textiles, basic metals, and food products as compared to the corresponding month of previous year”.
  • Retail inflation for agricultural labourers (AL) and rural labourers (RL) fell from 7.37% and 7.12%, respectively, in August 2023 to 6.70% and 6.55%, respectively, in September 2023. The food inflation fell from 8.89% and 8.64% respectively, in August 2023 to 8.06% and 7.73% respectively, in September 2023.
  • The growth in India’s Index of Industrial Production accelerated to a multi-month high of 10.3% YoY in August from 5.7% in July driven by solid growth in the mining (12.3%), manufacturing (9.3%), and electricity (15.3%) sectors. Resilient domestic and export demand aids the growth in all sectors.
  • The Reserve Bank of India kept the repo rate unchanged at 6.5% in its fourth bi-monthly monetary policy meeting in a unanimous vote by all six members. The central bank remains focused on the withdrawal of accommodation to support growth. It retained real GDP growth forecast at 6.5% and inflation forecast at 5.4% for FY24.
  • India’s unemployment rate declined to a 12-month low of 7.1% in September as per data released by the Centre for Monitoring Indian Economy (CMIE). It reinforces the view that economic activities have picked up ahead of the festive season. The unemployment rate softened in both urban (from 10.09% in August to 8.94% in September) and rural areas (to a 12-month low of 6.2% in September).
  • The domestic air traffic grew 18.3% YoY to 12.25 million passengers in September and over 6% compared to the pre-pandemic era. In terms of passenger load factor (PLF), all airlines witnessed a higher capacity utilisation sequentially in September led by Vistara at 92%. IndiGo continued to be the largest domestic airline with a market share of 63.4% followed by Vistara at 10%, Air India at 9.8%, AirAsia India at 6.7%, SpiceJet at 4.4%, and Akasa at 4.2%.
  • India’s trade deficit fell to a 5-month low of US$19.4 billion in September, reflecting a YoY fall of more than 30%. This happened as imports fell 15% YoY to US$53.8 billion while exports fell only 2.6% YoY to US$34.5 billion in the month. Economists expected a trade deficit of US$23.25 billion for the month.
  • Domestic sales of passenger vehicles rose to 10.7 lakh units in July-September, which is the highest level recorded in any quarter, as per the Society of Indian Automobile Manufacturers (SIAM). It went up 3.6% from the corresponding quarter a year ago. Three-wheelers clocked the highest-ever sales at 1.95 lakh units during the quarter. The rise is attributable to pre-festive season sales. On a monthly basis, sales rose 1.8% YoY to 3.6 lakh units in September.
  • India, which is currently the world’s 5th largest economy, may overtake Japan to be the world’s 3rd largest by 2030, stated S&P Global Market Intelligence. This is estimated after noticing the fast pace of economic growth in 2021 and 2022 and sustained strong growth in 2023 so far. Currently, the US is the largest economy with a GDP of US$25.5 trillion followed by China with US$18 trillion, Japan with US$4.2 trillion, and Germany with US$4 trillion. India is expected to record a nominal GDP of US$7.3 trillion by 2030.


Disclaimer:

The details mentioned above are for information purposes only. The information provided is the basis of our understanding of the applicable laws and is not legal, tax, financial advice, or opinion and the same subject to change from time to time without intimation to the reader. The reader should independently seek advice from their lawyers/tax advisors in this regard. All liability with respect to actions taken or not taken based on the contents of this site are hereby expressly disclaimed.
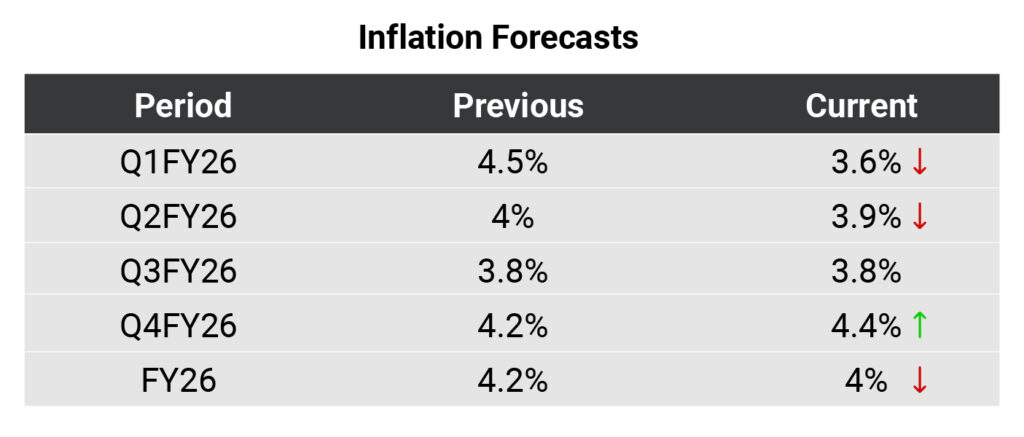
Tracing ‘Beyond Inclusion’ – our Sustainability Report for FY22-23

Sustainability Reporting: Need of the hour

There’s always an element of uncertainty attached to the global economic, social, and environmental landscape. The uncertainty levels heighten due to disruptive events like climate-related disasters and pandemics among others. Upon closer observation, major global disruptions and imbalances are impending, sprouting from extended human negligence of sustainability issues (environmental, social, economic) and disregard of the Earth’s planetary boundaries. Needless to say, the human race is to blame for all the aforesaid shortcomings. We had it all coming!

Human negligence on sustainability issues has compounded over time, and it is only when the ramifications hit quite close to home that awareness and solutions start gaining momentum. The uncertain times we are in herald a global sustainable transition, which for businesses means adopting better ways of doing business and moving away from their Business as Usual (BAU) practices.

As businesses grapple with addressing the rising stakeholder and investor demands and regulatory pressure on sustainable practices, accountability and transparency have emerged as the differentiator that separates credible sustainable businesses from the rest. A good practice that sustainable businesses follow aside from prioritizing and embedding sustainability holistically, includes accounting for and disclosing their positive and negative impacts on the environment, society & economy through mediums like sustainability reporting. Sustainability reports are very effective in communicating and channelizing an organization’s sustainability performance across wider audiences.

Vivriti’s Mission & Sustainability Reporting

Sustainability and impact have been the underpinning purpose driving Vivriti Group’s impactful mission of bringing parity in the Indian mid-market credit space. As a financial institution that deals in debt and equity, our role in the global sustainable transition is paramount through ensuring sustainable financial flows and being a sustainable player in the market. From our business initiatives that are designed to achieve wide-scale financial inclusion, to our responsible business practices (both internal and external), we have been continuously striving to improve our sustainability performance. What better way could there be than to showcase the same through our sustainability reports! Sustainability reporting is an annual exercise for Vivriti, and it has been a transformational medium to display our adoption of responsible, accountable, and transparent practices to wider stakeholders.

Our first sustainability report, ‘Sustainability at Scale’, reflects the achievement of sustainability and impact through our financially inclusive instruments, along with the initiation and integration of sustainable business initiatives.

Our second and latest sustainability report, ‘Beyond Inclusion’ – is centered around surpassing our mission’s objective and magnifying our impact by building ‘a circle of sustainable champions’ through our client-focused ESG offerings. The theme aptly reflects our ongoing commitment to improve our own sustainability performance while uplifting others in the journey. Over the past year, we have devised and implemented various measures to achieve the latter. We formed an ESG Committee, framed and rolled out relevant ESG policies, developed an ESG risk assessment framework, started conducting portfolio-level ESG due diligences, and designed monitoring and stewardship engagement for our clients. Through such client focused ESG measures, we aim to help all our clients embed similar practices and improve their sustainability performance.

Sustainability reporting is a global reporting practice among companies, and there are many reporting frameworks available that companies can choose to align with. Adherence to a widely used framework like the Global Reporting Initiative (GRI) standards helps ensure consistency, comparability, and standardized reporting. Our second sustainability report is based on the updated 2021 GRI standards, which makes it mandatory for companies to follow the reporting principles & disclosure requirements therein. We have measured and provided disclosures on all the parameters required by GRI 1 – Foundation 2021, GRI 2 – General Disclosures 2021, and GRI 3 – Material Topics 2021.

The core of sustainability reporting comprises disclosing and reporting relevant information backed by verifiable data. The appointment of a third-party independent consultant to audit and verify our report has given an additional layer of credibility to the reported information. We also ensured our data collection, measurement, and reporting methods were systematic and methodical.

Below are the steps we followed in measuring and disclosing the reported data:

  1. All data asks were mapped with the requirement of the reporting framework
  2. For data collection, management & measurement, we involved all verticals – Admin, HR, Compliance, Risk, IT, Finance, Sustainability & Impact Team
  3. Appointed a third-party consultant to audit and verify the reported information
  4. Only verified information and data have been disclosed in the report

Delving into the reported information

(I) Effective risk management & board oversight

Sustainability and impact are ingrained in our vision, mission and values, and its prominence has been ratified at the Board level while percolating across the organization. Our ESG interventions holistically address not only the ESG risks & opportunities from our operations (through our sustainability strategy, framework & initiatives) but also that of our clients (through our ESG risk management framework, exclusionary sector list, Vivriti’s Sustainability Assessment Model (VSAM), client ESG due diligence, and monitoring & stewardship engagement).

(II) Environmental & Social accountability

Our environmental & social initiatives are derived from our responsible business intent that transcends our operating boundaries and includes our value chain players through shared responsibility.

(a) Environmental Initiatives:

1. Measures to minimize negative environmental impact:

  • Energy-efficient electronic appliances, lighting, and air-conditioning systems
  • Low-flow water fixtures with sensors and aerators
  • Hand dryers installed near wash basins to replace the usage of paper napkins
  • E-waste from all offices is collected centrally at the Chennai Office and further handled by a third-party waste handler for sustainable and safe waste treatment and disposal
  • Negligible food wastage ensured in our offices in Chennai & Mumbai


2. Carbon emissions reduction/ decarbonization measures supporting transition to a low carbon economy:

  • Our Mumbai Office currently purchases a green power tariff and is powered by 100% renewable energy
  • Aligning our lending & investing towards a responsible & climate-focused portfolio through the implementation of the ESG Policy, Energy Policy, and Green Finance Framework

3. Climate action & ambition:

  • In the purview of our cognizance and responsibility towards climate emergency and action, we have adopted decarbonization initiatives and ESG risk management framework that applies to our operations and to our portfolio
  • Our climate commitments will continually be strengthened to gradually align with 1.5 to 2 deg C pathways
  • Future adoption of relevant global frameworks and target-setting (Taskforce on Climate related Financial Disclosures (TCFD), Carbon Disclosure Project (CDP), Science Based Targets Initiative (SBTi), etc.)
  • We are a current TCFD Supporter and will be adopting the TCFD framework for managing climate risks and opportunities by 2024 or later.

(b) Social Initiatives:

As a socially responsible business, we have implemented various initiatives focused on the upliftment & wellbeing of our people and communities.

1. Focus on our people:

  • Our policies and initiatives catering to Health, Safety & Environment (HSE), Diversity, Equity & Inclusion (DE&I), Human Rights, Prevention of Sexual Harassment (POSH) ensure our workplaces are safe, inclusive, ethical & free from any discriminatory practices
  • Employee benefits:
    • Financial assistance provision for educational advancement, professional development, relocation, personal travels, emergencies & childcare
    • Interest-free employee loans, car leases, bonuses, Employee Stock Option Plans (ESOPs), medical insurance benefits & various leaves
    • Technical training & performance management measures
    • Weekly team reviews, annual/quarterly goal setting, monthly town halls, team outings, offsites, sports league & festival celebrations
    • Other perks – complimentary meals, free daily cab facility for employee commuting, remote working opportunities, and mental health support for new mothers. Our Chennai Office also has games, gym and creche facilities.

2. Focus on our communities

As a responsible business, our positive impact on communities and our social responsibility is non-negotiable. Our Corporate Social Responsibility (CSR) focus areas span across various social initiatives – environmental sustainability & community development, financial literacy, employee engagement, and research & advocacy. The CSR initiatives shortlisted in FY22-23 include a lake restoration project in partnership with the NGO – Environmentalist Foundation of India, and seed funding for two innovative projects of start-ups from the IITM Incubation Cell, Chennai; where, one project is building an advanced sensor technology for real-time river water quality detection & timely intervention for the river Ganga, and the other project is building disability-friendly electric vehicles that can be operated by wheelchair users in university campuses.

Planys Technologies – River Ganga Project

Yali mobility – EVs for wheelchair users

Rajanthangal Lake, Kanchipuram - Before

Rajanthangal Lake, Kanchipuram - After

Conclusion

Priority ESG topics or material topics addressed in the report are derived from the stakeholder materiality assessment that we conduct annually. The materiality assessment revolves around double materiality, anchoring on the internal impact that sustainability issues have on the organization and the organization’s external impact on society, environment and economy. The topics are reflective of the gaps and areas that need intervention to ensure a sustainable business.

Utilization of various stakeholder engagement channels and mediums, including the materiality exercise, has been pivotal in determining our priority material topics. The report presents the case studies of the top 3 material issues thus identified, with a deeper dive into the risk & opportunity, business case & impact, and addressal and progress measurement of the issues.

Branching from our robust governance measures that address ESG risks & opportunities to implementation of targeted policies, frameworks & initiatives, our commitment to sustainability is strongly rooted on the grounds of ethical, accountable & transparent business practices that are based on leading & emerging sustainability and ESG trends. We strive for continuous improvement in our practices catering to the financial and ESG materiality of our operations and beyond (by building a ‘circle of sustainable champions’), while maintaining People, Planet & Profit at the forefront of our business’s strategy and operations.

——————————————————————————————————————

List of Abbreviations Used:

  1. ESG – Environmental, Social & Governance
  2. VSAM – Vivriti’s Sustainability Assessment Model
  3. GRI – Global Reporting Initiative
  4. GHG Protocol Standards – Greenhouse Gas Protocol Standards
  5. TCFD – Task Force on Climate-Related Financial Disclosures


Disclaimer:

The views provided in this blog are of the author and do not necessarily reflect the views of Vivriti. This article is intended for general information only and does not constitute any legal or other advice or suggestion. This article does not constitute an offer or an invitation to make an offer for any investment.  

US Fed Meeting and Takeaways from other macroeconomic events in September 2023

The US Federal Reserve kept its key interest rates unchanged at 5.25-5.5% in a unanimous decision by the Federal Open Market Committee (FOMC). This happened after the committee took the benchmark rate to a 22-year high at their July meeting with a 25 basis points (bps) hike. The key rate set at the meeting determines what American banks would charge each other for overnight lending but it impacts other forms of consumer debt as well.

While the status quo was on the expected line what was more important is how FOMC would pave the way for future rate hikes. “Tighter credit conditions for households and businesses are likely to weigh on economic activity, hiring, and inflation. The extent of these effects remains uncertain,” FOMC said while adding that it remains “highly attentive to inflation risks”.

The committee tightened its hawkish stance in the meeting indicating a further rate hike (probably a quarter percentage point) by the end of 2023. A total of 12 out of 19 members in the committee believed it to be appropriate while the remaining seven favoured to keep the rates steady. If the hike materializes, the Fed will end up making a dozen rate hikes since the tightening cycle began in March 2022.

For 2024, the Fed indicated more tightening than previously expected. The committee projected the median Federal Funds rate at 5.1% in 2024, which is higher than the June estimate of 4.6%. The committee has further projected rates to dip to 3.9% in 2025 and 2.9% in 2026. This is the first time FOMC provided a rate outlook for 2026. The projected rate for 2026 is higher than the “neutral” rate of interest (which is neither stimulative nor restrictive to growth) of 2.5%.

Apart from providing an outlook on future rate hikes, the FOMC also upgraded its 2023 estimates for economic growth from 1% earlier to 2.1% at the meeting. It further projected a GDP growth of 1.5% in 2024. The unemployment rate is expected to peak at 4.1% in 2023, which is lower than the 4.5% estimated in June.

Other Macroeconomic Events

Global Updates

  • The European Central Bank (ECB) hiked its key interest rate by 25 basis points (for the 10th time in 14 months) to a record 4%, indicating this could be its last rate hike amid the subdued economic activity over January-June. The latest hike is geared towards the target inflation of 2%. Meanwhile, the European Commission sees average inflation settling at 6.5% in 2023 and raised its inflation forecast for 2024 from 3.1% earlier to 3.2%. The commission has revised the growth projection for the Eurozone down by 0.2 percentage points (ppts) to 0.8% for 2023 and 0.3 ppts to 1.4% for 2024 on the back of weaker growth momentum.
  • The Reserve Bank of Australia kept the interest rates unchanged at 4.1% for the third time at the September policy meeting but warned of monetary policy tightening going forward. The central bank stated that recent data were consistent with inflation returning to the target range of 2-3% in late 2025.
  • The Bank of Canada decided to hold its key overnight interest rates at 5% with the Bank Rate at 5.25% and the Deposit rate at 5%. The central bank will continue with quantitative tightening. The CPI inflation in Canada rose to 3.3% in July after softening to 2.8% in June, averaging near the bank’s projection of 3%. However, the bank noted that the “Canadian economy has entered a period of weaker growth, which is needed to relieve price pressures”.
  • The Bank of Japan continued with its ultra-loose monetary policy by keeping the short-term interest rates unchanged at -0.1% and capping the 10-year Japanese government bond yield around zero, both as expected. The decision was based on “extremely high uncertainties” on the domestic and global growth outlook. The Bank of England maintained its key interest rate at 5.25% following 14 consecutive hikes. Britain’s consumer inflation softened to 6.7% in August, which is the lowest level since Feb 2022. The People’s Bank of China also kept its 1-year loan prime rate unchanged at 3.45% while the 5-year benchmark loan rate — the peg for most mortgages — was held at 4.2%. This happened as the economy started showing signs of stabilization following the policy support. Meanwhile, Turkey’s central bank raised its key interest rate by 500 bps to 30% following a series of rate hikes. The country is struggling with years of steepening inflation and depreciating currency. Turkish Lira is down ~30% against the USD year-to-date while its annual inflation jumped to ~59% in August.

Inflation readings 

  • Consumer price inflation in the US accelerated from 3.2% YoY in July to 3.7% YoY in August (against the consensus of 3.6%) due to higher gas prices. However, core inflation, which strips out the effect of volatile food and energy prices, slowed from 4.7% in July to 4.3% in August, the lowest since Sep 2021.
  • Inflation in the Euro Zone remained steady at 5.3% YoY in August compared to the previous month and came in above the consensus of 5.1%. However, core CPI softened to 5.3% in August from 5.5% in July. Energy prices declined at a slower pace (-3.3% in August vs. -6.1% in July) while inflation in food, alcohol, and tobacco was 9.8% in August vs. 10.8% in July; non-energy industrial goods was 4.8% in August vs. 5% in July; services was 5.5% in August vs. 5.6% in July.
  • Inflation in Europe’s largest economy Germany came in at 6.4% YoY in August, preliminary data from the Federal Statistics Office revealed. This compares with a reported inflation of 6.5% in July. Core CPI remained steady at 5.5% YoY in the last month.
  • The consumer price inflation in the UK unexpectedly dropped to 6.7% YoY in August from 6.8% in July against projections of 7% due to a rise in fuel prices and alcohol tax. According to the Office for National Statistics, the drop is led by a fall in hotel prices and airfares, as well as food prices rising by less than the same period last year.
  • Consumer prices in China returned to positive territory in August by rising 0.1% YoY, showing signs of stabilisation in the economy, compared to a 0.3% fall in July. Producer prices data also indicated some recovery as the decline was less intense in August at 3% YoY compared to 5.4% and 4.4% in June and July, respectively.
  • Australia’s consumer price inflation accelerated to 5.2% in August from 4.9% in July due to rising fuel prices and rents. However, the Reserve Bank of Australia board members decided to leave the Official Cash Rate unchanged at 4.10% at the recent meeting.

Other economic indicators

  • Manufacturing activities in the US, UK, and the Eurozone remained in the contractionary zone in August as suggested by the Purchasing Managers’ Index (PMI) survey data. In the US, manufacturing PMI fell from 49 in July to 47.9 in August due to shrinkage in new orders on the back of weaker economic conditions. In the Eurozone, manufacturing PMI rose from 42.7 in July to 43.5 in August but conditions in the sector remained under stress. New orders are falling steeply placing huge pressure on production lines. In the UK, manufacturing PMI declined from 45.3 in July to 43 in August due to weak domestic and export demand. In fact, PMI dipped to the 39-month low during the month. However, manufacturing PMI in China improved from 49.2 in July to the expansionary zone at 51 in August driven by increase in new domestic orders.
  • In the services sector, the US and China remained in the expansionary zone while the activities in the Eurozone and UK showed contraction, as per PMI readings. In the US, services PMI rose from 52.7 in July to 54.5 in August (the highest reading since February). In the Eurozone, services PMI slipped from 50.9 in July to a 30-month low of 47.9 in August. The fall was prominent in countries like Germany (44.6) and France (46). In the UK, the services sector contracted for the first time since January as the PMI declined from 51.5 in July to 49.5 in August due to weak demand. In China, Caixin Services PMI declined from 54.1 in July to 51.8 in August due to sluggishness in sector activity due to weak demand.
  • Real GDP growth in the US slightly decelerated to 2.1% in the second quarter of 2023 from the revised 2.2% in the first quarter of the year. However, the reading came in line with the market expectations. The last reported quarter was marked by growth in business investment, consumer spending, and state and local government spending, partially offset by a decline in exports.


  • The Asian Development Bank (ADB) revised the economic growth projection for developing nations of Asia-Pacific to 4.7% in 2023 from 4.8% previously while the growth forecast for 2024 is kept unchanged at 4.8%. Healthy domestic demand and the reopening of the Chinese economy aided growth in the first half of the year and the impact is expected to continue. However, weakness in China’s real estate sector, higher interest rates globally, supply chain disruptions, export restrictions, and higher risk of droughts and floods caused by El Niño pose a threat to economic growth. ADB has slightly lowered India’s projection from 6.4% to 6.3% for 2023 due to sluggish exports and the negative impact of the erratic rainfall on agriculture output. However, the growth for 2024 is retained at 6.7% as higher private investment and industrial output are expected to drive growth.

 Domestic Updates

  • India’s retail inflation softened to 6.83% YoY in August from a 15-month high of 7.44% YoY in July due to a decline in food prices, mainly vegetables. However, inflation for the month remained above the upper end of the RBI target band (2-6%) for a second consecutive month. Food items, which have ~50% of weightage in the index, saw prices rising by 9.94% in August versus 11.51% in July.
  • The deflation in wholesale prices continued for the fifth consecutive month. In August, the wholesale price index-based inflation rose to a 5-month high of -0.52% from -1.36% in July. Inflation in food items remained in double digits but eased to 10.60% in August from 14.25% in July. The deflation in fuel and power basket declined to -6.03% in August from -12.79% in July.
  • The growth in India’s industrial output accelerated to a 5-month high of 5.7% YoY in July from 3.7% in June. The reading came in above the consensus estimate of 5%. The growth during the month was supported by improvements in all 3 sectors – mining (up 10.7% YoY), manufacturing (up 4.6% YoY), and electricity (up 8% YoY).
  • Retail inflation for Agricultural Labourers (AL) and Rural Labourers (RL) softened marginally to 7.37% YoY and 7.12% YoY, respectively, in August driven by lower fuel prices and a decline in costs of clothing, bedding, and footwear. The major contribution towards the rise in the general index of AL and RL occurred due to food items caused by higher prices of rice, wheat atta, pulses, milk, meat-goat, sugar, gur, chillies-dry, turmeric, garlic, onion, mixed spices, etc.
  • Foreign direct investment (FDI) into India declined 34% to US$10.94 billion during the first quarter (Apr-June) of fiscal 2024. FDI inflow fell from countries including Mauritius, Singapore, the US, and the UAE during the quarter. Maharashtra remained the top destination for FDI, followed by Karnataka, Gujarat, and Delhi.
  • India’s manufacturing sector grew at the fastest pace in 3 months in August driven by a solid rise in new orders and production. This is reflected in the S&P Global Manufacturing PMI survey as the reading increased from 57.7 in July to 58.6 in August, which is the second-biggest rise in about 3 years.
  • The Reserve Bank of India (RBI) announced that it would discontinue the incremental cash reserve ratio (I-CRR) in a phased manner. Introduced in August, I-CRR was meant to absorb the surplus liquidity generated by various factors, including the return of 2,000 rupees notes to the banking system. The central bank mandated banks to maintain an I-CRR of 10% on the rise in their net demand and time liabilities (NDTL) between May 19 and July 28, 2023. The central bank will now release the amount that banks have maintained under I-CRR in stages.
  • JPMorgan Chase will include Indian bonds on its emerging market index, JPM Government Bond Index-EM Global Diversified Index. It will be the first global index provider to include Indian bonds. Effective from Jun 28, 2024, the inclusion will enable foreign fund inflows to the nation’s debt market. The JPM Government Bond Index-EM Global Diversified Index was launched in June 2005 as the first comprehensive global local emerging markets index. It tracks local currency bonds issued by emerging market governments and has assets under management of ~US$213 billion.
  • The growth in India’s GDP was 7.8% (the highest in four quarters) in the first quarter of FY24, which is faster than the 6.1% reported in the previous quarter. The acceleration can be attributed to the contribution of a robust services sector and strong capital expenditure. In particular, the growth is largely attributed to contributions from trade, hotel, transport, communication, and services related to broadcasting along with financial, real estate, and professional services. The economic growth is lower than the RBI projection of 8% for the first quarter. However, street estimates projected a growth of 7.7% in the quarter.
  • S&P Global Ratings retained India’s GDP growth forecast at 6% for FY24 citing global economic slowdown, monsoon risks, and delayed rate hikes. The projection is lower than RBI’s growth forecast of 6.5% for the fiscal year. The global rating agency also forecasted growth of 6.9%, 6.9%, and 7% for FY25, FY26 and FY27, respectively.


Disclaimer:

The details mentioned above are for information purposes only. The information provided is the basis of our understanding of the applicable laws and is not legal, tax, financial advice, or opinion and the same subject to change from time to time without intimation to the reader. The reader should independently seek advice from their lawyers/tax advisors in this regard. All liability with respect to actions taken or not taken based on the contents of this site are hereby expressly disclaimed.
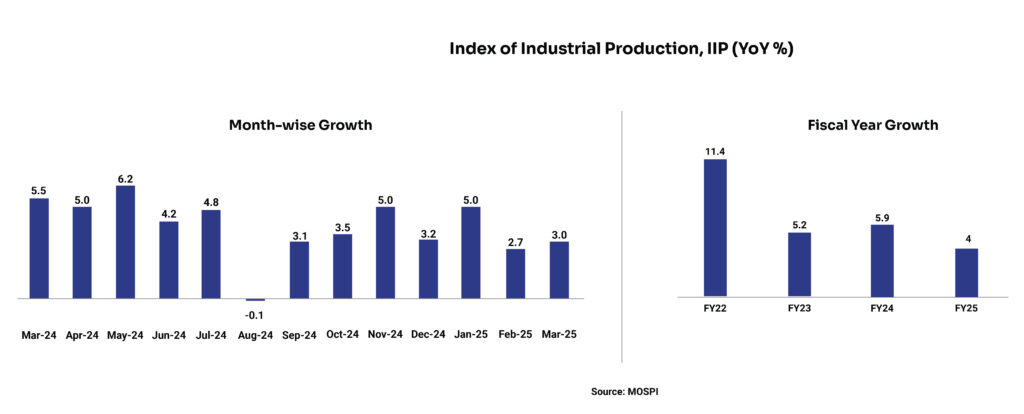
RBI maintains the status quo, MPC decided to remain watchful (A short note)

RBI’s Monetary Policy Committee (MPC) continued with its pause on the hike in repo rate — the rate at which the central bank lends short-term funds to commercial banks — for the third time in a row in a unanimous vote. RBI hit the brake on the rate hike cycle in April this year after six consecutive hikes aggregating 250 basis points (bps) since May 2022.

A majority of five out of six MPC members remained focused on ‘withdrawal of accommodation’ believing the monetary transmission is still in progress which will progressively align the headline inflation with the target (4%) while supporting growth.

Growth Projections

With risks evenly balanced, the central bank retained the projection for GDP growth at 6.5% for FY24 with 8% in the first quarter, 6.5% in the second quarter, 6% in the third quarter, and 5.7% in the terminal quarter of the fiscal year.

The central bank expressed concerns about the global growth scenario due to elevated inflation, high levels of debt, volatile financial conditions, and other factors. However, it believes India can withstand the external headwinds better than many other economies. It has highlighted many factors indicating economic resilience in the domestic economy, some of which include —

  • Sustained growth in air passenger traffic, passenger vehicle sales, and households’ credit.
  • Incipient recovery in rural demand, marked by growth in agricultural credit and higher FMCG sales volume, which could be strengthened by prospects of a better kharif season.
  • Higher capacity utilisation in the manufacturing sector compared to the long-term average.
  • Healthy services sector activity marked by the expansion in e-way bills, toll collections, railway freight, and rise in services purchasing manager’s index (PMI) reading.
  • Strong construction activity in the first quarter as indicated by healthy growth in cement production and steel consumption.
  • Strong momentum in industrial activity as evident from the recent trend in the index of industrial production (IIP). Notably, the growth in IIP in May accelerated to a 3-month-high of 5.2% from 4.5% in April driven by strong growth in the mining and manufacturing sectors.

Inflation projection

RBI revised upward the inflation projections for FY24 by 30 bps to 5.4%. However, in the previous MPC meet, it cut the inflation forecast from 5.2% to 5.1%. The uptick in projection is caused by a recent spike in vegetable prices, especially tomato, along with elevated prices of cereals and pulses.

Quarter-wise, the forecast has been accordingly raised from the earlier level of 5.2% to 6.2% for the Jul-Sep quarter and from 5.4% previously to 5.7% for the Oct-Dec quarter. However, the projection for the fourth quarter of FY24 has been kept intact at 5.2%.

The headline inflation plunged to the 25-month low of 4.25% in May before rising to 4.81% in June due to vegetable prices, which may see a correction soon, as per RBI Governor Shaktikanta Das. However, El Niño weather conditions along with global food prices need to be closely monitored causing the central bank to remain watchful about the risks to price stability.

Incremental CRR

RBI has noted a rise in the level of surplus liquidity in the system due to the return of INR 2,000 currency notes to banks among other factors such as the pickup in government spending and capital inflows, and surplus transfer by RBI to the government.

The central bank is of the view that excess liquidity can pose risks to price and overall financial stability. Hence, it has asked scheduled banks to maintain an incremental cash reserve ratio (I-CRR) of 10% on the increase in net demand and time liabilities (NDTL) between May 19 and July 28 to suck up the surplus liquidity. However, this would be a temporary measure to manage excess liquidity and will be reviewed on September 8 while the existing CRR remains intact at 4.5%.


Disclaimer:

The views provided in this blog are the personal views of the author and do not necessarily reflect the views of Vivriti. This article is intended for general information only and does not constitute any legal or other advice or suggestion. This article does not constitute an offer or an invitation to make an offer for any investment.  

Credit profiles of fertilizer manufacturers to remain stable with easing working capital burden and stable profitability levels

Fertilizer is an essential part of the agriculture value chain and plays a key role in enhancing farm output. India is the second largest consumer of fertilizers globally, after China, with annual consumption of around 63.5 million metric tonnes in fiscal 2023. Given the criticality of the sector to India’s overall agricultural production, the fertilizers industry is closely regulated by the Government and is also highly subsidised with subsidy pay-outs of around INR 2.5 lakh crore in fiscal 2023.

At present there are around 25 different varieties of fertilizers consumed in India which can be broadly categorised into Nitrogenous, Phosphatic, Potassic and Complex fertilizers depending on the nutrient content. Urea (a type of nitrogenous fertilizer) is the most prevalent variety in India, accounting for more than 50% of the overall consumption.

After witnessing decline in FY22, fertilizer consumption in India recovered in FY23 with normal monsoons and increased fertilizer availability with easing of global supply disruptions. Higher subsidy payouts by the Government compensated for the higher input costs. In the current fiscal, consumption is expected to grow by around 1-3% in FY24 amid normal monsoon expectations and stable MRPs provided to farmers. Urea remains the dominant form of fertilizer considering its lower MRP and preference with lower and middle income farmer groups. However, share of non-urea is expected to improve over the long term with government measures and increasing awareness amongst farmers about adverse effects of excess nitrous fertiliser usage on soil fertility.

On the supply side, India is also the third largest producer of fertilizers globally and meets 70% of its own demand through domestic production.

Import dependence is lower for urea at around 20% of consumption, while it is higher for non-urea fertilizers at around 40% of consumption, due to the lack of key raw material availability for some varieties. Key raw materials for fertilizers include natural gas (for Urea), ammonia, rock phosphate, sulphur and phosphoric acid. India does not have significant reserves of rock phosphates or potash, key raw material for phosphatic and potassic fertilizers respectively. Besides, for urea, around 60-70% of the natural gas requirement is met through imported liquified natural gas (LNG). This in turn leads to high import dependence of raw materials for the industry.

Landed costs for raw materials increased sharply in FY22 and H1 FY23 owing to supply constraints following export sanctions on Russia and Belarus, and restrictions by China on exports of fertilizers. For instance, rock phosphate prices more than doubled to around $280 per ton in H1 FY23, compared to around $100 per ton two years earlier. Similar sharp increase was witnessed for other raw materials like ammonia, natural gas, sulphur as well.

However, the input prices have started correcting from H2 FY23 onward with easing global supply scenario and are expected to reduce further towards the long term average levels in the near to medium term.

India’s urea capacity is around 29 million tonnes and non-urea capacity is around 20 million tonnes, with average capacity utilization of around 90%. Except for revival of few closed units (predominantly Urea producers), no major greenfield or brownfield capacities are expected to come onstream in the medium term, and hence existing capacities are expected to operate at high utilization levels to meet fertilizer demand.

In this context, for domestic fertilizer manufacturers, while demand and volume expectations remain steady, falling raw material prices and lower subsidy rates are expected to lead to lower revenues in the current fiscal. Profitability margins however are expected to remain rangebound as volatility in raw material prices are largely absorbed through subsidies, providing protection to manufacturer margins.

  • On urea side, subsidy contributes around 90% of realization and subsidy rates are directly linked to underlying raw material (pooled gas prices) enabling complete pass through.
  • On non-urea side, subsidy contribution is relatively lower at around 50-60% of realization and is determined by the nutrient based subsidy (NBS) rates fixed by the Government periodically. The Government has been proactive in adjusting NBS rates in the past in line with movement in underlying raw material (ammonia, rock phosphates) prices thereby protecting the margins of manufacturers.

Working capital build up has been a key monitorable for the industry due to the high dependence on Government subsidies. Subsidy arrears for fertilizer manufactures had been elevated till fiscal 2020 owing to delays in subsidy receipts from Government. However, the same has substantially reduced in the last 3 years following the one-time additional subsidy of Rs 65,000 crores rolled out by the Government in fiscal 2021 under Aatmanirbhar 3.0 package.

Going forward, we don’t expect similar build up in arrears as seen prior to 2021, considering sufficient budgetary allocation for fertilizers and softening prices in turn reducing the subsidy burden for the Government. Further, the Government has also implemented the Direct Benefit Transfer (DBT) scheme) ensuring faster transmission of subsidies to the manufacturers.

With stable margins and subsidy receivables being under control, credit profiles of manufacturers are expected to remain healthy and should enable their access to financing from both banks and capital market investors.

Disclaimer:

The views provided in this blog are of the author and do not necessarily reflect the views of Vivriti. This article is intended for general information only and does not constitute any legal or other advice or suggestion. This article does not constitute an offer or an invitation to make an offer for any investment.  

Why mid-market enterprises explore the AIF route for capital raising

The credit landscape in India has increasingly turned congenial towards growth in private credit. In 2022, private credit transactions in the country stood at over US$5 billion (excluding venture debt, debt funding in financial services players and offshore bond raises), as per a report by Ernst & Young.

In the overall private credit space, global funds, which constituted nearly 60% of the transactions by value, preferred the Alternative Investment Fund (AIF)/Foreign Portfolio Investment (FPI) route for investments whereas domestic funds, constituting over 30% of the transactions, preferred using only the AIF route. On an aggregate basis, the share of investment routes in the private credit market was dominated by AIFs in 2022 as shown below:

In 2022, the deal value for AIFs in the private credit space stood at US$2.3 billion (INR 18,000 crore+).

But what are the catalysts for the growth of AIFs in the private credit space in India? The factors are both supply and demand sides.

Supply and demand factors for growth in AIFs in the private credit space

On the supply side, the banking sector became increasingly risk averse over the years towards the mid-corporate space and focusing more on large corporates or enterprises with AAA or AA rated issuers. When it comes to non-banking finance companies (NBFCs), the growth in wholesale lending has remained flat in the recent past (FY20 to FY22). Additionally, mutual funds have started aligning their portfolio increasingly to the debt papers of large corporates with higher credit rating profiles after several restrictions placed by the market regulator Securities and Exchange Board of India (SEBI) in 2020.

Further, after the Franklin Templeton crisis in 2020, assets under management (AUM) of Credit Risk Funds (CRFs) has been declining due to increasing redemption by retail investors. This coupled with higher preference for higher rated issuers by CRFs led to lesser availability of funds for lower rated papers.

On the demand side, there are huge requirements for growth capital by mid-market corporates or entities with below AA or no credit rating as they need to scale up their businesses increasingly. India is on a high growth path, and mid-market corporates have been contributing heavily to the economy. As per government data, micro, small, and medium enterprises (MSMEs) in India contribute over 30% to the country’s GDP and have a share of 40-50% in all Indian exports. However, there are hardly any takers for unrated or below AA-rated debt creating a significant credit gap for the segment in the market. This happens even though on average, 90%+ of these corporations in the rating bracket of A+ to investment grade are profitable.

Due to these factors, AIFs have been increasingly catering to the mid-market space with strategies of Performing Credits, Special Situations, and, or Distressed Credit. According to industry experts, Performing Credits is the space where a sizeable amount of fresh AIF flows is getting deployed.

What is Performing Credit?

The Performing Credit space is defined as the space where the borrowing entities are profitable and are operating companies with visible cashflows; proven and stable business models; over 3 years of vintage; and a revenue range of INR 300 to 4000 crores. These are mid-market enterprises that are typically rated in the investment grade universe, going up to AA-. Forming the essential middle range of entities that ensure a robust economy, these entities are predominantly well discovered by the banking system.

In the risk-return spectrum, the Performing Credit space depicts the white space between the low yield, high-rated space occupied by debt mutual funds and high-risk space favored by special situation, distressed, and venture debt funds. This space typically yields 8 – 16% gross returns and offers superior risk-adjusted returns.

Considering the life-cycle stages of a corporation, entities in the performing credit space are typically in the growth stage, as opposed to early-stage entities preferred by venture debt firms or mature and late-stage companies that find themselves in distress or need situational funding.

However, despite having stable financials and banking lines of credit, these mid-market enterprises in the Performing Credits face a significant credit gap that is being mitigated by a few AIFs typically following a strong philosophy of investing in the space. These entities are increasingly being served by such AIFs due to the following reasons —

  • Limitations of banking lines of credit: Although banking lines of credit are available to these entities, there will be limitations due to internal policies of the bank. For example, product development in a software-oriented entity will not be treated as capital expenditure like it would be in a manufacturing firm, hence, a bank may refuse to fund the same. Moreover, banks tend to have rigid underlying templates, say, a checklist with requirements that may not be relevant to a business. The inability to meet any of the criteria like these set by the bank would lead to the rejection of loans applied by the mid-market corporates. However, AIFs will be open to take flexible securities which banks may avoid. For example, a fund may lend to an operating company basis the collateral provided at the holding company level or the fund will allow a second charge on working capital cash flow.
  • Flexible repayment schedules: Banks generally offer ‘cookie-cutter’ type of products to entities. There is insistence on an EMI structure irrespective of how the underlying cash flow of the business appears. For example, a SaaS entity may be borrowing to hire senior management personnel. In such a case, they would prefer a moratorium period before they start repaying capital. An AIF is able to offer this moratorium due to its ability to structure flexible deals.
  • Access to capital market: The companies seek out non-bank funding through issuances of instruments such as bonds to get access to the capital markets. The preference for capital markets stems from flexibility in raising capital, better price discovery, and diversification of resource profiles. This is why mature entities prefer capital markets.

If we look at the ratio of the bond market to bank loans over the last decade, we see A and BBB rated entities are disproportionately reliant on loan markets compared to higher-rated entities, creating an asymmetry in the market.

The entities in the Performing Credit space, to whom banks generally offer Term Loans, are able to issue bonds via AIFs. Often, and especially for corporates, an issuance for a fund may be the entity’s maiden capital market issuance and rating exercise. The fund may also be able to provide guidance in navigating the nuances of capital market issuance.

It is now clear why AIFs could be a preferred route of capital raising for mid-market enterprises. In fact, AIFs present a win-win situation for both the portfolio entities and the investors. There are a number of factors due to which investors benefits from investing in Performing Credits via a pooled investment vehicle like AIF as discussed below:

  • Correlation to the economy: The risk-return spectrum in an AIF portfolio has a low correlation to the economy and public markets. Investors can take exposure to several sectors with low or minimal correlation and several entities within the sector by investing through a pooled fund.
  • Identification of right assets: Given that entities in the performing credit space are unlisted, they may have low levels of public exposure. For an investor to hold such entities in their portfolio, they would need to actively diligence these entities with a customized framework for each entity. However, fund managers are better placed to do the same through careful selection and ongoing monitoring along with ecosystem checks (other lenders, equity holders, customers, merchants, rating agencies, etc.). Further, by regular monitoring of investments, the fund managers are able to identify early warning signals and can take appropriate remedies.
  • Exit mechanism through regular monitoring: By having regular monitoring of investments, the asset managers are well-placed to identify early warning signals and take appropriate remedies.
  • Deal structuring: The ability to negotiate the right covenant, right ticket size, tenor of the investment, principal amortization structure, etc. requires a deep understanding of the portfolio entities, and modelling of cashflows under normal and stress scenarios is best left for an experienced asset manager.
  • Diversification: Losses can be averted or minimized through diversification and granularity at the portfolio level. Investing through a pooled fund ensures that the investor simultaneously has exposure to multiple entities and sectors, thereby limiting the risk of an unforeseen event.


Disclaimer:

The views provided in this blog are of the author and do not necessarily reflect the views of Vivriti. This article is intended for general information only and does not constitute any legal or other advice or suggestion. This article does not constitute an offer or an invitation to make an offer for any investment.  

El Nino impact on Indian Economy

What is El Nino?

El Nino is a climatic condition which results in warming of surface water in the equatorial Pacific Ocean suppressing monsoon rainfall in India. It impacts monsoons and consequently agricultural output, which in turn bears on inflation and economy.

Under normal conditions over Pacific Ocean, trade winds blow west along the equator, taking warm water from South America towards southeast Asia. This phenomenon brings monsoon to India between June to September. During El Nino periods, there is unusual warming of surface waters in the east tropical Pacific Ocean, and hence trade winds blow in the opposite direction. This phenomenon reduces rainfall in India and increases rainfall in South America. Depending upon its intensity El-Nino could cause below-normal monsoon or even draught in India and other southern eastern countries such as Indonesia and Australia.

High probability of El Nino this year

After 4 years of normal monsoon, India is staring at below-normal monsoon this year. In the case of India, the occurrence of El Nino is linked with the poor monsoon implying below normal or deficient rainfall during the June-September period.

As per the latest monthly update by National Oceanic and Atmospheric Administration (NOAA, a US based agency) issued in May 2023, there is 90% probability of occurrence of El Nino between June and August, and more than 90% probability of occurrence between July and September, which is the peak period of Indian monsoon. Arrival of El Nino after September is not expected to impact India’s monsoon.

Favourable effect of Indian Ocean Dipole can offset the impact of El-Nino to some extent

IOD refers to the difference in temperature between western pole of Arabian sea and eastern pole of eastern Indian ocean south of Indonesia.

Indian Meteorological Department (IMD) has predicted normal monsoon for the current year, and that positive Indian Ocean Dipole (IOD) could offset impact of El Nino and result in favourable monsoon. IOD is currently neutral, and index value for the week ending 20th June 2023 was 0.0°C, which is within neutral bounds (between -0.40°C and +0.40°C). As per Australian Bureau of Metrology, there is high probability of the IOD to increase above +1.2°C between July and September.

The impact of phenomenon on southwest monsoon

We have had 21 El Nino years and 15 draughts over the last 50 years in India. 10 of the 15 draughts where during the El Nino years. Historically during strong or moderate El Nino years, rainfall reduced up to 24% and average deviation in rainfall was around 15%.

Past data also show that during some El Nino years, rainfall was normal owing to favourable offsetting factors. For example, despite 1994, 1997 and 2006 being El Nino years, India received normal or even excess rainfall as IOD was positive. In 1969, 1976, and 1977, India received normal rainfall either because the intensity of El Nino was weak, or its arrival was towards the end of India’s monsoon season.

El Nino impact on Inflation during the last two decades

Over the last two decades there have been instances of spike in inflation traced to intensity of El-Nino in that or the previous year. For instance, during 2002-03, 2009-10 and during 2015-16 where El-Nino intensity was moderate or strong, WPI inflation during the subsequent year increased. Adequate stock of food grains maintained by FCI softened the impact on inflation in some of those years.

Possible Impact on Indian Economy in FY24

India is currently battling to tame inflation, rekindle rural demand, and maintain consumption growth, amidst adverse weather conditions (heat waves) and global slowdown.  Currently, agriculture contributes 18% to India’s GVA (gross value add) and 47% of work force is employed under agriculture sector. More than 50% of net sowed land in India depends on monsoon rain, which also replenish water reservoirs, and hence bears heavily on farm production. Below-normal monsoon could impact farm production, commodity prices and dent rural demand, which could in turn spill over to sectors such as FMCGs, Automobiles (2W, 3W and tractor), cement, and agro chemicals.

Additionally, should Australia (key exporter of wheat) and Indonesia (key producer of rice and exporter of palm oil) be adversely impacted by El Nino, food prices in international markets could rise, also posing upside risk to inflation in India.

Over the years however, there has been diversification in rural economy away from agriculture. According to Niti Aayog report, 2/3rd of rural income is contributed by non-agricultural sectors such as manufacturing, construction, and services. Government’s spending on infrastructure also adds to non-farm income. These factors could offset the impact of El Nino on rural demography.

As per Food Corporation of India (FCI), wheat stock as of June 2023 was around 31.3 MMT (2022: 28.5 MMT) and rice was 26.2 MMT (2022: 31.7 MMT), well above buffer levels. This should help in case of shortage of rainfall and consequent lower-than-expected production. Government could also ban export of key food grains to curtail inflation

Conclusion

While El-Nino is likely, its impact hinges upon several factors such as its timing and intensity, and that of IOD during the next three months. Given the dependence of agricultural produce on monsoon, below-normal rains could pose upside threat to inflation and dampening of rural demand. This could partially be offset by diversification of rural income and Government’s steps to curb food prices.

Disclaimer:

The views provided in this blog are of the author and do not necessarily reflect the views of Vivriti. This article is intended for general information only and does not constitute any legal or other advice or suggestion. This article does not constitute an offer or an invitation to make an offer for any investment.  

RBI MPC announces the second consecutive pause in rate hikes, what’s next? (A short note)

In a unanimous vote, RBI’s Monetary Policy Committee (MPC) hit the pause button for the second consecutive time in raising the repo rate — the rate at which the central bank lends short-term funds to commercial banks. While doing so, RBI retained the policy stance as “withdrawal of accommodation”, implying it could consider further hike rates if necessary.

The two consecutive pauses occurred after RBI MPC hiked the repo rate for the sixth time in a row this February. Since May 2022, RBI hiked repo rates by 250 basis points (bps). In FY23, the rate hiking cycle began with a 40 bps hike followed by three consecutive hikes of 50 bps and then with 35 bps in Dec 2022 and 25 bps in Feb 2023.

Factors influencing future policy decisions

Inflation

Retail inflation is one of the key factors that kickstarted the rate hike cycle in May last year. A month before that, in April, the inflation based on the Consumers Price Index (CPI) peaked to a near 8-year high of 7.79% due to supply chain disruptions caused by geopolitical tensions, and soaring crude and food prices. The chain of aggressive rate hikes by RBI began to restore the inflation levels to the central bank target range of 4 +/- 2%.

This April, retail inflation softened to an 18-month low of 4.7% YoY and remained within the tolerance band of RBI for the second consecutive month. Food inflation cooled off to 3.84% in April from 4.79% in March. The producers’ price inflation based on Wholesale Price Index (WPI) fell to a negative territory hitting a 34-month low of -0.92% YoY in the month.

Since the rate hike cycle began, crude oil prices fell from their peak of ~US123/bbl in Jun 2022 to ~US$76/bbl on Jun 8. In the same timeframe, the benchmark 10-year yield, an indicator of future expectation of interest rates, dropped from its peak of ~7.6% in mid-Jun 2022 to ~7.0% on Jun 8.

RBI MPC has cut its projection for inflation for FY24 from 5.2% to 5.1%. It includes a forecast of 4.6% for the first quarter, 5.2% for the second quarter, 5.4% for the third quarter, and 5.2% for the fourth quarter.

While the tamed inflation forecast may indicate a longer pause, RBI Governor Shaktikanta Das said that “Our goal is to achieve the inflation target of 4%, and keeping inflation within the comfort band of 2-6% is not enough.” The chances of inflation falling below 4% may not happen in the near term, however, the prediction of a favourable monsoon and stronger GDP growth bodes well for the pause scenario.

Monsoon, GDP growth, and other tailwinds

The Indian Meteorological Department recently predicted a “normal” monsoon for this year at the long period average (LPA) of 96% despite the higher probability of El Nino, a climate condition pattern that describes the unusual warming of surface waters in the eastern tropical Pacific Ocean. However, IMD revealed that most parts of India will witness deficient rainfall in June, except for some areas in peninsular regions.

India’s GDP (at constant 2011-12 prices) grew at a faster rate of 6.1% YoY (higher than estimates) in Q4FY23 compared with 4.5% YoY in the previous quarter. Given this pace, the annual growth came in at 7.2% YoY driven mainly by improvements in agriculture, manufacturing, mining, and construction sectors.

RBI has projected a growth of 6.5% in real GDP for FY24. It was the same forecast the central bank made in the April meeting when it was revised upwards from 6.4%. Throughout the fiscal year, the growth is distributed as 8% for the first quarter, 6.5% for the second quarter, 6% for the third quarter, and 5.7% for the fourth quarter.

As per Shaktikanta Das, “Domestic demand conditions remain supportive of growth. Urban demand remains resilient, with indicators such as passenger vehicle sales, domestic air passenger traffic, and credit cards outstanding posting double-digit expansion on a year-on-year basis in April. Rural demand is also on a revival path – motorcycle and three-wheeler sales increased at a robust pace in April, while tractor sales remained subdued.”

Further, healthy economic indicators like strong growth in GST collections (up 12% YoY to INR 1.57 lakh crores in May, following a record-high GST collection of INR 1.87 lakh crores in April) and encouraging PMI reading (hit the 31-month high of 58.7 in May and remained above the 50-mark for 22 consecutive months) certainly indicates resilience in the domestic economy.

Lastly, the movement of the US Federal Reserve is something to look out for as it sets the sentiment of a rate hike across the globe. Last month, US Fed raised the key short-term interest rates by 25 bps to a range of 5-5.25%, pushing borrowing costs to their highest level since August 2007. However, market experts believe that the Fed is expected to leave interest rates alone in the upcoming meeting next week. As per CME FedWatch Tool, Fed futures are reflecting a ~76% probability of a pause and ~24% probability of a 25 bps hike in the Jun 14 meeting at the time of writing.


Disclaimer:

The views provided in this blog are the personal views of the author and do not necessarily reflect the views of Vivriti. This article is intended for general information only and does not constitute any legal or other advice or suggestion. This article does not constitute an offer or an invitation to make an offer for any investment.  

Road asset monetization/ refinancing requirements to see a spurt in the near term

Road assets account for ~27% of national monetisation pipeline (NMP) drafted by NITI Aayog. Under NMP, 26,700 km of road assets valued at INR 1.6 lakh crore were to be monetised over a 4 year period (FY22-FY25). Till Mar’23, only ~14% (by value) of the targeted assets have been monetised, as against plan of ~39%, owing to muted interest from private sector for some of the stretches considering high traffic and toll collection risks to be taken by the buyers. Hence NHAI is expected to significantly ramp up efforts in the coming 2 years to meet NMP target.

Monetising more assets is critical from NHAI’s perspective as well, to contain leverage:

With spurt in new project awards through Hybrid Annuity Model (HAM) and Engineering, Procurement and Construction (EPC) routes in last 5 years, which require 40-100% of the project funding to be borne by NHAI, it’s borrowing has risen to over INR 3.4 lakh crore as of Dec’22, as against INR 1.8 lakh crore 3 years ago. NHAI’s funding requirement will only increase in the coming years, with expected roll out of more road projects under Bharatmala Pariyojana and other schemes. Hence monetisation of operational assets will be critical for NHAI to contain leverage.

NHAI has been trying TOT and InvIT routes to monetise operational road projects, however, response has been mixed:

In last 3 years, NHAI has been able to monetise assets through (Toll Operate Transfer (TOT) and InvIT routes – 22 stretches monetised through TOT (aggregate length of 1,612 km) and 8 stretches monetised through InvIT (aggregate length of 632 km). However, bidding intensity for the assets remain relatively weak owing to high operational risks that private contractors need to take on, pertaining to traffic movement, toll collection efficiency, O&M, etc. Hence only assets which have good vintage of toll collections and low traffic risk have found bidders, albeit the bid premiums over the base concession values for such assets have been high.

With only 15% of the NMP targets achieved in the last 2 years, the pace of monetisation is expected to increase in the next two years. For FY24, NHAI has already identified a pipeline of 46 assets with aggregate length of 2,612 km, which is more than the combined length of stretches monetised in last 2 years. Besides, around 80 under-construction projects are expected to achieve commercial operations date (COD) in next 2 years, which will in turn become ideal candidates for monetisation.

Traffic risks to remain a deterrent for private participation, hybrid structures can be explored:

While the pipeline of projects to be monetised remains strong, many of the stretches will remain exposed to the high operational risks. Under the current model, entirety of the traffic and toll collection risks are passed on to the private concessionaires which has resulted in dwindling interest for some of the riskier assets. Hybrid structures, where part of the traffic risk is borne by the authorities and assured minimum annualised payments are made to concessionaires, could alleviate some of the challenges with the existing TOT model.

Expectations for capital providers and developers:

Successful monetisation of projects by NHAI will directly benefit road developers, as NHAI would be able to award more projects for implementation. Besides, with lower leverage, NHAI could award more projects through the HAM or EPC routes, which would reduce the project financing burden on the contractors, as compared to BOT route. Furthermore, monetisation by NHAI could also have knock-on effects for capital providers as project debt refinancing opportunities will emerge, especially if the assets are picked up by strong sponsors.

To summarise, VAM expects a spurt in the road assets monetisation by NHAI in the next 2 years in order to meet NMP targets of the Government. Finding suitable assets for monetisation is not expected to be a challenge for NHAI, given the substantial number of projects which were recently constructed, or are in advanced stages of completion. Faster pace of monetisation would help NHAI control leverage on its balance sheet, and thereby enable awarding of more projects through HAM / EPC route in future. Having said that, traffic risk has to be adequately distributed or compensated in order to encourage higher private participation.

Disclaimer:

The views provided in this blog are of the author and do not necessarily reflect the views of Vivriti. This article is intended for general information only and does not constitute any legal or other advice or suggestion. This article does not constitute an offer or an invitation to make an offer for any investment.  

India’s Healthcare Sector: Opportunities and the Need for Alternative Financing

The public and private spending on healthcare delivery around the world have been rising rapidly keeping pace with the growth in economies. The working pattern of the global population has turned more sedentary especially after the pandemic. This is giving rise to the incidence of more lifestyle-led chronic diseases causing an accelerated growth in demand for healthcare services.

In India, healthcare is one of the largest sectors when it comes to contribution to the nation’s employment and revenues. As of 2021, it employed roughly 50 lakh people. The size of the healthcare market is expected to have surpassed from merely ~US$70 billion in 2012 to ~$US370 billion by 2022, suggesting a CAGR of ~16% (Statista).

The domestic healthcare delivery market can be divided into four broader segments, as shown below:–

The hospital industry expects to grow at a CAGR of 15-20% to over $130 billion by 2023. Diagnostics on the other hand, which is valued at ~$4bn (the share of the organised sector is just around a quarter of the total value) in the healthcare sector, is expected to witness secular growth at a CAGR of over 20% to $30-40 billion in the same time frame.

Opportunities

India’s demographic factors present huge opportunities in the healthcare sector. Firstly, the life expectancy of India’s population has been increasing. As per United Nations estimates, life expectancy in the country has increased from 35.21 years in 1950 to 70.4 years in 2023. It is projected to increase to ~82 years by 2100. Secondly, the rise in aging population. The share of senior citizens in India’s population is expected to double to 16% over 2011-2041 (PwC India, 2020) while the total number of senior citizens is estimated to be 30 crores by 2050 (Invest India).

Thirdly, the rising income expect to result in a shift of 7 crores+ households into the middle-class section of society by 2031 leading to growing awareness for preventive healthcare. It is estimated that 8% of Indians will earn more than US$ 12,000 per annum by 2026 (Invest India, KPMG, and FICCI, 2021).

These apart, accessibility to services due to growing penetration of health insurance, higher incidence of lifestyle diseases caused by factors including obesity, poor diet, high blood pressure, and cholesterol, etc. in urban areas, and accelerated adoption of digital technologies, including telemedicine, in the post-Covid world are expected to boost the demand for healthcare.

The demand for healthcare facilities has been rising at a faster rate in Tier 2 and Tier 3 cities due to the rapid increase in per-capita income in these regions. This led many private hospital operators to foray into areas in Tier 2 and Tier 3 locations that are farther away from metropolitan cities. As per Invest India, investment opportunities in India’s country’s hospital/medical infrastructure sub-sector are pegged at over US$32 billion. Production-linked Incentive (PLI) schemes announced by the govt and a flurry of investment avenues in contract manufacturing, over-the-counter drugs, and vaccines also boosted opportunities in the domestic manufacturing of pharmaceuticals.

The centre has allowed up to 100% Foreign Direct Investment (FDI) under the automatic route (which means the non-resident investor or Indian company can invest without prior approval from the govt or RBI) in the hospital sector and in the manufacture of medical devices.

Beds and doctors’ availability

India still faces systematic issues in terms of infrastructure and resources. Significant gaps exist between the number of beds available and the beds required. The country’s hospital bed density is much lower than the global average as depicted below while there is a shortage of skilled professionals in the sector, including doctors, nurses, paramedics, etc.

Structural Issues for private hospital operators

The credit profile of private hospital operators in India is expected to remain strong going ahead given the potential for higher revenue growth, better operational efficiency, and other factors like capacity additions. The operators are solving the structural issues as discussed below.

Occupancy rate

The bed occupancy rate (BOR) is the ratio of the number of inpatient bed days added annually to the number of functional beds. A high BOR is crucial to optimize revenue for the hospital operator. On the other end, a high OR reflects an operator’s quality of patient care, infrastructure, and level of staff training, hence, it is used to assess the performance of hospitals.

As per the 2012 guidelines of Indian Public Health Standards (IPHS), the BOR should ideally be at least 80% while a BOR of below 42% is considered very low and a BOR of 100% is not desirable as spare bed capacity should be there to accommodate variations in demand. The lack of beds causes delays in emergency departments and puts patients in clinically inappropriate wards which increases the chance of hospital-acquired infections. As per a 2021 study by NITI Aayog of district hospitals, the national average of BOR is 66% and most large hospitals are operating in the BOR range of 65-70%.

Out-of-pocket expenditures

Most of the private hospital operators in India are generating the majority portions of their revenue from out-of-pocket (OOP) payments by patients. In India, the share of OOP expenditure in total healthcare expenses stands at above 60%, which is one of the highest in the world and much higher than the global average of ~20%.

The main reasons for higher OOP in India are limited govt expenditures on healthcare and lower penetration of health insurance. It is also evident from the structure of payment modes witnessed in the Indian healthcare system as depicted below:–

It has been estimated that over 60% of the population in India pays for healthcare services in OOP mode. The ratio is less than 20% for major economies like the US, and the UK, and up to 35% for emerging economies like Brazil and China. This is because 60-70% of the Indian population is out of insurance coverage, both private and govt schemes.

As per the annual report of a private hospital operator, the bill amount sent to private and public insurance companies for inpatient services vary based on the kind of services and negotiations with each company. The amount charged to public sector companies generally comes at a discount compared to the amount paid by OOP patients.

ALOS and ARPOB

These are two key monitorable to measure the operational efficiency of hospital operators. ALOS refers to the average no. of days a patient stays in a hospital and ARPOB indicates the daily revenue that can be generated by an occupied bed for a hospital. A highly efficient operator’s target is to reduce ALOS, which helps in increasing its ARPOB to ensure that more patients get treatment at the same time.

In the above chart, average ALOS is seen improving from Q2FY22 after rising during Covid with hospitals focusing on faster turnaround and higher utilisations.

The above chart shows ARPOB on an increasing trajectory on a sequential basis. This is expected to sustain as price hikes taken by hospitals to take effect in near term.

Inpatient and Outpatient mix

Hospital operators generate ~70% of their revenue from inpatient departments and the rest 30% from outpatient departments in terms of value. However, the ratio varies across operators depending on the type of healthcare services they provide, and the ailments being treated. However, in terms of volume, outpatient departments account for ~75% of the total. Hence, a balanced inpatient and outpatient mix is essential for higher revenue and profitability of the operator.

The financing gap and the need for alternate financing

The public spending on healthcare has only been ~2% of India’s Gross Domestic Product (GDP) even three years after the outbreak of Covid-19 while the aim is to raise the share up to 2.5% of GDP by 2025. In the last Union Budget, the healthcare budget has been marginally raised from the FY23 estimate of ~INR 86,000 crores to ~INR 89,000 crores for FY24. It is also to be noted that about only 10% of hospitals in the country are public and the rest are private. (KPMG, Oct 2021)

While the healthcare expenditure ratio in terms of GDP is one of the lowest globally, the gap left by limited public financing is somewhat filled by the private sector, which makes up ~65% of the healthcare expenditure in the country. However, given the marked under-penetration in healthcare services, the sector needs a significant ramp-up in private financing not only due to the overall funding needs but also due to the underlying asymmetries in financing caused by a fragmented market.

Market fragmentation occurs because large hospital chains comprise 10-15% of the industry while the rest is controlled by small and medium doctor-run hospitals. Despite accounting for the lion’s share in the industry, the hospital operators in the mid-market space lack the right access to funding. There is no appetite from banks for funding these mid-market operators located beyond Tier 1 metros and in the districts of Tier 2/3 regions due to poor accessibility and lack of knowledge about their business models and financials.

As per S Ganesh Prasad, Founder, MD & CEO of Bengaluru-based GenWorks Health, a provider of digital solutions in the hospital and health care space, Covid has significantly improved the balance sheet and has left liquidity for healthcare providers. There is a guarded optimism and a compelling need to invest in healthcare delivery. Innovative debt / Structured funding options will play a significant role in fast tracking growth investments. Public private partnerships that cover for viability gap funding can help private players to contribute significantly to set up treatment infrastructure, said Mr. Prasad.

Large hospital chains operating in Tier 2 and 3 locations are adding capacity at a significant rate. In the last four years, major hospital chains added ~70% of their incremental supply in such locations. Government assistance in the form of 40% viability gap funding under Ayushman Bharat Pradhan Mantri Jan Arogya Yojana (PMJAY) also aided expansion to these regions. Apart from PMJAY, there are three main government schemes that hospitals cover – The Central Government Health Scheme (CGHS), Ex-Serviceman Contributory Health Scheme (ECHS), and the Employee State Insurance (ESI).

Despite the presence of Govt schemes, the delay in receivables from such schemes increases the need for working capital financing, mainly for mid-market players. Notably, the average delay in payments from Govt schemes is 4 to 6 months, with the trend has worsened in the last 3-4 years. Operations of large hospitals in tier 2 and 3 cities account for 10-20% of their balance sheet, hence, they do not get impacted. However, mid-market operators face a credit crunch to scale up their business as banks do not finance them (for issues like the inability to get invoices less than six months old). Hence, they need alternate sources of financing in the form of debt or equity.


Disclaimer:

The views provided in this blog are of the author and do not necessarily reflect the views of Vivriti. This article is intended for general information only and does not constitute any legal or other advice or suggestion. This article does not constitute an offer or an invitation to make an offer for any investment.  

A Note on the recent SEBI Consultation Papers for Alternative Investment Funds (AIFs)

On Feb 3, 2022, the Securities and Exchange Board of India (SEBI) came up with five consultation papers proposing changes in regulatory norms for AIFs.

SEBI releases consultation papers on regulatory norms from time to time on different aspects of the capital market to seek inputs/ suggestions from all stakeholders on their proposals.

The consultation papers released by the capital market regulator reflect its continued focus and interest in developing AIFs. The recent papers suggesting the next generation of reforms for AIFs are aimed at bringing fairness and transparency to investors. Notably, Vivriti Asset Management is already much ahead in the game with respect to the below mentioned tenets in the consultation papers.

We have briefly captured our understanding of the impact if the proposals in the papers are implemented:

1. Transparency

a)Investor participation via ‘direct plan’ and payment of distributor commission on a trail basis

The recent papers seeking feedback from industry participants include a two-fold objective in the proposal

  • AIFs to offer the option of a direct plan to its investors and
  • Creating trail model for distributor commissions in AIFs.

Similar practices have already been implemented in the mutual fund industry and which has received positive feedback from both investors and the mutual fund community. Mutual funds offer both regular plans and direct plans. In the case of a regular plan, the investor invests via an intermediary and has to bear a higher expense ratio than if he would have directly invested in the schemes due to the additional fee charged by the intermediary. The direct plan entails no distribution or placement fee.

With the release of this consultation paper, it has become apparent that the regulator is seeking changes in line with the mutual fund industry to allow for more transparency in the operations of AIFs. Offering participation in AIFs through direct plans will not only attract more investors but will also help the distributors in the long term by adopting the trail model of commissions that SEBI has proposed.

In the mutual fund industry, Trail Commissions are calculated as a percentage of distributors’ assets under the management. It is generally calculated on a daily basis and paid every quarter. As these are calculated on net assets, distributors gain from the rise in their assets due to higher NAV of funds or the sale of more units. An investor doesn’t need to worry about trail commissions because these are factored into the expense ratio explicitly stated by the funds.

Vivriti Asset Management has adopted the practice of offering direct plans of its schemes with the launch of its Short-Term Bond Fund way back in 2021.

SEBI’s proposal to pay 1/3rd of the (present value of) distribution fee upfront (acknowledging the need for some reasonable incentives) and the rest 2/3rd on trail basis is expected to benefit the industry on a medium to long-term perspective. The proposal is expected to significantly reduce the chances of mis-selling AIF schemes and bring transparency to investors.

b) Conflict of interest

AIFs are allowed to deal with their associates for investing in associates, buying/selling securities to/from, availing services of them, etc. However, such related party transactions could give rise to conflicts of interest. While current regulations already have provisions to address such conflicts of interest, SEBI in the consultation paper has proposed specifically that AIFs cannot undertake such related party transactions without the approval of 75% of investors, calculated by the value of their investment in the AIF, in (a) associates; or (b) units of AIFs managed or sponsored by its Manager, Sponsor or associates of its Manager or Sponsor.

We appreciate the move since the existing industry and regulatory issues around related party transactions will be resolved. The larger point of this proposal is to ensure that investors are not left in a state of oblivion by the asset manager for any investments in bad assets of the associates. We as an asset manager are one step ahead in this regard as we take the consent of our independent board of directors for any such transactions to maintain transparency in our dealing with associates.

2. Transferability – Dematerialisation of units

SEBI noted that despite the regulation of issuance of AIF units in place, most of the AIF scheme units are not yet dematerialised and are held in physical form. Henceforth, the market regulator has proposed that dematerialisation of units of AIFs shall be made mandatory wherein all schemes of AIFs with a corpus of more than INR 500 crores shall compulsorily dematerialise their units by April 1, 2024.

Vivriti Asset Management has always advocated the need for dematerialisation of AIF units in order to create ease in transferability. In a recent note published in Economic Times, we stressed the development of a secondary market for AIF via the listing of fund units. This is essential to ensure liquidity in the AIF industry.

We are already in the process of getting approval for listing units of two of our AIF schemes. In fact, we as an asset manager have facilitated the secondary transfer of AIF units. In the investor contribution agreement, it is stated that the investor can transfer the scheme units to another party with the consent of the investment manager, who needs to know the KYC details of the transferee and the status of the same as a “Qualified Contributor”.

The marketability of any instrument is severely impacted if the instrument is maintained in a physical form. Therefore, it is a crucial step that can promote AIF products and create accessibility to the larger market. It will also enable adequate monitoring of investments in AIFs by investors as they would get higher visibility of cash flow and returns making their decision to sell or transfer units easier. The next logical step in this regard would be the listing of units because dematerialisation would enable the viewing of holding units, but investors won’t be able to trade the units in the open market unless they are listed.


Disclaimer:

The details mentioned above are for information purposes only. The information provided is the basis of our understanding of the applicable laws and is not a legal, tax, financial advice, or opinion and the same subject to change from time to time without intimation to the reader. The reader should independently seek advice from their lawyers/tax advisors in this regard. All liability with respect to actions taken or not taken based on the contents of this site are hereby expressly disclaimed.
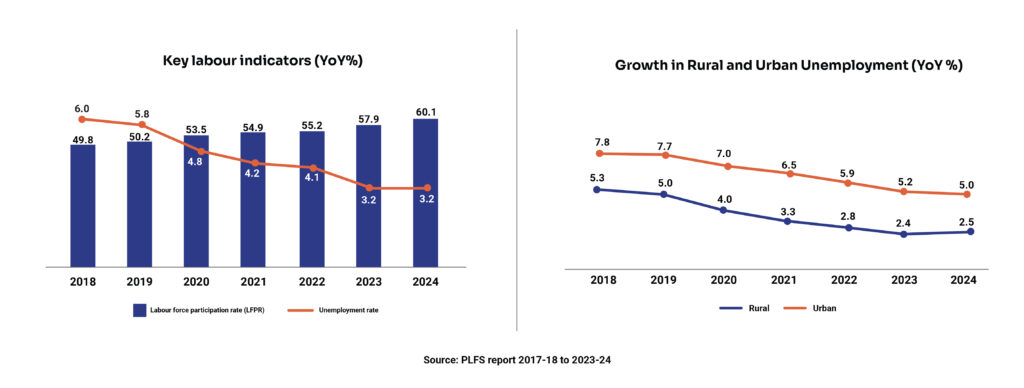
Union Budget and RBI MPC – A roundup of the two key events

The last one week has been extraordinary for the Indian economy and capital markets as they were moved by the Union Budget on Feb 1 and RBI Monetary Policy Committee (MPC) Meeting on Feb 8. Let us look at each of them.

Union Budget FY24

The Union Budget for FY24 was no doubt a balancing act between fiscal prudence and growth. This happens as the domestic economy has been witnessing broad-based recovery post the pandemic amid the slowdown in the global economy.

According to a recent study by IMF, global growth is expected to come down from 3.4% in 2022 to 2.9% in 2023 but it will recover to 3.1% in 2024. However, the slowdown is expected to affect most of the advanced economies compared to the emerging markets and developing economies. India is identified as the bright spot. Along with China, it is projected to account for ~50% of global growth in 2023 compared to just one-tenth for the US and Euro regions combined. Hence, to keep the resilience in domestic demand and retain the ongoing recovery, it is imperative for the govt to focus on growth.
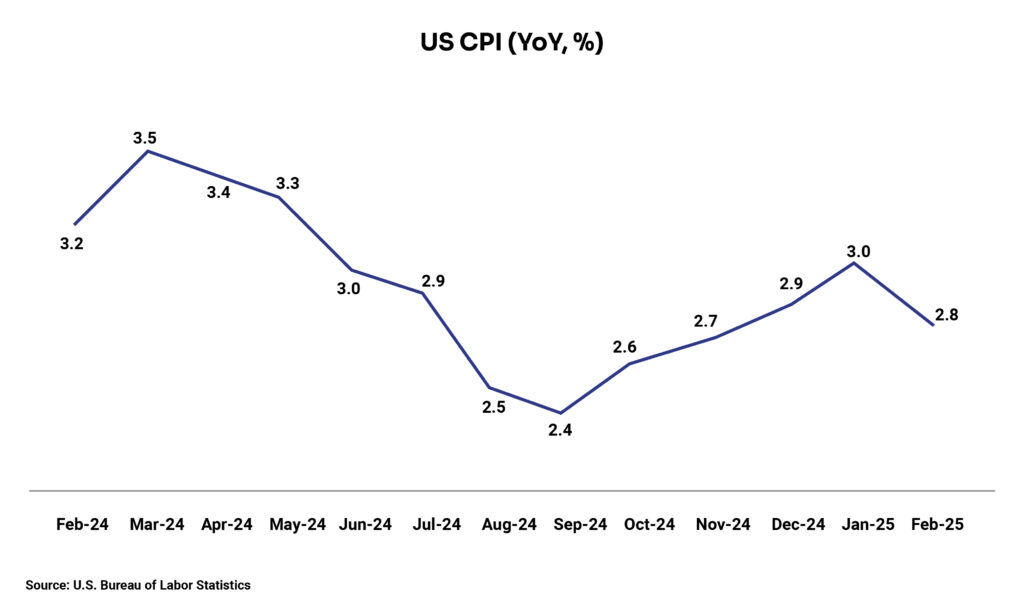
Capital expenditures

Like in previous years, the Centre has resorted to capital expenditures to boost the economy. For FY24, it increased the capital outlay for the third year in a row by 33% to INR 10 lakh crores (which is ~3x the outlay in FY20), accounting for 3.3% of GDP. The budgetary capex is aimed at public infrastructure with roads & highways (INR 2.6 lakh crores), railways (INR 2.4 lakh crores), and defence (INR 1.7 lakh crores) being the top three sector recipients.

The decade-high capex spending along with the extension of a 50-year interest-free loans to states by one more year is expected to have a multiplier effect on economic activities, creating jobs, crowding-in private investment and enhancing growth potential to safeguard the economy against the global headwinds.

Fiscal prudence

The Centre has proposed to reduce the fiscal deficit from 6.4% (RE) in FY23 to 5.9% (BE) in FY24 eventually to sub-4.5% by FY26. The need to kick in the fiscal prudence in the current budget emanated from higher deficits (9.2%) during Covid leading to a rise in debt and interest repayments. The share of interest payments as a percentage of revenue expenditure has, in fact, increased from ~27% in FY20 to ~31% in FY24 (BE).

The government plans to reduce the fiscal deficit in FY24 mainly by lowering the budgeted revenue expenditure (such as by slashing fertiliser and food subsidies by 22% and 31%, respectively) and by the estimated modest growth in tax receipts (10.4% in FY24 over the revised estimate of FY23). If the moderation in inflation continues, the future trajectory of rate hikes could soften aiding stronger economic growth thereby boosting tax revenues.

Government borrowings

The government proposed to finance the fiscal deficit of FY24 with gross market borrowings (done mainly via issuance of bonds or g-secs and the remaining via small securities savings and other sources) of INR 15.4 lakh crores (up ~8% over FY23 (RE)). This came lower than the median of bond market expectations of ~INR 16 lakh crores.

Cues for Alterative Investment Funds (AIFs)

From the perspective of AIF industry, the government has further supported International Financial Services Centre (IFSC) in GIFT City by delegating powers from other regulators to International Financial Services Centres Authority (IFSCA) to avoid dual regulation, introducing a single window approval mechanism, and bringing necessary amendments in the existing tax regime for funds set up in IFSC. This will encourage both the launch of new funds in IFSC as well as the relocation of existing funds to it.

Also, the reduction of the highest surcharge rate from 37% to 25% would be welcomed by individual investors earning interest income through debt funds.


Outcome of RBI MPC Meeting

RBI’s Monetary Policy Committee has hiked the repo rate for the sixth time in a row in a 4:2 majority decision. The key rate at which the central bank lends short-term funds to commercial banks now increased by 25 basis points (bps) to 6.5% while the policy panel retained its focus on the withdrawal of the accommodative policy.

This is the smallest hike by magnitude starting from May 2022. This can be attributed to softening of retail inflation (which fell from the peak of 7.8% in Apr 2022 to 5.7% in Dec 2022) and the US Fed signalling to adopt moderate rate hikes in the near term after announcing their eighth interest rate increase in a year at its first meeting of 2023.

In this fiscal year, the cycle began with a 40 bps hike last May followed by three consecutive hikes of 50 bps and then with 35 bps in Dec 2022. RBI governor Shaktikanta Das in a previous media interaction had said that “High policy rates for a longer duration appear to be a distinct possibility, going forward”.

Inflation

RBI cut its inflation forecast marginally for FY23 from 6.7% in the December meeting to 6.5% currently. The current projection assumed normal monsoon as before and lower prices of crude oil at US$95/barrel than previously.

Inflation for FY24 is projected to be lower than FY23 at 5.3% with 5% during Q1, 5.4% during Q2, 5.4% during Q3, and 5.6% during Q4. Notably, RBI has the mandate to ensure that retail inflation remains at 4% with a margin of 2%.

However, the central bank has noted some stickiness of the core inflation due to an anticipated upward thrust on commodity prices with the easing of Covid-related restrictions and the continued pass-through of input costs to output prices, especially in services. Input cost and output price pressures are expected to soften in the manufacturing sector though.

Growth Forecast

RBI has upped the forecast of real GDP growth for FY23 from 6.8% in its December meeting to 7% currently, attributing the driving factors to private consumption and investment. The forecast for FY24 is pegged at 6.4% with 7.8% in Q1, 6.2% in Q2. 6% in Q3, and 5.8% in Q4.

                                  Movement in Bond Yields

Post-Budget, the bond market calmed due to the downward bias in fiscal deficit projections and lower than expected level of gross market borrowings forecast. This is mainly reflected in the G-Sec and NBFC yields in the above chart. After the repo rate hike decision came in, 3-year G-Sec yields again ticked upward to 7.18% on Feb 8.


Disclaimer:

The views provided in this blog are the personal views of the author and do not necessarily reflect the views of Vivriti. This article is intended for general information only and does not constitute any legal or other advice or suggestion. This article does not constitute an offer or an invitation to make an offer for any investment.  

Macroeconomic tailwinds to propel growth in private credit investment and AIFs

The supply of credit remains an undeniable catalyst for the growth of the Indian economy. In its journey to becoming a US$5 trillion economy, India requires a credit supply that amounts to ~50% of that targeted economy size. Meeting that supply size could be a daunting task unless private credit markets mature in India. This is because banks and NBFCs have been increasingly shifting their lending mix towards retail over the last few years due to the advent of technology-led lending models as well as risk aversion towards corporate lending.

The perennial need for private credit has already been realized, not only in India but across the world. Globally, private credit accounts for 10-15% of assets under management under private capital, which includes private equity, venture capital, real estate, etc. Post the pandemic, the surge in liquidity in the global market has shifted a lot of investment in private credit towards emerging markets, including India, where it gained major traction due to favourable economic and administrative reforms.
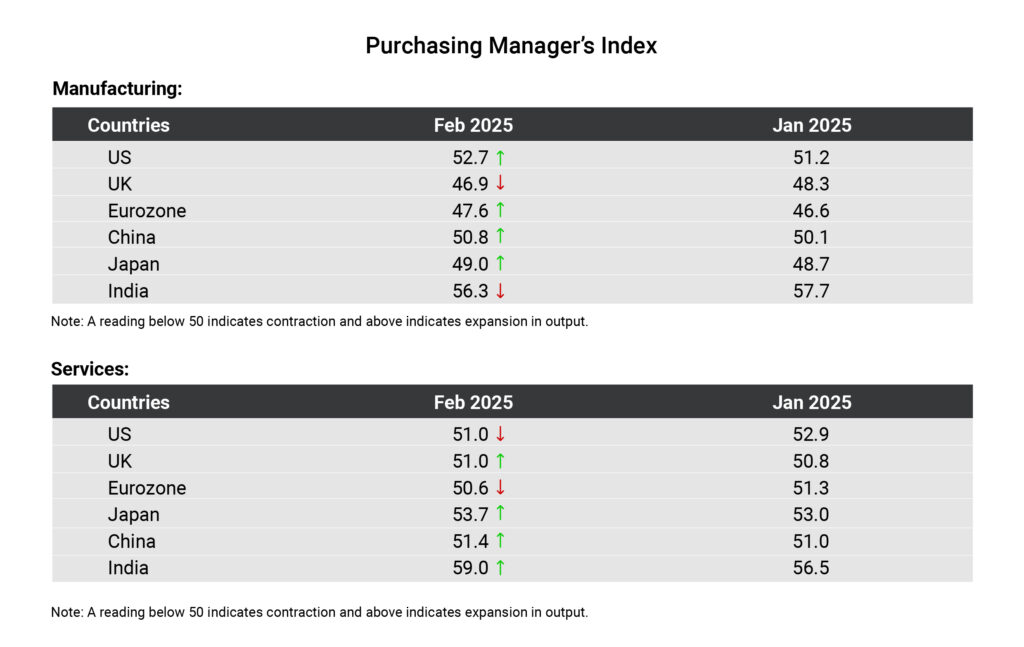
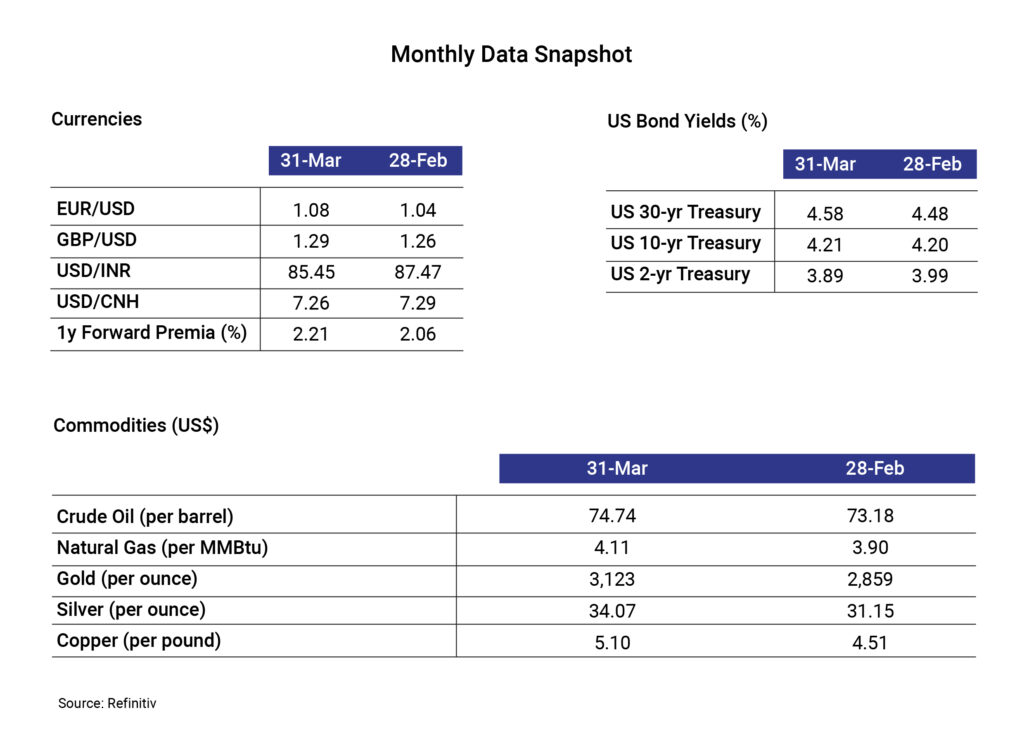
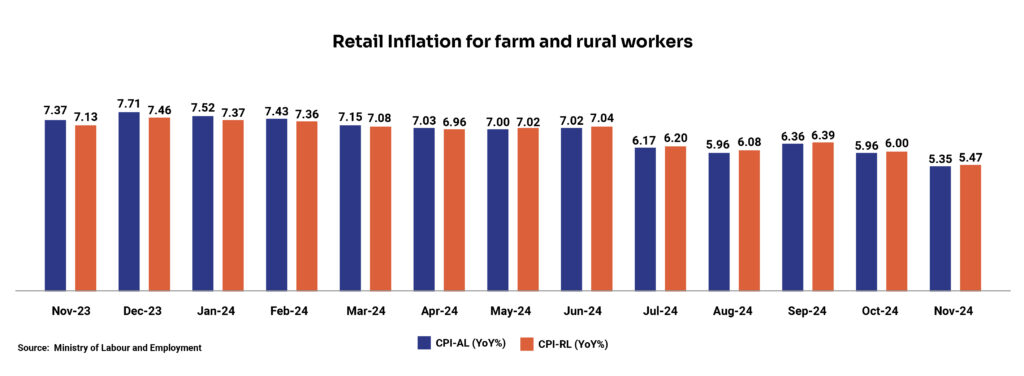
Private credit opportunities in India

The opportunities for private credit in India emanate from structural issues in the debt market. Following the global financial crisis, the banking sector became increasingly risk averse towards the mid-corporate space. Asset managers sharply cut down their allocations to the mid-corporate segment since 2018-19, following defaults by IL&FS, and the freeze of withdrawals in the credit schemes managed by Franklin Templeton. On the other hand, non-bank lenders in corporate lending largely migrated to retail / MSME credit, after facing a liquidity crunch in 2018.  As a result, the mid-market enterprises (comprising privately owned companies majorly located in tier 2/3 cities) have faced a pronounced lack of access to debt.

The opportunities are also arising out of asymmetry in the credit market and mispricing of risks causing much lower growth in lending to companies with a credit rating of A and below compared to the same in the AA and AAA rated universe.

The above factors have resulted in a massive gap in the private credit market and consequently significant opportunities for private credit to grow. With a shortage of liquidity and mispricing of credit, the universe of corporates rated below AA offers rich risk-adjusted returns to discerning lenders.

Shift towards AIFs

When it comes to the type of structure that is needed for the growth in private credit, Alternative Investment Funds (AIFs) fit the bill. The surge in the industry’s commitments raised, which denotes the amount clients are willing to invest in AIFs, in recent years strongly depicts the phenomenon of AIFs playing that vehicle of growth for private credit. Thanks to their flexible structure (with respect to investment in unlisted entities, etc) and regulations supporting the investment vehicle.

AIFs have been able to take care of the supply side for private credit by raising funds from HNIs, family offices, corporate treasuries, and institutions in the domestic market over the last few years. Despite the recent surge in interest rates, the segment still looks attractive.

Performing Credit as a segment within Private Credit

Within the private credit space, India has witnessed the highest attention towards real estate funds, special situation funds, venture debt funds, and distressed funds. While these funds meet the specific needs of the market, these funds typically seek IRRs of more than 16%.

This leaves a large gap in the market, as evidenced in the graph below.

With MFs typically lending at finer rates, and venture/distressed/RE/special situation funds above 16%, the space between 8% – 16% is quite wide open. This space consists of cash flow-based lending to operating companies, focusing on growth, long-term working capital, capital expenditure, etc.

What’s in it for investors?

The above chart depicts that as we move away from AAA to AA rated bonds down to BBB rated companies, a lucrative opportunity for investors exists in a white space, known as the Performing Credit, which lies between mutual funds and distressed debt funds & others at the two extremes. Investment opportunities in this space are expected to go up to $100 billion in the next 3 to 5 years.

The environment for growth in the private credit space including the performing credit is favourable from the demand side. Mid-corporates that are unrated, or rated in the range of BBB and A, are growing well at a pace higher than witnessed by large corporates. Our analysis indicates that 15,000+ such companies exist that are profitable at an OPBITDA level (Operating Profit before Interest, Tax, Depreciation, and Amortisation).

Fresh capital has been drying up due to the tightening of markets. Hence, private credit funds get more advantage to negotiate for higher rates as a provider of scarce capital to enterprises. India’s excellent rating and data coverage offer non-linear opportunities compared to any emerging market. Given these, it is possible to build a truly diversified and stable performing credit portfolio.

Risks in the space

In the private credit space, investors face risks, arising from governance standards, poor disclosures, management capability, operational performance, financial situation, etc. However, with some of the recent regulatory steps and professional fund management, such risks can be mitigated ensuring stability and predictability of returns.

The Insolvency and Bankruptcy Code, enacted in 2016, imparted confidence to lenders about the covenants getting adhered to if the borrowing entity turns insolvent or sick. Secondly, the introduction of the Account Aggregator framework in 2021 created Account Aggregators to act as intermediaries between financial services providers and facilitate sharing of financial information. The framework enabled transparency and the scope for efficient decision-making about borrowing entities. Information asymmetry has been reduced in the recent past with such measures – providing lenders with access to related party information, GST data, bank statements, financial disclosures, etc., for detailed governance checks.

Choosing a highly professional fund manager is extremely useful while investing in the space. Investors should look at fund managers that leave no stone unturned for strict due diligence, comprehensive business monitoring to reduce information asymmetry, excellent sourcing ability, tight quarterly monitoring, and accurate pricing of risks, among several factors.

GIFT City – a new window of opportunity

International Financial Services Centre Authority (IFSCA), the regulator at GIFT City, Gujarat was set up to undertake financial services transactions that are currently carried outside Indian soil by overseas financial institutions and foreign subsidiaries of Indian financial institutions. New regulations issued by IFSCA in April 2022 could aid the next level of growth for private credit funds by providing a framework comparable to Singapore and other global asset management centres for setting up funds.

AIFs set up within IFSC have been granted special dispensations to provide them with higher operational flexibility. The regulatory and tax framework set up within the GIFT City has the potential of unlocking access to large global pools of capital. For meeting a US$ 100 billion need, the infrastructure provided by the GIFT City is much needed for private credit managers to scale and meet the need of the market.


The article has also been published in Mint (Online) on February 4, 2023. You can read it here:

What to expect from the upcoming Union Budget 2023 as an AIF Asset Manager


Disclaimer:

The views provided in this blog are the personal views of the author and do not necessarily reflect the views of Vivriti. This article is intended for general information only and does not constitute any legal or other advice or suggestion. This article does not constitute an offer or an invitation to make an offer for any investment.